Daily Sharing
Bitcoin experienced a rapid drop yesterday, and then today there was a V-shaped reversal to above 106000, which has left many people confused.
Has this kind of market trend occurred before?
Answer: This kind of trend has occurred frequently in the past. I don't know if everyone often reviews the K-lines from the past year or two. If you frequently look back at the past K-lines, you'll find it's completely normal. Generally, there are two common types of trends that exhibit this kind of movement.
The first type is that the downtrend has not yet been established and is still in a large-level central zone fluctuation. For example, the central zone of 9 upgrades often indicates that the expected 1-hour or 4-hour level has not yet materialized, with occasional single-segment trends appearing in between. The central zone fluctuation may then show certain sub-levels either breaking above or below the central zone, followed by a reversal in the opposite direction. In practice, this translates to frequent door painting and V-shaped reversals.
The second type is that in the early stages of a large downtrend, there is often a strong drop first, followed by a sudden V-shaped reversal, resulting in a significant secondary sell-off, after which it drops again.
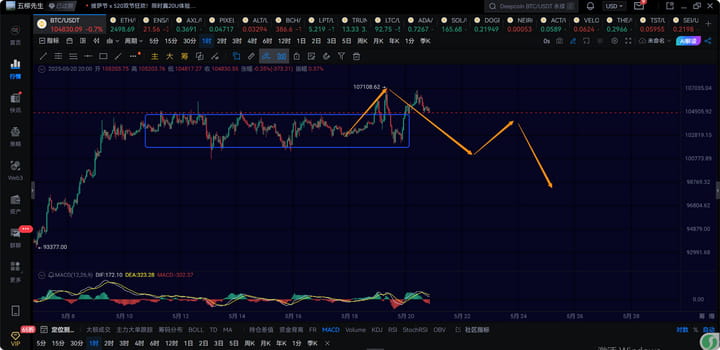
So is it the first type or the second type here? We can observe. If it can rise again to above 107000 tonight or in the early morning, then the high from the day before and the pullback yesterday are part of the central zone fluctuation. The real departure may still require another upward push, after which a 4-hour level pullback starts. If there is no further upward push, then it actually indicates a secondary sell-off.
Overall, it seems that we are at the end of a 4-hour level rebound, with limited space expected above, and a phase pullback will still come.
BTC
Due to the rapid changes in the short term, the article can only make predictions based on the market changes at the moment of publication. Short-term players should pay attention to the latest market changes, which should only serve as a reference.
1H:
At the 1-hour level, everyone is quite confused, especially when it rose above 106000 again this morning; many people are already lost.
In fact, it's quite simple. First of all, yesterday's drop has actually disrupted the original 1-hour level rebound structure, so we can look for a 1-hour level drop or a 4-hour level drop; logically, there is no problem with this.
The only concern is that after Bitcoin's rebound above 106000 this morning, we are uncertain whether it will continue to break above 107100, which could lead to a failure in the 1-hour level drop.
For this question, in fact, you shouldn't get too caught up in the trap of prediction. Whether Bitcoin will break above 107100 again this morning doesn't require our prediction; the market will develop as it will, irrespective of anyone's guesses.
We just need to be prepared for any changes in the trend. According to the trend logic, as long as today's Bitcoin rebound does not break above 107100, the 1-hour level downtrend remains unchanged. If you need to short, continue to do so; if it breaks above 107000, just be prepared to cut losses.
Returning to the current market, the structure of Bitcoin's 1-hour level drop still hasn't changed, so according to the original logic, we continue to expect a 1-hour level drop. It is also likely the first 1-hour level drop in the 4-hour level drop. This 1-hour level drop may have some changes in expected pullback points due to today's rebound, with support around 100200 to 101000.
Of course, if it breaks above 106400 again in the short term, it is believed that the structure of Bitcoin may have changed, and short positions can exit early. Let's observe and see the strength of the pullback tonight until dawn.
15M:
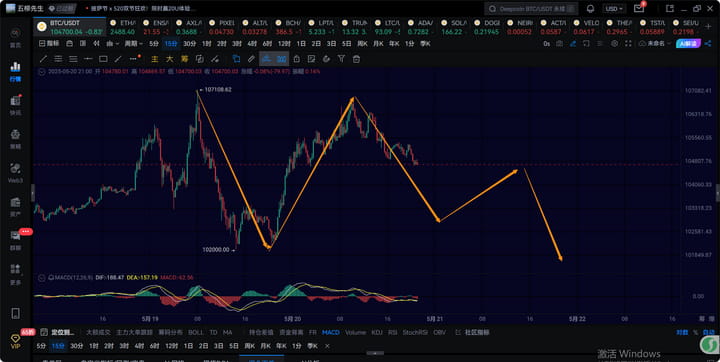
15-minute level: The expectation here is to continue moving downwards. As long as it doesn't break 106400 again, it is believed that this is still in the process of a 1-hour downtrend. Whether there will be a consolidation in a 15-minute central zone in between will need to be observed later.
ETH
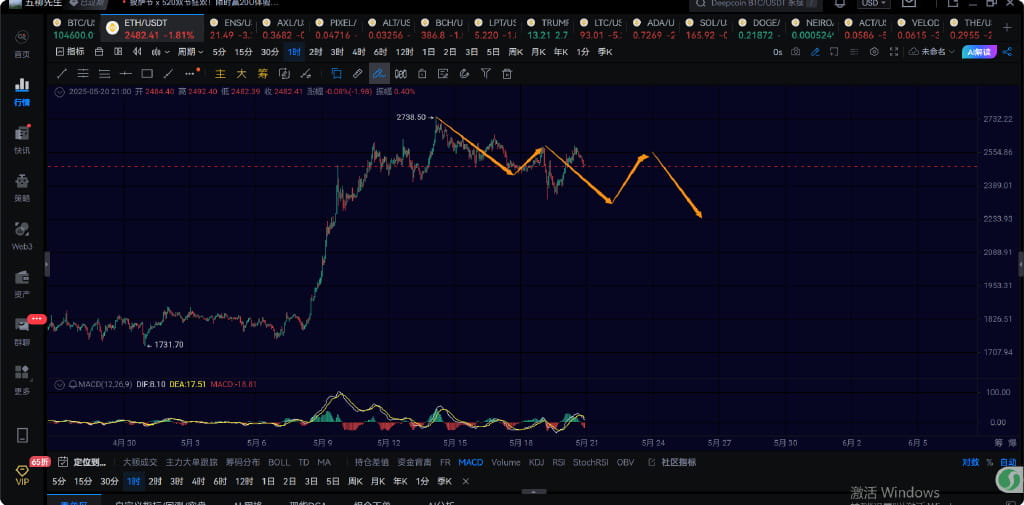
For Ethereum, I personally believe that it will continue to swing down here, with a higher probability of conducting a 4-hour level pullback. Today it slightly broke below 2587, but the extent of the break is not large, so it can be considered still a 1-hour level pullback.
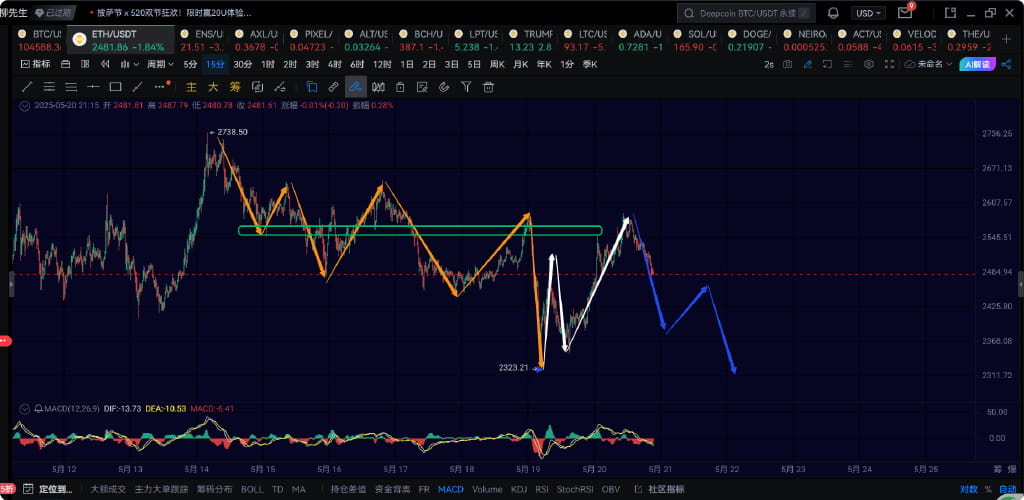
Or the internal structure can be divided this way, which makes the trend a bit clearer. Let's see if Ethereum continues to retest around 2300 by tomorrow noon. The resistance above is 2587; if it breaks through this position again, the above two structural divisions will be invalidated. Just prepare for different trend scenarios.
Trend direction
Weekly level: The direction is upwards, and we are currently on a new upward trend at the weekly level, with an overall target above 150000.
Daily level: The direction is upwards, and a daily rebound is underway, with a probability of continuing to set historical highs.
4-hour level: The direction is downwards. To be more precise, we need Bitcoin to break below 102000 to confirm a 4-hour pullback. Currently, there is an expectation of a 4-hour pullback.
1-hour level: The direction is downwards. If it does not break above 106400 again, continue to look for a 1-hour pullback near 100000.
15-minute level: The direction is downwards. First, observe the strength of the 15-minute level pullback tonight to see if a central zone is formed.

