Daily sharing
On May 19, the big coin surged to around 107100, followed by a pullback that fell to around 102000. This pullback made us mistakenly think that the big coin had begun a 4-hour level pullback, but in fact, with today's surge above 107000 again, the prediction of a 4-hour level pullback is still very difficult. Therefore, we can only wait for another retest to go long. We will only look for a decline after a definite 4-hour level pullback signal appears.
Summary of recent article viewpoints.
On May 11, it was advised to mainly look for long positions on pullbacks. The 4-hour level rebound has not ended, the next target is 107000.
On May 12, a 1-hour level pullback, a retest near 100000 is a normal pullback. After the pullback, look for 107000. If it breaks below 100000, look for a 4-hour level pullback.
On May 13, the 1-hour level pullback is not complete, continue to look for a retest near 100000.
On May 14, the probability of a 4-hour level pullback of the big coin is increasing.
May 15, see if the big coin will accelerate its decline tonight. If it breaks through 103500 tonight, it indicates that the bulls are dominant, and it will likely break through 106000 subsequently.
On May 16, the big coin did not manage to decline, and there is a probability of another upward spike above 106000 in the short term.
On May 17, the big coin is in central oscillation. As long as it does not break 101000, it will continue to extend upward.
On May 18, see if the big coin can successfully surge to 107000.
On May 19, the big coin surged to around 107000, likely reaching a temporary peak, undergoing a 4-hour pullback, and if it re-breaks below 101000, it can be confirmed.
On May 20, if the big coin does not break 107100, the structure remains unchanged. If it breaks, it may continue to oscillate upwards.
The above is a summary extracted from the content of daily articles, without any alteration of the original meaning. The above viewpoints can all be found in the corresponding articles of that day. From the above summary, we can actually see that wanting to accurately predict the short-term trend for the next day every night is understandably difficult. Our short-term bullish and bearish views have been changing, but we still cannot fully align with the market's direction.
Next, the big coin should still have a chance to surge again to the range of 108500~112000 in the short term, and only after that will it have the opportunity for a 4-hour level pullback.
BTC
Due to the rapid changes in the market, the article can only make predictions based on the market changes at the moment of publication. Short-term players should pay attention to the latest market changes, and this should only serve as a reference.
1H:
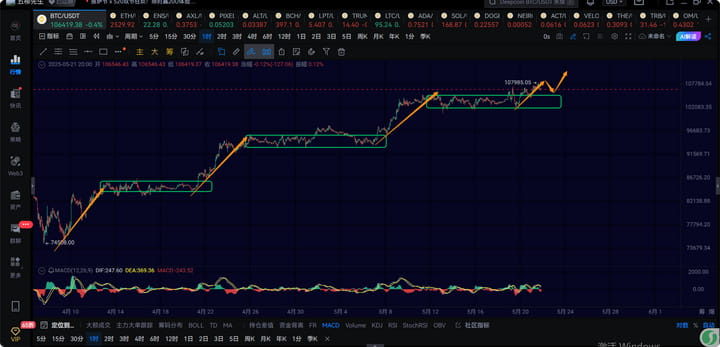
1-hour level, the big coin surged from around 103000 to around 107100 from the 18th to the 19th. We mistakenly thought this was a rebound in the 1-hour level central departure segment. From the current trend, that upward surge still belongs to the central oscillation range. In the last 10 days, the big coin has had two occurrences of up and down spikes. The first was on May 12, spiking up to 105819, followed by a quick spike down to 100718.
The second occurrence was on May 19, spiking up to around 107100 and then quickly spiking down to around 102000.
These two spikes up and down have led to a misjudgment of the short-term trend. The previous up and down spikes actually met our expectations, as we predicted 2 to 3 days in advance that after an upward spike, it would pull back to around 100000, which basically matched our prediction. However, the structure of the first spike was only at the 15-minute level, which did not align with our expectation for the 1-hour level pullback structure.
The second upward spike to 107100 actually meets our expectations. We made predictions two days in advance, judging that if it does not break 101000, it will surge again to around 107000. However, the quick downward spike after the upward spike was beyond our expectation, leading us to momentarily believe that a 4-hour pullback was imminent, but it turned out it did not happen.
So the current upward movement here is likely a true upward movement of the central departure segment. After the surge, observe whether there is a 1-hour level central three-buy. Personally, I expect after a short-term small pullback, there will be another upward surge to the range of 108500~112000.
15M:
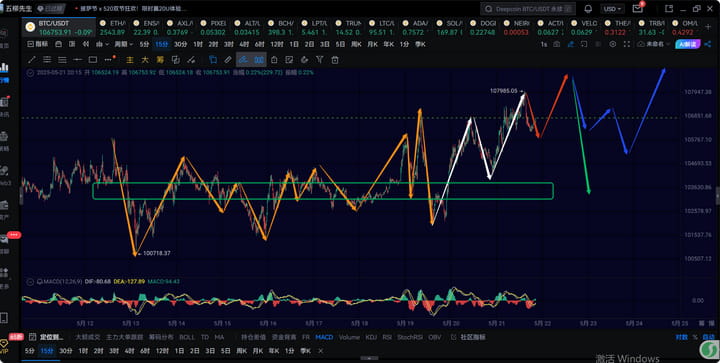
15-minute level, the previous day's rise and fall of the big coin actually still falls within the 1-hour level central oscillation range, because the drop from 107100 to 102000 is not a 1-hour level drop, and today it has broken through 107100 again, indicating that the previous rebound from the 1-hour level central departure segment was incorrect, today's upward movement may be the departure segment of the 1-hour level.
In the short term, watch for a 15-minute level pullback to see if it returns to around 105700. After that, there may be another 15-minute level rebound pushing up to around 108000. When a 1-hour pullback occurs later, see if it breaks below 104000. If it breaks, it may end the 4-hour level rebound. If it does not break, there could still be a central three-buy to continue the rise.
ETH
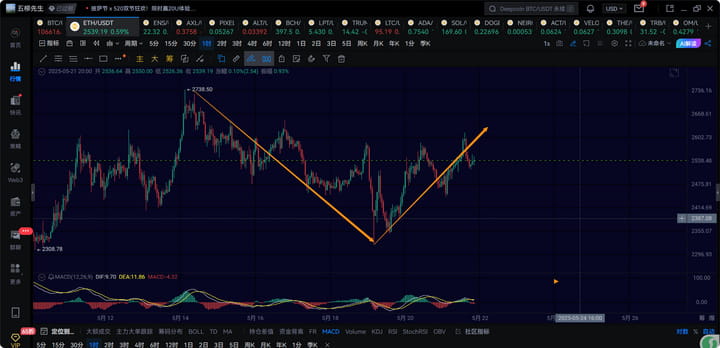
The structure of Ethereum here should be a different structure defined last night. 2738~2323 is a 1-hour level pullback, currently undergoing a 1-hour level rebound. If this rebound cannot break through 2680 again, the short-term should go for another 1-hour level pullback to around 2400.
At the 15-minute level, if the retest does not break 2470 here, there should be another 15-minute level rebound to push above 2600.
Trend direction
Weekly level: direction upward, currently undergoing a new weekly level rise, with an overall target above 150000.
Daily level: direction upward, currently undergoing a daily level rebound, this daily rise has a probability of continuing to set a new historical high.
4-hour level: direction upward, the 4-hour level pullback has failed, continue to observe the continuation of the 4-hour level rebound.
1-hour level: direction upward, short-term 1-hour rebound looks for another surge to around 108000.
15-minute level: direction downward, observe the strength of the 15-minute level pullback here, if it remains above 105000, it should continue to extend.

