1. Bullish counterattack scenario: Stabilizing above 655.6 starts an upward trend
If the 1-2 hour K-line remains stable above 655.6 during the night and meets the following conditions, it can be determined that a small-scale pullback has ended, and bullish momentum is expected to be released:
1. K-line pattern confirmation: Bullish patterns such as bullish engulfing and hammer candlesticks appear, or form bottom structures like "W bottom" or "triple bottom," indicating that buying pressure is actively absorbing selling pressure, and bullish forces begin to dominate.
2. Volume-price relationship verification: Trading volume increases by 20%-30% compared to the previous trading day, showing a healthy trend of "price rises with volume increases, price falls with volume decreases," indicating that funds continue to flow into the market, providing momentum for the upward movement.
3. Technical indicator resonance:
- MACD: A golden cross forms below the zero axis, and the histogram changes from green to red, indicating strong short-term momentum;
- RSI: Breaks above the 50 value and maintains above 55, indicating that bulls dominate;
- Moving average system: Short-term moving averages (such as 5/10-day lines) cross above mid-to-long-term moving averages, forming a bullish arrangement.
Upward target planning:
- First resistance: 664.2, this level is a recent oscillation high; breaking above it will open up short-term upward space;
- Secondary resistance: If it effectively breaks above 664.2, it can challenge 671.1, which is an important psychological level and technical pressure point;
- Ultimate target: If market sentiment continues to heat up, 679.5, as a previous high and round number, will become the ultimate target for bulls.
Trading strategy:
- Entry: After confirming the price stabilizes at 655.6 and meets the above signals, lightly enter long positions with a position size controlled at 10%-15% of total capital;
- Position: Use a "ladder-style take-profit" strategy, reducing positions by 30% with each breakthrough of a resistance level to lock in profits;
- Stop-loss: If it breaks below 655.6 by 2-3 points (approximately 652.6-653.6), decisively stop-loss to avoid the risk of trend reversal.
2. Bearish continuation scenario: Losing 655.6 increases the risk of pullback
If the closing price of the 1-2 hour K-line fails to stand above 655.6 and is accompanied by the following characteristics, it indicates that the bears dominate, and the market may continue to adjust:
1. Validity confirmation of the breakdown: Two consecutive K-line bodies are located below 655.6, with short upper shadows, indicating firm selling pressure from the bears.
2. Abnormal volume expansion: During declines, trading volume surges to more than 1.5 times the average of the previous five days, forming a panic selling wave and accelerating price declines.
3. Technical indicators weaken:
- MACD: A death cross forms above the zero axis, and the histogram changes from red to green;
- RSI: Falls below the 50 value, and the market enters a weak zone;
- Bollinger Bands: Price falls below the middle line, and the middle line turns downward.
Downward support level analysis:
- First support: 648.6, as the bottom of the short-term consolidation range; if it is lost, it will trigger a technical breakdown;
- Secondary support: Further attention to 640.4, as this position is the key support of the previous oscillation center;
- Strong support level: In extreme cases, 631.3 may trigger bottom-fishing funds to enter, forming strong support.
Trading strategy:
- Entry: After effectively breaking below 655.6, take a short position in the direction of the trend, with a position size controlled at 10%-15%;
- Position: Gradually reduce positions after reaching the support level, such as reducing by 30% if it touches 648.6 and reducing by another 30% if it breaks below 640.4;
- Stop-loss: If it breaks above 655.6 by 2-3 points (approximately 657.6-658.6), immediately stop-loss to prevent bear traps.
3. Sideways oscillation and risk control strategy
1. Sideways response: If the price oscillates narrowly within the range of 655.6±3 points without clear breakout signals (such as three consecutive K-line closing prices breaking the boundary), it is recommended to maintain a flat position and wait, avoiding blind trading.
2. Major event avoidance: Within 2 hours before and after major events such as Federal Reserve decisions and Binance platform policy updates, market volatility increases; trading should be paused to avoid uncertainty risks.
3. Indicator contradiction handling: When technical indicators show contradictory signals (e.g., moving averages are bullish but MACD shows a death cross), do not participate in trading; wait for the signals to unify before acting.
4. Strategy summary and risk warning
The core of the BNB night market is the gain or loss at the 655.6 level: if it holds above this level, the bulls will start; if it loses, the bears will continue. Investors need to strictly judge based on K-line patterns, changes in trading volume, and technical indicators, combined with position management and stop-loss discipline to execute strategies.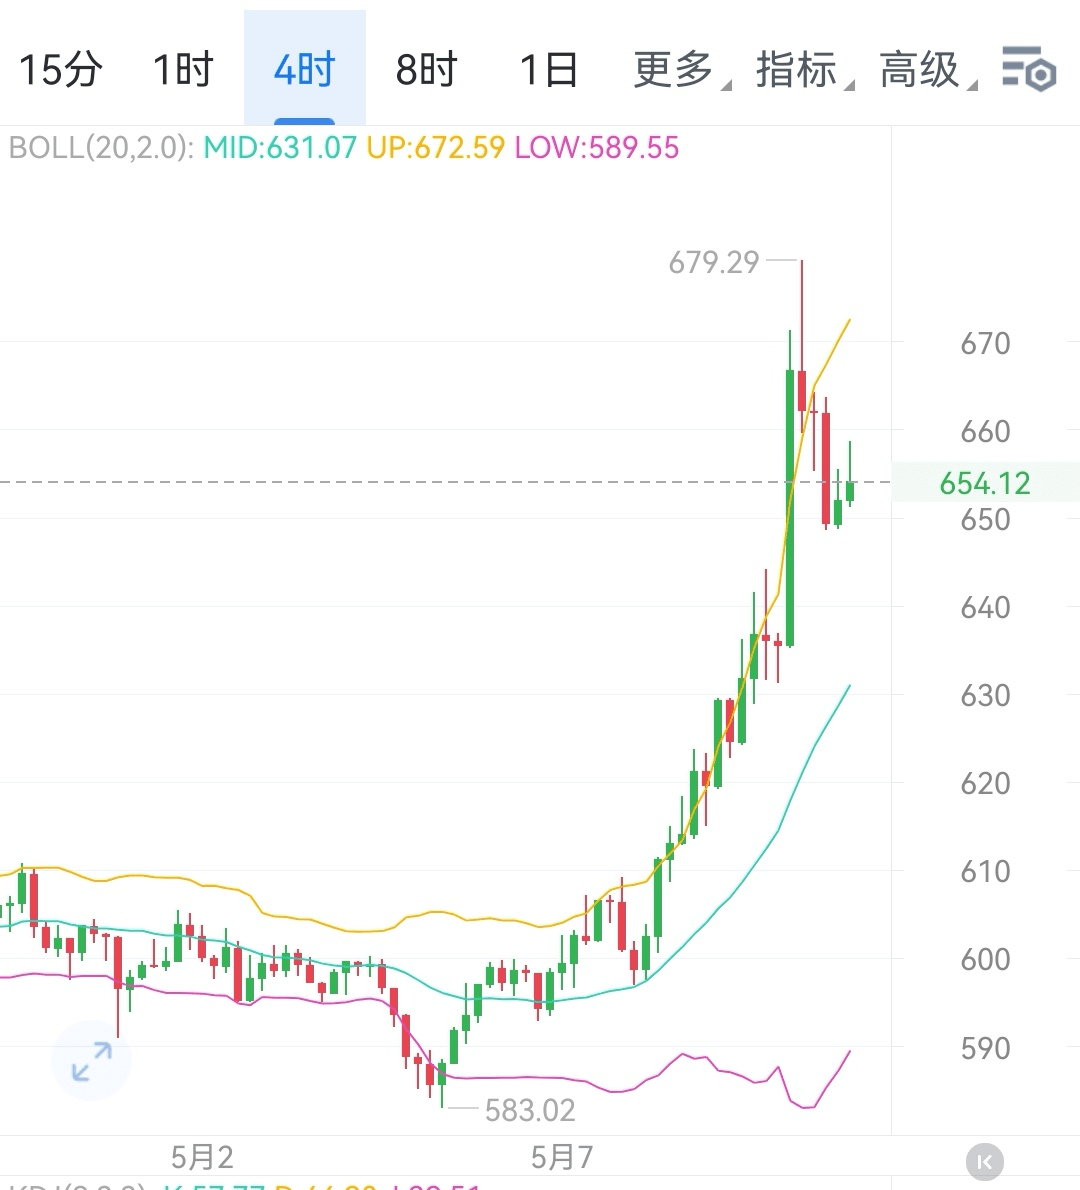 $BNB #BNB走势
