1. Core point analysis
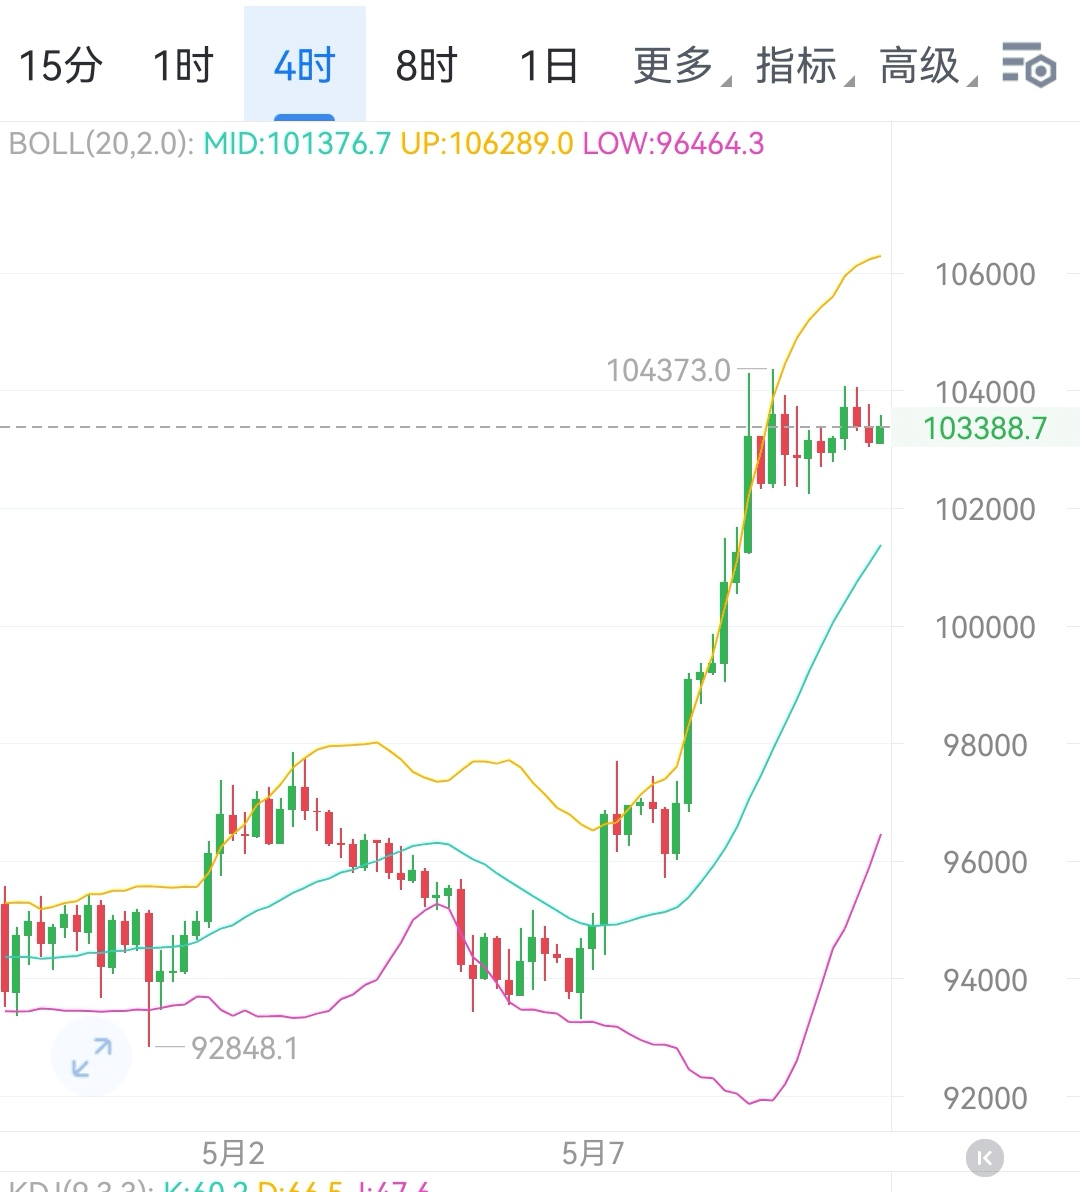
1. Bull-bear watershed: 103200 serves as the lifeline of short-term trends; if the price stabilizes above this level, bullish momentum is expected to continue; once the 1-2 hour candle body effectively breaks down, bears will dominate.
2. Upper resistance level
- First checkpoint: 104365, which is both a previous high position and a key resistance for upward movement after breaking 103200
- Secondary target: If successfully breaking 104365, subsequently pay attention to important resistance levels such as 105395, 106400, 107255
3. Lower support level: After dropping below 103200, 102350 serves as the first line of defense as the bottom of the range; if this support is lost, 100950, 99200, and 97730 will form a stepped support system below.
2. Scene-specific trading strategies
(1) Bull trading strategy
Entry conditions:
- Price stabilizes above 103200, and appears within 1-2 hour levels:
- Candlestick forms bullish patterns such as engulfing or morning star
- Trading volume increased by more than 20% compared to the previous trading session
- MACD indicator forms a golden cross below the zero axis
Position and profit-taking:
- First target level: 104365, reduce position by 30% to lock in profits after touching
- Second target level: 105395, reduce position by 30% after breaking
- Third target level: 106400, liquidate after reaching
Stop-loss setting: Unconditional stop-loss when dropping below 50-100 points (approximately 103100-103150) below 103200
(2) Short trading strategy
Entry conditions:
- Price valid drops below 103200, and meets:
- Continuous two bearish candles closing below 103200 in 1-2 hour levels
- Trading volume increased to more than 1.5 times the recent average
- RSI indicator drops below 50
Position and profit-taking:
- First target level: 102350, reduce position by 30% after touching
- Second target level: 100950, reduce position by 30% after breaking
- Third target level: 99200, liquidate after reaching
Stop-loss setting: Decisive stop-loss when breaking above 50-100 points (approximately 103250-103300) above 103200
(3) Flat observation strategy
1. Maintain a flat position when the price fluctuates within the range of 103200±150 points without forming a clear breakout signal
2. Pause trading for one hour before and after major economic data releases
3. Do not participate in trading when technical indicators show conflicting signals (such as moving averages indicating a bullish arrangement but KDJ showing a death cross)
3. Key points of risk control
1. Position management: Single trade position not exceeding 20% of total funds to avoid excessive risk exposure
2. Dynamic tracking: Review key levels gained and lost every hour, strictly enforce profit-taking and stop-loss discipline
3. Macro combination: Pay attention to US stock trends, stablecoin capital flows and other macro factors to assist decision-making
The current market is at a critical point for directional selection; the gains and losses around 103200 will directly determine the short-term trend direction. Investors need to strictly follow scene-specific strategies, through precise point control and a sound risk control system, to seize trading opportunities in a highly volatile market environment.$BTC #BTC走势分析