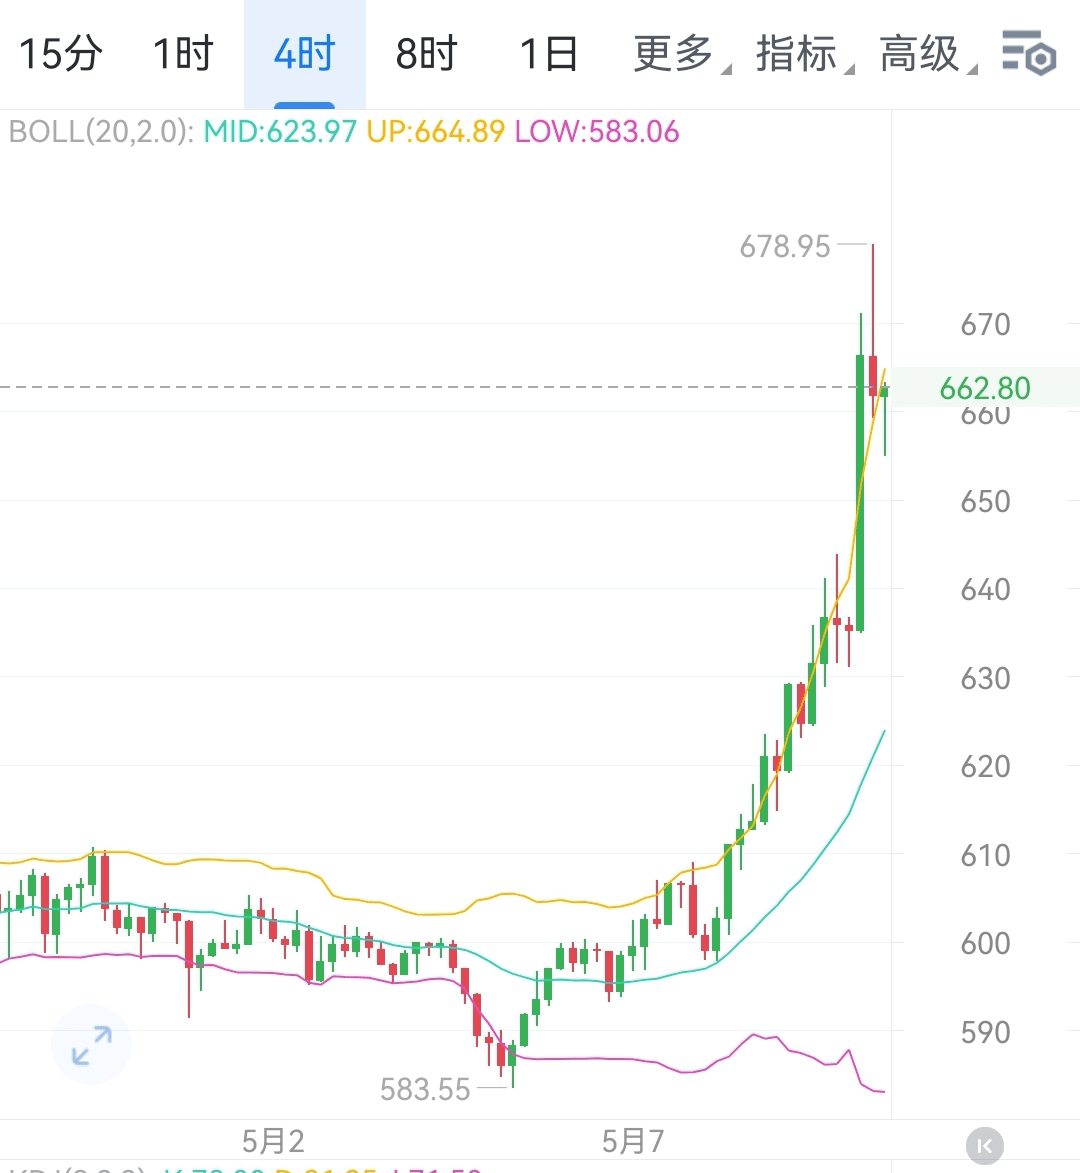
I. Core Level Analysis
1. Bullish and Bearish Trend Dividing Line: 654.3 is a key support level for judging short-term trends. If the 1-hour closing price stabilizes above this level, it indicates a continuation of the bullish trend; conversely, if it effectively breaks below, it signals the opening of a 1-hour correction.
2. Upper Resistance Level
- First Resistance: 671, as an important resistance for recent rebounds. If the price stabilizes above 654.3, it will first challenge this position.
- Key Levels: 680 (last night's high) and 684.5 are strong resistance levels that the bulls need to break through for further upward movement. Breaking through these levels is expected to open new space for increases.
3. Lower Support Levels: If the price falls below 654.3, 647, 637.8, and 630.3 will sequentially form a stepped support defense line. These levels have repeatedly served as support points in historical volatility and may trigger concentrated buying.
II. Scenario-Based Trading Strategies
(I) Long Entry Strategy
Entry Conditions:
- 1-hour candlestick closes above 654.3 for two consecutive candles, confirming effective support;
- Trading volume increased by over 25% compared to the previous trading day during stabilization, indicating capital inflow;
- Technical Indicator Coordination: MACD forms a golden cross above the zero line, RSI indicator breaks above 50.
Position and Take Profit:
- First Target: 671, reduce position by 30% to lock in profits;
- Second Target: 680, reduce position by 30%;
- Third Target: 684.5, exit all remaining positions.
Stop Loss Settings: If the price falls below 654.3 by 1% (about 647.8), decisively stop loss to prevent trend reversal risk.
(II) Short Entry Strategy
Entry Conditions:
- 1-hour candlestick closes below 654.3, and two consecutive bearish candles confirm the breakdown;
- Significant increase in trading volume during the decline (over 1.5 times the average), indicating bearish dominance;
- MACD forms a death cross below the zero line, RSI indicator falls below 50.
Position and Take Profit:
- First Target: 647, reduce position by 30%;
- Second Target: 637.8, reduce position by 30%;
- Third Target: 630.3, exit all remaining positions.
Stop Loss Settings: If the price rebounds and breaks above 654.3 by 1% (about 660.8), immediately stop loss and exit to avoid missing out on potential gains.
(III) Wait-and-See Strategy
1. Range-Bound Period: When the price fluctuates narrowly between 647 - 654.3 without clear breakout signals, maintain cash positions to avoid sideways risk.
2. Major Event Period: Pause trading within 24 hours before and after major announcements on the Binance platform or changes in industry regulatory policies to prevent violent fluctuations caused by news.
3. Indicator Conflict Period: If technical indicators show conflicting signals (e.g., moving averages are bullish but KDJ is oversold), do not participate in trading, wait for the trend to clarify.
III. Risk Control and Dynamic Management
1. Position Management: Do not exceed 20% of total capital for a single trade to avoid excessive losses due to short-term fluctuations.
2. Real-time Tracking: Set price alerts, closely monitor key breakout points, strictly execute take profit and stop loss plans, and avoid emotional trading.
3. Related Market Linkage: Pay attention to the trends of major coins like Bitcoin and Ethereum. If the overall market experiences significant volatility, prioritize adjusting strategies based on macro trends.
IV. Summary
BNB is currently at a key decision point in the short-term trend. 654.3 serves as a dividing line for bullish and bearish positions, significantly impacting the future market direction. Investors should strictly operate according to the entry conditions for long and short positions, maintaining cash when trends are unclear or risks are heightened. Through refined position control, stop loss settings, and dynamic tracking, capture opportunities in the highly volatile crypto market while reducing potential risks.$BNB #BNB走势