1. Core level analysis
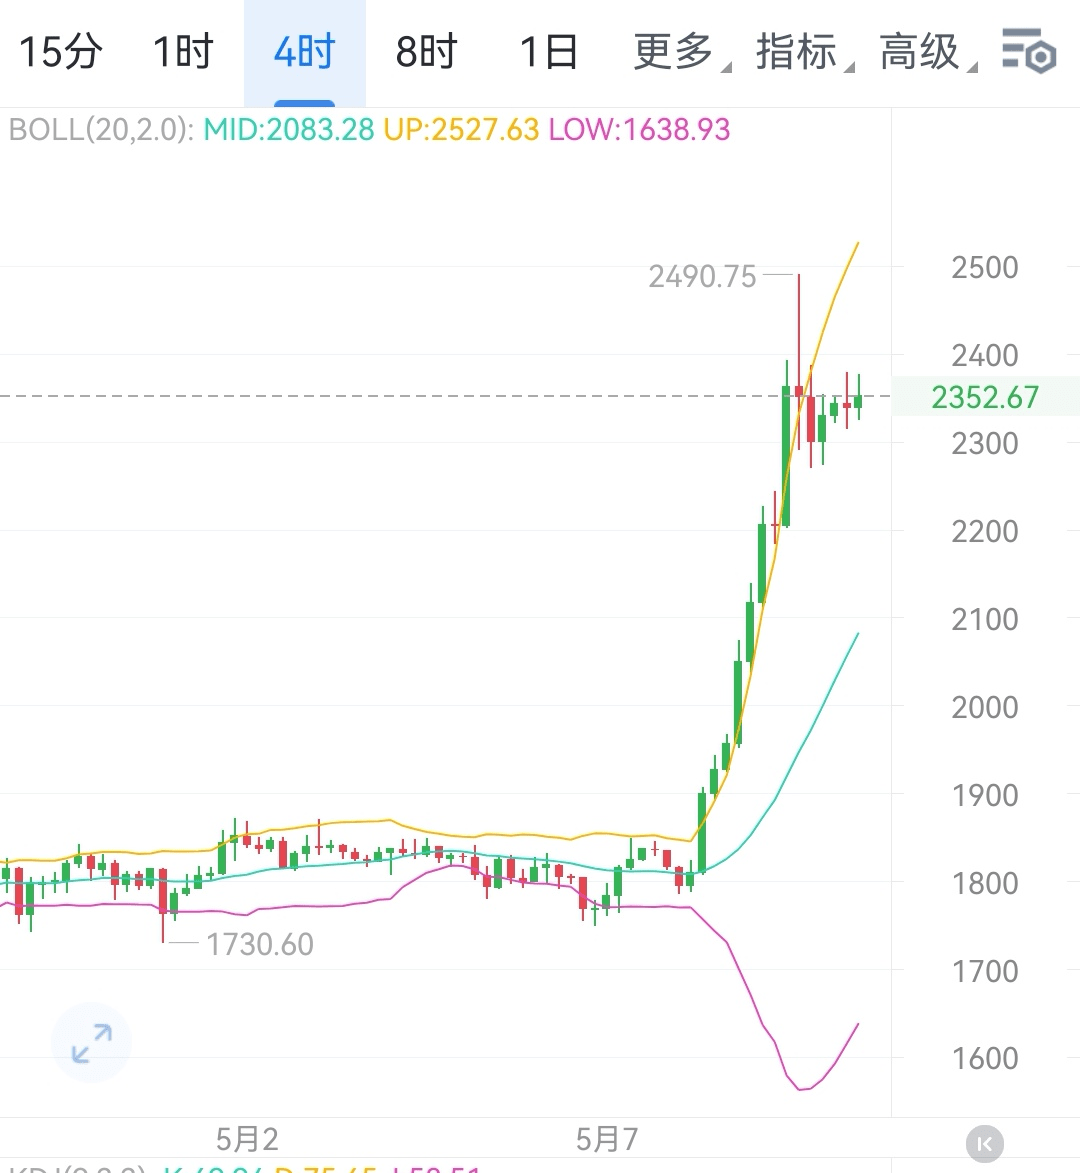
1. Bull-bear dividing line: 2270 acts as the lower edge of the sideways range and is a key support level for the short-term market. If the price stabilizes above this level, bulls still have a chance to recover; once it effectively breaks down, bears will take control.
2. Key resistance levels
- First checkpoint: 2389, the upper edge of the sideways range; breaching this level will open up upside potential.
- Secondary resistance: if 2389 is breached, subsequently focus on strong resistance levels of 2436, 2490, and 2550.
3. Lower support levels: after breaking 2270, 2203, 2156, and 2112 form a stepped support defense line, with each level potentially triggering concentrated buying.
2. Scenario-based trading strategy
(1) Bullish trading strategy
Entry conditions:
- Price stabilizes above 2270, and the following signals appear on the 1-2 hour level:
- Candlestick forms bullish engulfing, morning star, and other reversal patterns;
- Trading volume increased by over 30% compared to the previous trading day, indicating fund inflow.
- Technical indicators: MACD forms a golden cross below the zero axis, and RSI breaks above the 50 level.
Position holding and take profit:
- First target level: 2389, reduce position by 30% to lock in profits;
- Second target level: 2436, reduce position by 30%;
- Third target level: 2490, exit completely.
Stop-loss setting: unconditional stop loss when breaking below 2270 by 1% (approximately 2247).
(2) Bearish trading strategy
Entry conditions:
- Price effectively breaks below 2270 and meets:
- 1-2 hour level candlesticks show 2 consecutive bearish candles with closing prices below 2270;
- Volume expands to more than 1.5 times the recent average, confirming bearish dominance.
- Technical indicators: MACD shows a death cross above the zero axis, RSI drops below the 50 level.
Position holding and take profit:
- First target level: 2203, reduce position by 30% after reaching;
- Second target level: 2156, reduce position by 30%;
- Third target level: 2112, exit completely.
Stop-loss setting: decisively stop loss when breaking above 2270 by 1% (approximately 2293).
(3) Flat watching strategy
1. Sideways oscillation period: Price fluctuates in the range of 2270-2389, and no clear breakout signals have appeared (such as three consecutive candlesticks closing beyond the range boundaries), maintain a flat position.
2. Major event periods: during the 24 hours before and after significant events such as the Federal Reserve's rate decision or Ethereum hard forks, halt trading due to extremely high market uncertainty.
3. Indicator conflict period: when technical indicators show conflicting signals (such as moving averages in a bullish arrangement but MACD showing a death cross), do not participate in trading.
3. Risk control and dynamic adjustment
1. Position management: single trade position should not exceed 20% of total funds to avoid excessive losses due to market fluctuations.
2. Dynamic tracking: review key level gains and losses after daily close; if the price reaches stop-profit/stop-loss levels, strictly execute the plan without hesitation.
3. Macroeconomic considerations: pay attention to Bitcoin trends, performance of US tech stocks, and other related market dynamics; if they conflict with technical signals, prioritize macro trends.
4. Summary
Ethereum is currently at a critical point of sideways consolidation, with 2270 and 2389 being the core levels that determine the short-term trend. Investors need to strictly execute scenario-based trading strategies: seize bullish opportunities when the price stabilizes at support levels, and layout shorts when it effectively breaks down; maintain a flat position during sideways movements or major risk periods. At the same time, build a complete risk defense through position control, stop-loss settings, and dynamic tracking to achieve stable trading in the high-volatility crypto market.$ETH #ETH走势分析