1. Core Point Analysis
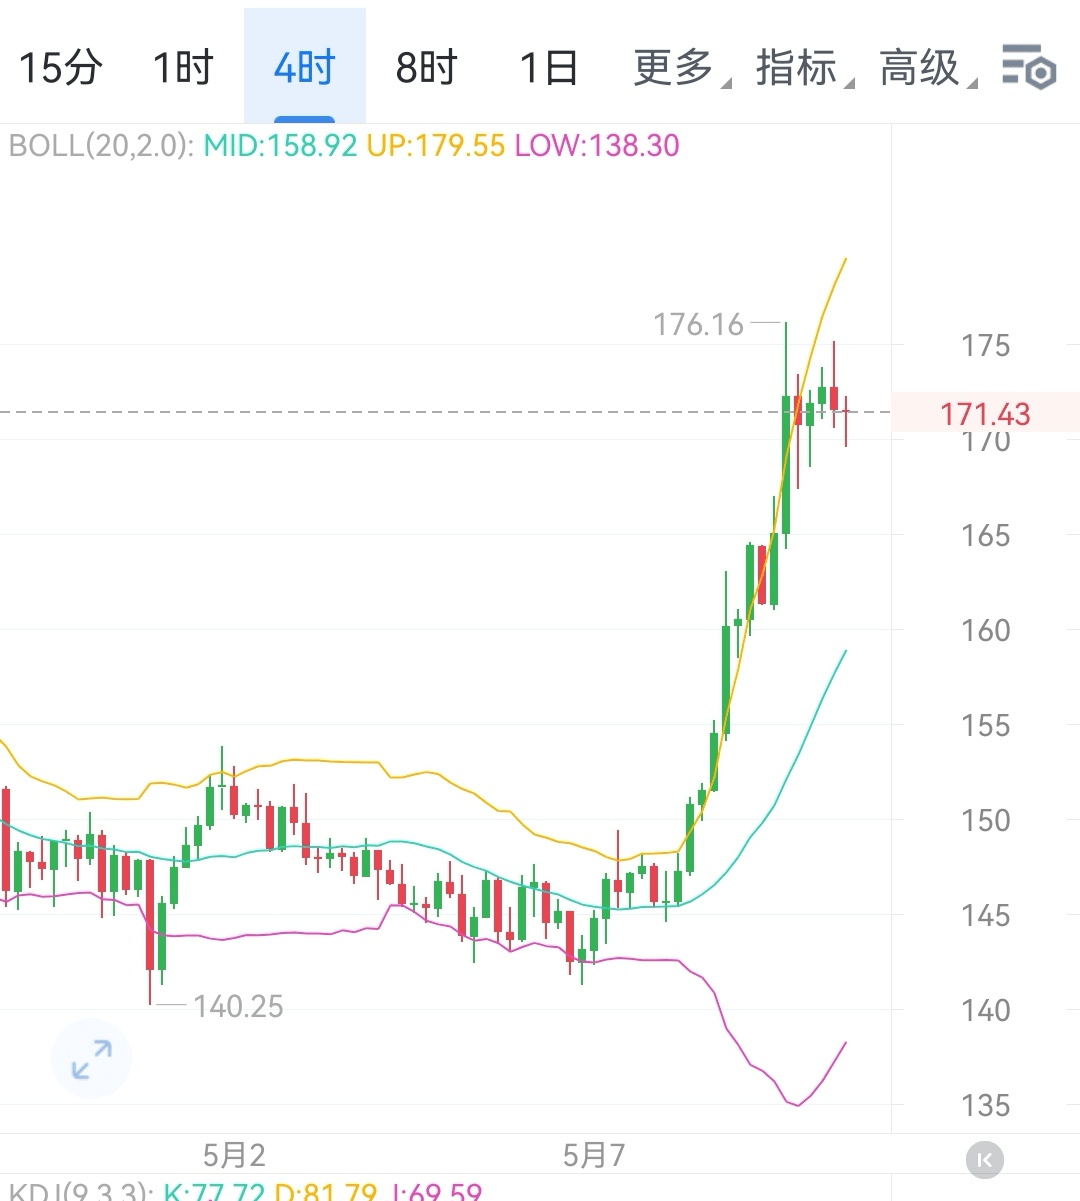
1. Trend Turning Point: 171.5 is the core point for judging short-term trends. If the price can effectively stabilize above this level, it means that the minor pullback has ended, and bulls are expected to regain upward momentum; conversely, if it continues to be pressured below 171.5, it indicates that the 1 - 2 hour level adjustment will continue.
2. Upper Resistance Level
- First checkpoint: 176, as an important resistance for recent rebounds; if the price breaks above 171.5, it will first face the test of this level.
- Secondary Resistance: Pay attention to 180.4 and 186.8 in sequence; these levels have repeatedly formed strong resistance in historical trends, and if they can be gradually broken, it will open up greater upward space.
3. Lower Support Level: If the price cannot stabilize above 171.5 and continues to decline, 167.5, 164.3, and 161.3 will successively become key support levels. These points are important support nodes from previous price fluctuations and may trigger concentrated buying.
2. Scenario-based Trading Strategy
(1) Long Entry Strategy
Entry Condition:
- Price effectively stands above 171.5 and meets the following signals:
- 1 - 2 hour level K-line closes above 171.5 for two consecutive candles, forming an effective breakout confirmation;
- Trading volume significantly increases with the breakout, exceeding 30% compared to the previous trading day, indicating continued capital inflow;
- In terms of technical indicators, MACD forms a golden cross above the zero axis, and the RSI indicator breaks above 50.
Position and Take Profit:
- First target: 176, after reaching this point, reduce position by 30% to lock in profits;
- Second target: 180.4, reduce position again by 30%;
- Third target: 186.8, exit all remaining positions.
Stop Loss Setting: If the price falls below 171.5 by 1% (approximately 169.8), decisively stop loss and exit to prevent false breakout risks.
(2) Short Entry Strategy
Entry Condition:
- Price continues to be pressured below 171.5 and shows the following signals:
- 1 - 2 hour level K-line forms a clear bearish pattern (e.g., Evening Star, Dark Cloud Cover);
- Trading volume increases during the decline, indicating that bearish strength dominates;
- MACD forms a death cross below the zero axis, and the RSI indicator falls below 50.
Position and Take Profit:
- First target: 167.5, reduce position by 30% after reaching this point;
- Second target: 164.3, reduce position again by 30%;
- Third target: 161.3, close all remaining positions.
Stop Loss Setting: If the price breaks above 171.5 by 1% (approximately 173.2), immediately stop loss to avoid losses from trend reversals.
(3) Stay Flat and Observe Strategy
1. Range Consolidation Period: When the price fluctuates within the range of 167.5 - 171.5 without clear breakout signals, it is recommended to maintain a flat position and wait for the trend to clarify.
2. Major Event Period: During the 24 hours before and after the project party releases important announcements or industry policy changes, trading is suspended due to increased market uncertainty.
3. Indicator Conflict Period: If technical indicators show contradictions (e.g., moving averages are bullish but KDJ is overbought), do not participate in operations to avoid blind trading.
3. Risk Control and Dynamic Management
1. Position Management: The position for a single trade should not exceed 20% of total capital, diversifying investments to reduce risk.
2. Dynamic Tracking: Monitor key levels in real time, and if the price hits take profit or stop loss levels, strictly execute the trading plan to eliminate any sense of luck.
3. Macroeconomic Linkage: Pay attention to the trends of mainstream cryptocurrencies such as Bitcoin and Ethereum, as well as the performance of US tech stocks. If there are significant changes in related markets, promptly adjust trading strategies.
4. Summary
Solana is currently at a key turning point in the short-term trend, with 171.5 becoming the core focus of bulls and bears. Investors need to closely monitor the breakout situation of this level, strictly execute trading according to long and short entry conditions, and maintain a flat position when the trend is unclear or risks escalate. By implementing scientific position control, stop loss settings, and dynamic strategy adjustments, opportunities can be seized and risks avoided in the volatile cryptocurrency market.$SOL #SOL走势