

Bitcoin experienced a sharp decline followed by a slight rebound, currently trading below $90,000, with clear short-term resistance. However, the price has not yet fallen below $85,000, and there is significant attention on whether it can break through here at $84,216.
Macroeconomics and Policy:
Stagflation risk intensifies
Consumer confidence collapses: The U.S. Consumer Confidence Index has dropped to 98.3 (the largest drop in three and a half years), reflecting deep concerns about the economic outlook, compounded by inflation expectations soaring to 6% (the highest since May 2023).
Policy and Employment Shock: Trump's tariff policy and large-scale layoffs by the federal government have triggered risks of consumption tightening, which could drag down economic growth, creating a 'high inflation + low growth' stagflation environment.
Safe-haven assets rise alone: Government bonds have become the only asset to rise as funds flee risk assets (U.S. stocks, Bitcoin, gold), with the market entering a full-risk-off mode.
Historical Similarity Warning
The current market is highly similar to the panic mode on August 5, 2024 (indiscriminate asset sell-off), but the macro backdrop is more complicated (stagflation expectations + policy uncertainty).
The on-chain losses realized for Bitcoin are second only to the historic sell-off when it was at $49,000, indicating retail panic has reached extreme levels, but bottom signals need confirmation through sustained buying from large whales.
Key March Events: PCE inflation data (this Friday), Non-farm employment (early March), CPI (mid-March), Federal Reserve interest rate decision and dot plot (late March).
Policy Uncertainty: If Trump's tariff policy is substantially advanced, it may trigger escalating trade frictions, impacting corporate profit expectations.
On-chain data trends:
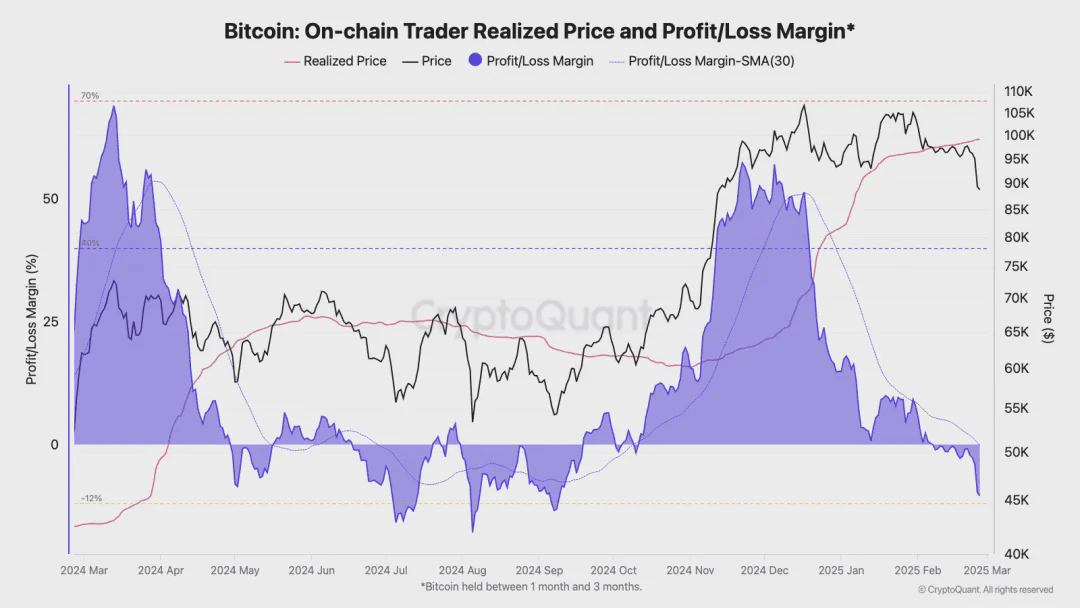
The average cost for short-term holders is $98,000 (a drop of about 12%), with historical pullbacks typically ranging from 12% to 20%, attention needs to be paid to the support in the $85,000 area.

More than 100 retail investors are withdrawing in large numbers, while addresses holding more than 100 begin to see inflows.
ETF Funds:
Short-term liquidity tightening (ETF outflows), with a net outflow of $937 million in a single day (the highest in history), mainly due to hedge funds exiting for arbitrage, while long-term funds have not yet withdrawn on a large scale.
Trading Opportunities:
Keep a close eye on large on-chain transactions and ETF fund flows, gradually positioning below $85,000. There is significant attention on whether it can break through here at $84,216. (The red bar section in the K-line chart above), focus on the $85,000-$90,800 range in the short term. If there is sustained buying from large whales or a structural shift at a smaller level, entry can be considered gradually; long-term holders need not overly worry about pullbacks.
This article contains financial investment advice for reference only; it is recommended to consult a professional financial advisor.