

Smart6340
121 Posts

Smart6340
Report
Block User
buyer || seller|| token recovery||
Open Trade
Frequent Trader
3.8 Years
37 Following
2 Followers
42 Liked
Posts
Portfolio
·
--

Article
🚀Google’s Project Suncatcher: AI Data Centers Could Move Into SpaceGoogle is taking AI infrastructure to a new frontier: space. Under Project Suncatcher, $GOOGLB is exploring solar-powered satellites equipped with its AI-focused Tensor Processing Units (TPUs), potentially creating large-scale computing infrastructure in orbit.
Google has now announced its first in-orbit test, with a prototype satellite scheduled to launch aboard SpaceX’s upcoming Transporter-18 rideshare mission in partnership with Planet. The test will examine how Google’s AI hardware performs against radiation, extreme temperatures and launch conditions.
The idea is simple but ambitious: satellites can receive sunlight for much longer periods than solar panels on Earth, potentially providing abundant energy for AI computing while reducing pressure on terrestrial power grids.
If successful, Project Suncatcher could open a completely new chapter for AI data centers—where the cloud literally operates above Earth.
#AI #Google #ProjectSuncatcher #Tech #Space #ArtificialIntelligence #DataCenters #INNOVATION #BinanceWillListHyperliquid(HYPE) #FedOctoberRateHikeOddsRiseTo69.7%
🚀Google’s Project Suncatcher: AI Data Centers Could Move Into Space
Google is taking AI infrastructure to a new frontier: space. Under Project Suncatcher, $GOOGLB is exploring solar-powered satellites equipped with its AI-focused Tensor Processing Units (TPUs), potentially creating large-scale computing infrastructure in orbit.
Google has now announced its first in-orbit test, with a prototype satellite scheduled to launch aboard SpaceX’s upcoming Transporter-18 rideshare mission in partnership with Planet. The test will examine how Google’s AI hardware performs against radiation, extreme temperatures and launch conditions.
The idea is simple but ambitious: satellites can receive sunlight for much longer periods than solar panels on Earth, potentially providing abundant energy for AI computing while reducing pressure on terrestrial power grids.
If successful, Project Suncatcher could open a completely new chapter for AI data centers—where the cloud literally operates above Earth.
#AI #Google #ProjectSuncatcher #Tech #Space #ArtificialIntelligence #DataCenters #INNOVATION #BinanceWillListHyperliquid(HYPE) #FedOctoberRateHikeOddsRiseTo69.7%
Google has now announced its first in-orbit test, with a prototype satellite scheduled to launch aboard SpaceX’s upcoming Transporter-18 rideshare mission in partnership with Planet. The test will examine how Google’s AI hardware performs against radiation, extreme temperatures and launch conditions.
The idea is simple but ambitious: satellites can receive sunlight for much longer periods than solar panels on Earth, potentially providing abundant energy for AI computing while reducing pressure on terrestrial power grids.
If successful, Project Suncatcher could open a completely new chapter for AI data centers—where the cloud literally operates above Earth.
#AI #Google #ProjectSuncatcher #Tech #Space #ArtificialIntelligence #DataCenters #INNOVATION #BinanceWillListHyperliquid(HYPE) #FedOctoberRateHikeOddsRiseTo69.7%
1
106
·
--
Bitcoin Under Pressure as 30-Year Treasury Yield Hits 2004 HighWall Street is watching the bond market again and crypto traders have a reason to pay attention. The U.S. 30-year Treasury yield climbed to 5.44% on September 24, its highest level since 2004, as inflation concerns, elevated energy prices, strong economic activity and heavy government borrowing pushed investors to demand higher long-term returns.
Why This Matters for Crypto
Higher Treasury yields can tighten financial conditions because investors can earn more from relatively lower-risk government debt. That can reduce appetite for riskier assets such as Bitcoin and altcoins.
The pressure is already visible in crypto markets. Bitcoin slipped below $84,000 on September 24, while reports linked the move to rising Treasury yields, stronger economic data and weaker risk appetite.
Meanwhile, the U.S. 10-year Treasury yield also moved above 5%, adding to concerns that borrowing costs could remain elevated for longer.
🔥 The Bigger Macro Picture:
The bond selloff is not being driven by one factor alone. Recent market reports point to a combination of:
📈 Rising inflation expectations:
Higher energy prices are adding fresh inflation pressure.
🏦 Higher government:
Investors are demanding greater compensation to hold long-duration U.S. debt.
⚡ Strong economic activity
Stronger-than-expected business data has reduced expectations for rapid monetary easing.
💰 Higher-for-longer rate risk
Markets have increased bets that further Federal Reserve tightening could be possible.
What Could It Mean for $BTC ?
Bitcoin's recent strength showed that crypto can sometimes absorb macro pressure. It had climbed above $86,000 earlier this week before reversing as yields jumped.
That makes the next reaction especially important: will BTC stabilize despite higher yields, or will tighter financial conditions continue to pressure crypto?
For traders, 30-year Treasury yields, the 10-year yield, oil prices and Fed expectations are becoming key macro signals to watch alongside Bitcoin price action.
🗳️ Binance Square Poll
30Y Treasury yield hits a 2004 high what does it mean for crypto?
🔘 Risk-off pressure is coming
🔘 BTC can decouple from rates
🔘 More volatility ahead
🔘 This could become a buying opportunity
#Bitcoin #BTC #Crypto #CryptoNews #TreasuryYield #FederalReserve #Inflation #CryptoMarket #BitcoinPrice #Macro #BinanceSqure
Bitcoin Under Pressure as 30-Year Treasury Yield Hits 2004 High
Wall Street is watching the bond market again and crypto traders have a reason to pay attention. The U.S. 30-year Treasury yield climbed to 5.44% on September 24, its highest level since 2004, as inflation concerns, elevated energy prices, strong economic activity and heavy government borrowing pushed investors to demand higher long-term returns.
Why This Matters for Crypto
Higher Treasury yields can tighten financial conditions because investors can earn more from relatively lower-risk government debt. That can reduce appetite for riskier assets such as Bitcoin and altcoins.
The pressure is already visible in crypto markets. Bitcoin slipped below $84,000 on September 24, while reports linked the move to rising Treasury yields, stronger economic data and weaker risk appetite.
Meanwhile, the U.S. 10-year Treasury yield also moved above 5%, adding to concerns that borrowing costs could remain elevated for longer.
🔥 The Bigger Macro Picture:
The bond selloff is not being driven by one factor alone. Recent market reports point to a combination of:
📈 Rising inflation expectations:
Higher energy prices are adding fresh inflation pressure.
🏦 Higher government:
Investors are demanding greater compensation to hold long-duration U.S. debt.
⚡ Strong economic activity
Stronger-than-expected business data has reduced expectations for rapid monetary easing.
💰 Higher-for-longer rate risk
Markets have increased bets that further Federal Reserve tightening could be possible.
What Could It Mean for $BTC ?
Bitcoin's recent strength showed that crypto can sometimes absorb macro pressure. It had climbed above $86,000 earlier this week before reversing as yields jumped.
That makes the next reaction especially important: will BTC stabilize despite higher yields, or will tighter financial conditions continue to pressure crypto?
For traders, 30-year Treasury yields, the 10-year yield, oil prices and Fed expectations are becoming key macro signals to watch alongside Bitcoin price action.
🗳️ Binance Square Poll
30Y Treasury yield hits a 2004 high what does it mean for crypto?
🔘 Risk-off pressure is coming
🔘 BTC can decouple from rates
🔘 More volatility ahead
🔘 This could become a buying opportunity
#Bitcoin #BTC #Crypto #CryptoNews #TreasuryYield #FederalReserve #Inflation #CryptoMarket #BitcoinPrice #Macro #BinanceSqure
Why This Matters for Crypto
Higher Treasury yields can tighten financial conditions because investors can earn more from relatively lower-risk government debt. That can reduce appetite for riskier assets such as Bitcoin and altcoins.
The pressure is already visible in crypto markets. Bitcoin slipped below $84,000 on September 24, while reports linked the move to rising Treasury yields, stronger economic data and weaker risk appetite.
Meanwhile, the U.S. 10-year Treasury yield also moved above 5%, adding to concerns that borrowing costs could remain elevated for longer.
🔥 The Bigger Macro Picture:
The bond selloff is not being driven by one factor alone. Recent market reports point to a combination of:
📈 Rising inflation expectations:
Higher energy prices are adding fresh inflation pressure.
🏦 Higher government:
Investors are demanding greater compensation to hold long-duration U.S. debt.
⚡ Strong economic activity
Stronger-than-expected business data has reduced expectations for rapid monetary easing.
💰 Higher-for-longer rate risk
Markets have increased bets that further Federal Reserve tightening could be possible.
What Could It Mean for $BTC ?
Bitcoin's recent strength showed that crypto can sometimes absorb macro pressure. It had climbed above $86,000 earlier this week before reversing as yields jumped.
That makes the next reaction especially important: will BTC stabilize despite higher yields, or will tighter financial conditions continue to pressure crypto?
For traders, 30-year Treasury yields, the 10-year yield, oil prices and Fed expectations are becoming key macro signals to watch alongside Bitcoin price action.
🗳️ Binance Square Poll
30Y Treasury yield hits a 2004 high what does it mean for crypto?
🔘 Risk-off pressure is coming
🔘 BTC can decouple from rates
🔘 More volatility ahead
🔘 This could become a buying opportunity
#Bitcoin #BTC #Crypto #CryptoNews #TreasuryYield #FederalReserve #Inflation #CryptoMarket #BitcoinPrice #Macro #BinanceSqure
96
·
--
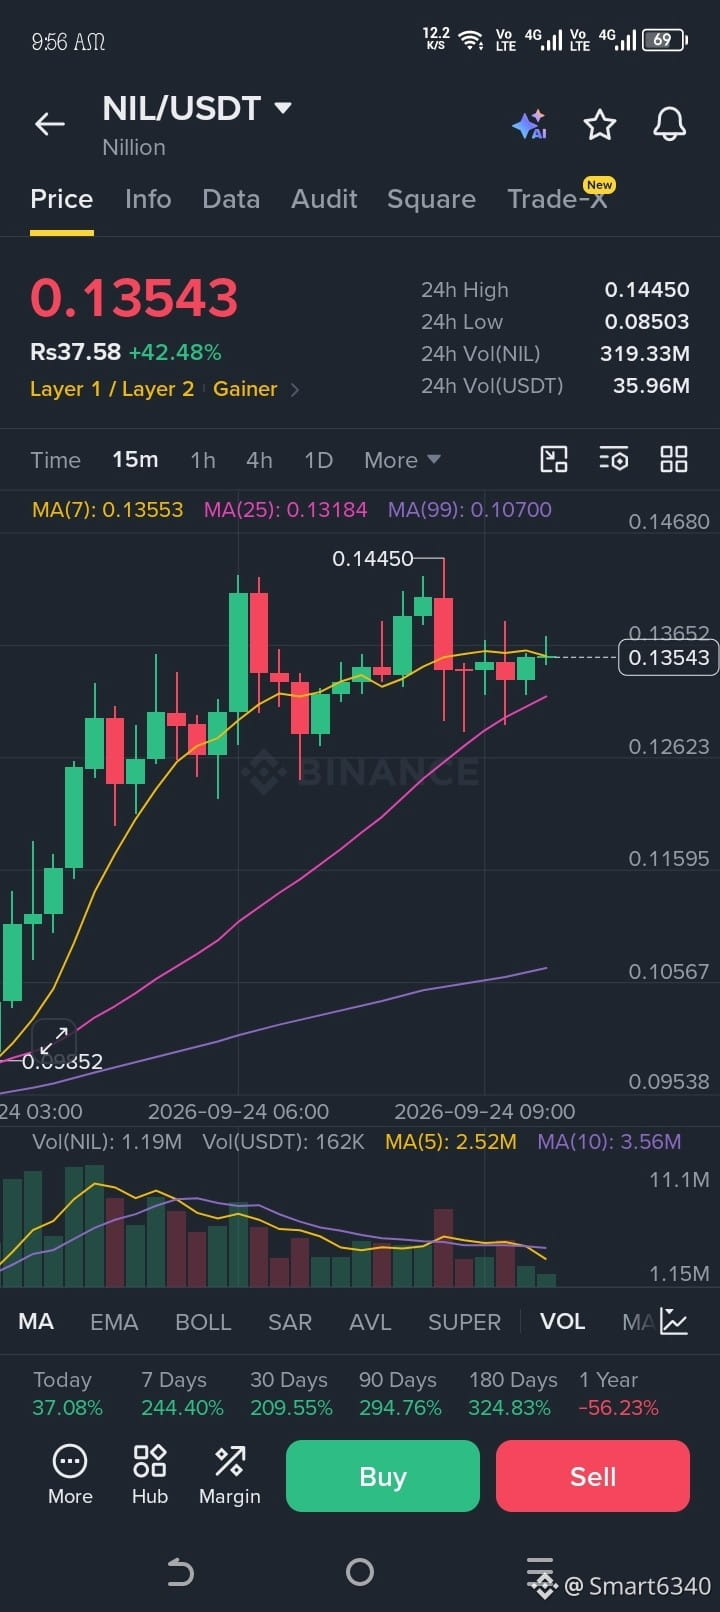
#USWeighsPromotingDollarStablecoinsAbroad $NIL what u think about this bullish where is stop..!!
#USWeighsPromotingDollarStablecoinsAbroad $NIL what u think about this bullish where is stop..!!
1
218
·
--
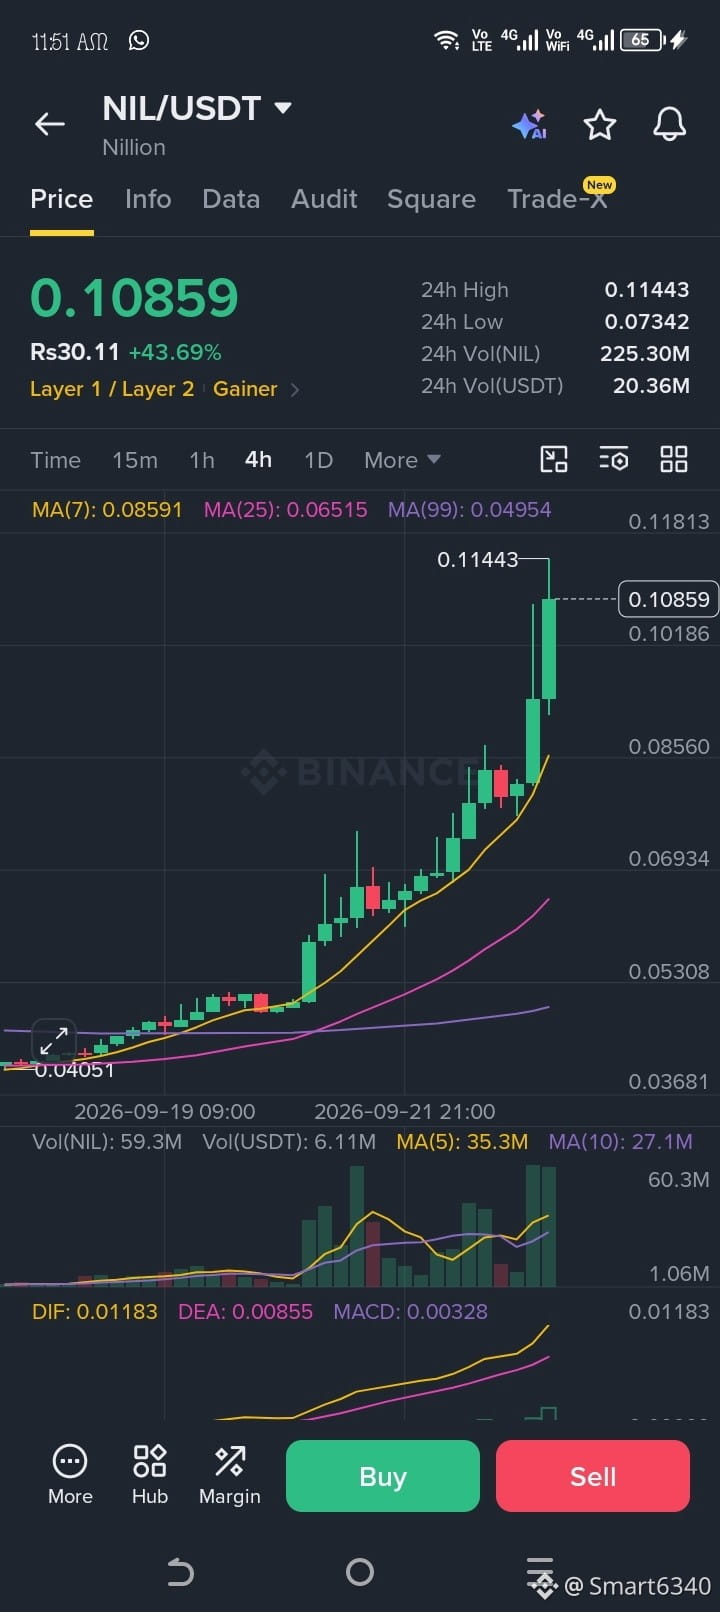
$NIL what u think it's going more crazy 🤣 give me suggestions in comment's
$NIL what u think it's going more crazy 🤣 give me suggestions in comment's
148
·
--
Article
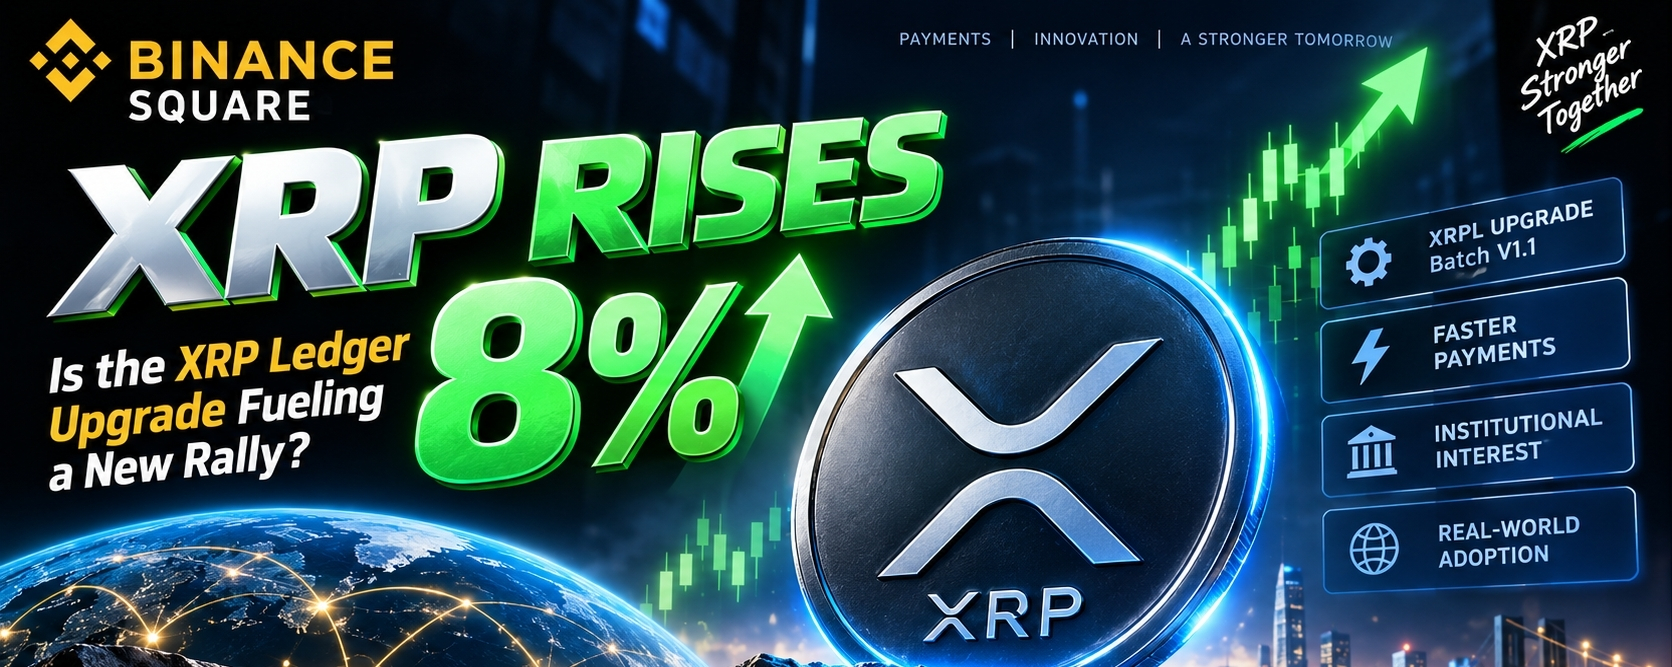
🚨XRP Surges 8%: Is the XRP Ledger Upgrade Fueling a New Rally?XRP is suddenly back in the spotlight. The token jumped around 8% as traders reacted to growing attention around a major XRP Ledger (XRPL) payments upgrade and potential institutional and commercial use cases.
But the real story may not be the 8% price move itself . it’s what could be coming next for the $XRP Ledger.
🔥 The Catalyst Behind XRP’s 8% Move:
According to Binance News, Ripple said asset managers and commercial projects are preparing to use Batch V1.1, a payments-related upgrade for the XRP Ledger. The upgrade currently has support from 30 of 35 tracked validators and is projected to activate after September 29, provided support remains above the required threshold.
That development has created fresh discussion around XRP's role in faster and more efficient blockchain-based payments.
⚡ Why Batch V1.1 Matters:
Batch V1.1 is designed to bundle multiple transactions into a single operation. According to reporting on the upgrade, it can bundle up to eight transactions, with linked transactions designed to settle together or fail together.
This type of functionality could support more sophisticated financial applications, including delivery-versus-payment use cases.
For $XRP watchers, the important question is whether improved XRPL functionality can translate into greater real-world network activity.
🏦 Institutional Interest Is Now in Focus
The latest move has also shifted attention toward potential institutional adoption.
If asset managers and commercial projects actually begin using the upgraded XRPL infrastructure, traders could have a new fundamental narrative to follow beyond short-term market momentum.
However, preparation to use an upgrade does not guarantee future XRP demand or a sustained price increase. Adoption still needs to materialize.
📊 $XRP Price Levels Traders Are Watching
Following the recent rally, Binance News reported that traders were watching $1.50 and $1.80 as important XRP price areas.
These levels are worth monitoring because XRP's next move will depend on whether buying pressure continues or the recent rally begins to cool.
After an 8% move, volatility can remain elevated — meaning traders may see both sharp continuation and sudden pullbacks.
🚀 XRP’s Next Big Test:
The upcoming XRPL upgrade gives the XRP narrative another major event to watch.
Price momentum + XRPL development + potential institutional use = a combination that traders are closely monitoring.
The key question now is simple:
Can XRP turn an 8% breakout into a sustained move, or will traders take profits after the initial surge?
For now, the #XRPRises8% conversation is gaining attention on Binance Square, while the September 29 upgrade timeline gives the market another date to watch.
Final Takeaway:
XRP's latest 8% rise is more than a price headline. The market is increasingly focused on the XRP Ledger Batch V1.1 upgrade, validator support and potential institutional/commercial applications.
If the upgrade activates successfully and real-world usage follows, the XRP story could increasingly shift from pure price speculation toward payments infrastructure and network utility.
The next chapter for XRP may be about what the ledger can actually do not just how high the token can go.
#XRP #XRPRises8 #Ripple #XRPUSD #XRPL #XRPNews #CryptoNews #BinanceSquare #Crypto #Blockchain #XRPRises8% #Payments #RippleX
🚨XRP Surges 8%: Is the XRP Ledger Upgrade Fueling a New Rally?
XRP is suddenly back in the spotlight. The token jumped around 8% as traders reacted to growing attention around a major XRP Ledger (XRPL) payments upgrade and potential institutional and commercial use cases.
But the real story may not be the 8% price move itself . it’s what could be coming next for the $XRP Ledger.
🔥 The Catalyst Behind XRP’s 8% Move:
According to Binance News, Ripple said asset managers and commercial projects are preparing to use Batch V1.1, a payments-related upgrade for the XRP Ledger. The upgrade currently has support from 30 of 35 tracked validators and is projected to activate after September 29, provided support remains above the required threshold.
That development has created fresh discussion around XRP's role in faster and more efficient blockchain-based payments.
⚡ Why Batch V1.1 Matters:
Batch V1.1 is designed to bundle multiple transactions into a single operation. According to reporting on the upgrade, it can bundle up to eight transactions, with linked transactions designed to settle together or fail together.
This type of functionality could support more sophisticated financial applications, including delivery-versus-payment use cases.
For $XRP watchers, the important question is whether improved XRPL functionality can translate into greater real-world network activity.
🏦 Institutional Interest Is Now in Focus
The latest move has also shifted attention toward potential institutional adoption.
If asset managers and commercial projects actually begin using the upgraded XRPL infrastructure, traders could have a new fundamental narrative to follow beyond short-term market momentum.
However, preparation to use an upgrade does not guarantee future XRP demand or a sustained price increase. Adoption still needs to materialize.
📊 $XRP Price Levels Traders Are Watching
Following the recent rally, Binance News reported that traders were watching $1.50 and $1.80 as important XRP price areas.
These levels are worth monitoring because XRP's next move will depend on whether buying pressure continues or the recent rally begins to cool.
After an 8% move, volatility can remain elevated — meaning traders may see both sharp continuation and sudden pullbacks.
🚀 XRP’s Next Big Test:
The upcoming XRPL upgrade gives the XRP narrative another major event to watch.
Price momentum + XRPL development + potential institutional use = a combination that traders are closely monitoring.
The key question now is simple:
Can XRP turn an 8% breakout into a sustained move, or will traders take profits after the initial surge?
For now, the #XRPRises8% conversation is gaining attention on Binance Square, while the September 29 upgrade timeline gives the market another date to watch.
Final Takeaway:
XRP's latest 8% rise is more than a price headline. The market is increasingly focused on the XRP Ledger Batch V1.1 upgrade, validator support and potential institutional/commercial applications.
If the upgrade activates successfully and real-world usage follows, the XRP story could increasingly shift from pure price speculation toward payments infrastructure and network utility.
The next chapter for XRP may be about what the ledger can actually do not just how high the token can go.
#XRP #XRPRises8 #Ripple #XRPUSD #XRPL #XRPNews #CryptoNews #BinanceSquare #Crypto #Blockchain #XRPRises8% #Payments #RippleX
But the real story may not be the 8% price move itself . it’s what could be coming next for the $XRP Ledger.
🔥 The Catalyst Behind XRP’s 8% Move:
According to Binance News, Ripple said asset managers and commercial projects are preparing to use Batch V1.1, a payments-related upgrade for the XRP Ledger. The upgrade currently has support from 30 of 35 tracked validators and is projected to activate after September 29, provided support remains above the required threshold.
That development has created fresh discussion around XRP's role in faster and more efficient blockchain-based payments.
⚡ Why Batch V1.1 Matters:
Batch V1.1 is designed to bundle multiple transactions into a single operation. According to reporting on the upgrade, it can bundle up to eight transactions, with linked transactions designed to settle together or fail together.
This type of functionality could support more sophisticated financial applications, including delivery-versus-payment use cases.
For $XRP watchers, the important question is whether improved XRPL functionality can translate into greater real-world network activity.
🏦 Institutional Interest Is Now in Focus
The latest move has also shifted attention toward potential institutional adoption.
If asset managers and commercial projects actually begin using the upgraded XRPL infrastructure, traders could have a new fundamental narrative to follow beyond short-term market momentum.
However, preparation to use an upgrade does not guarantee future XRP demand or a sustained price increase. Adoption still needs to materialize.
📊 $XRP Price Levels Traders Are Watching
Following the recent rally, Binance News reported that traders were watching $1.50 and $1.80 as important XRP price areas.
These levels are worth monitoring because XRP's next move will depend on whether buying pressure continues or the recent rally begins to cool.
After an 8% move, volatility can remain elevated — meaning traders may see both sharp continuation and sudden pullbacks.
🚀 XRP’s Next Big Test:
The upcoming XRPL upgrade gives the XRP narrative another major event to watch.
Price momentum + XRPL development + potential institutional use = a combination that traders are closely monitoring.
The key question now is simple:
Can XRP turn an 8% breakout into a sustained move, or will traders take profits after the initial surge?
For now, the #XRPRises8% conversation is gaining attention on Binance Square, while the September 29 upgrade timeline gives the market another date to watch.
Final Takeaway:
XRP's latest 8% rise is more than a price headline. The market is increasingly focused on the XRP Ledger Batch V1.1 upgrade, validator support and potential institutional/commercial applications.
If the upgrade activates successfully and real-world usage follows, the XRP story could increasingly shift from pure price speculation toward payments infrastructure and network utility.
The next chapter for XRP may be about what the ledger can actually do not just how high the token can go.
#XRP #XRPRises8 #Ripple #XRPUSD #XRPL #XRPNews #CryptoNews #BinanceSquare #Crypto #Blockchain #XRPRises8% #Payments #RippleX
1
203
·
--
Article
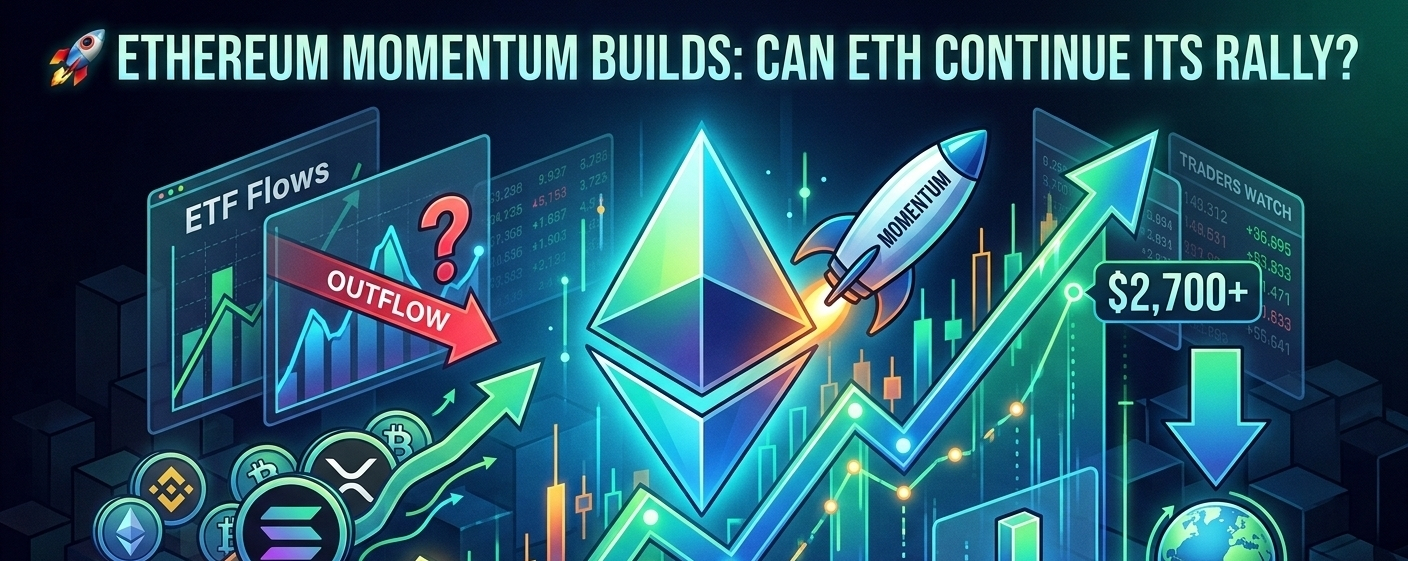
Ethereum Momentum Builds: Can ETH Continue Its Rally? 🔥 Ethereum is waking up and the next move could be bigger than traders expect. As Bitcoin pushes higher, ETH is gaining momentum and reclaiming key levels. But with Ethereum ETF flows and macro conditions still in focus, can ETH turn this momentum into a sustained rally?
Ethereum (ETH) is moving higher alongside but the real question is whether this momentum can last.
The crypto market is heating up again. Bitcoin pushed above $85,000, while Ethereum reclaimed the $2,700 area, showing that the current rally is spreading beyond $BTC and into major altcoins.
🔥 $ETH Reclaims $2,700
Ethereum has shown renewed strength after recent market volatility. On September 21, ETH climbed to around $2,700, with the broader crypto market also gaining momentum.
The move comes as traders monitor Bitcoin's breakout, macroeconomic conditions, and institutional crypto flows.
When Bitcoin rallies strongly, Ethereum often benefits from increased risk appetite across the digital-asset market.
📊 ETF Flows: The Key Signal to Watch
Ethereum's ETF picture is more complicated.
U.S. spot Ethereum ETFs recorded a net outflow of about $140 million for the week ending September 18, ending a four-week period of inflows totaling roughly $1.94 billion.
That means ETH's current price strength is occurring despite recently weaker ETF flows.
For traders, this creates an important question:
Can Ethereum maintain its rally if institutional ETF demand does not immediately return?
🌍 Macro Markets Could Drive the Next Move
Ethereum remains highly sensitive to the broader risk environment.
Interest rates, Treasury yields, liquidity conditions and investor appetite for risk assets can all influence crypto prices. At the same time, Bitcoin's move above $85,000 has improved overall market sentiment.
If broader risk appetite remains strong, $ETH could continue attracting attention from traders looking for opportunities beyond Bitcoin.
⚠️ Bulls Still Face Risks
Momentum does not guarantee a straight-line rally.
Recent ETF outflows show that institutional demand can change quickly. ETH also remains below its previous major highs, meaning traders may continue taking profits if momentum weakens.
A sustained move higher would require more than one strong trading session. Traders will likely watch ETF flows, Bitcoin's strength, trading volume and macroeconomic developments for confirmation.
👀 What Traders Are Watching Now
The next phase of Ethereum's move could depend on:
- ETH holding above the $2,700 area
- Renewed Ethereum ETF inflows
- Bitcoin maintaining its breakout
- Global liquidity and interest-rate expectations
- Trading volume and market-wide risk appetite
🚨 Bottom Line
Ethereum is showing fresh momentum as Bitcoin leads a broader crypto-market recovery. ETH's move toward and above $2,700 is attracting attention, but recent ETF outflows highlight an important contradiction: price momentum is improving while institutional flows have recently weakened.
The coming sessions could reveal whether Ethereum's latest move is the beginning of a larger recovery or simply another short-term crypto rally.
ETH traders are watching. The next move could be important.
#Ethereum #ETH #ETHPrice #EthereumETF #Crypto #CryptoNews #Bitcoin #BTC #Altcoins #BinanceSquare #CryptoTrading #EthereumRally #EthereumSurpasses$2700 #BitcoinHits$85K
Ethereum Momentum Builds: Can ETH Continue Its Rally?
🔥 Ethereum is waking up and the next move could be bigger than traders expect. As Bitcoin pushes higher, ETH is gaining momentum and reclaiming key levels. But with Ethereum ETF flows and macro conditions still in focus, can ETH turn this momentum into a sustained rally?
Ethereum (ETH) is moving higher alongside but the real question is whether this momentum can last.
The crypto market is heating up again. Bitcoin pushed above $85,000, while Ethereum reclaimed the $2,700 area, showing that the current rally is spreading beyond $BTC and into major altcoins.
🔥 $ETH Reclaims $2,700
Ethereum has shown renewed strength after recent market volatility. On September 21, ETH climbed to around $2,700, with the broader crypto market also gaining momentum.
The move comes as traders monitor Bitcoin's breakout, macroeconomic conditions, and institutional crypto flows.
When Bitcoin rallies strongly, Ethereum often benefits from increased risk appetite across the digital-asset market.
📊 ETF Flows: The Key Signal to Watch
Ethereum's ETF picture is more complicated.
U.S. spot Ethereum ETFs recorded a net outflow of about $140 million for the week ending September 18, ending a four-week period of inflows totaling roughly $1.94 billion.
That means ETH's current price strength is occurring despite recently weaker ETF flows.
For traders, this creates an important question:
Can Ethereum maintain its rally if institutional ETF demand does not immediately return?
🌍 Macro Markets Could Drive the Next Move
Ethereum remains highly sensitive to the broader risk environment.
Interest rates, Treasury yields, liquidity conditions and investor appetite for risk assets can all influence crypto prices. At the same time, Bitcoin's move above $85,000 has improved overall market sentiment.
If broader risk appetite remains strong, $ETH could continue attracting attention from traders looking for opportunities beyond Bitcoin.
⚠️ Bulls Still Face Risks
Momentum does not guarantee a straight-line rally.
Recent ETF outflows show that institutional demand can change quickly. ETH also remains below its previous major highs, meaning traders may continue taking profits if momentum weakens.
A sustained move higher would require more than one strong trading session. Traders will likely watch ETF flows, Bitcoin's strength, trading volume and macroeconomic developments for confirmation.
👀 What Traders Are Watching Now
The next phase of Ethereum's move could depend on:
- ETH holding above the $2,700 area
- Renewed Ethereum ETF inflows
- Bitcoin maintaining its breakout
- Global liquidity and interest-rate expectations
- Trading volume and market-wide risk appetite
🚨 Bottom Line
Ethereum is showing fresh momentum as Bitcoin leads a broader crypto-market recovery. ETH's move toward and above $2,700 is attracting attention, but recent ETF outflows highlight an important contradiction: price momentum is improving while institutional flows have recently weakened.
The coming sessions could reveal whether Ethereum's latest move is the beginning of a larger recovery or simply another short-term crypto rally.
ETH traders are watching. The next move could be important.
#Ethereum #ETH #ETHPrice #EthereumETF #Crypto #CryptoNews #Bitcoin #BTC #Altcoins #BinanceSquare #CryptoTrading #EthereumRally #EthereumSurpasses$2700 #BitcoinHits$85K
Ethereum (ETH) is moving higher alongside but the real question is whether this momentum can last.
The crypto market is heating up again. Bitcoin pushed above $85,000, while Ethereum reclaimed the $2,700 area, showing that the current rally is spreading beyond $BTC and into major altcoins.
🔥 $ETH Reclaims $2,700
Ethereum has shown renewed strength after recent market volatility. On September 21, ETH climbed to around $2,700, with the broader crypto market also gaining momentum.
The move comes as traders monitor Bitcoin's breakout, macroeconomic conditions, and institutional crypto flows.
When Bitcoin rallies strongly, Ethereum often benefits from increased risk appetite across the digital-asset market.
📊 ETF Flows: The Key Signal to Watch
Ethereum's ETF picture is more complicated.
U.S. spot Ethereum ETFs recorded a net outflow of about $140 million for the week ending September 18, ending a four-week period of inflows totaling roughly $1.94 billion.
That means ETH's current price strength is occurring despite recently weaker ETF flows.
For traders, this creates an important question:
Can Ethereum maintain its rally if institutional ETF demand does not immediately return?
🌍 Macro Markets Could Drive the Next Move
Ethereum remains highly sensitive to the broader risk environment.
Interest rates, Treasury yields, liquidity conditions and investor appetite for risk assets can all influence crypto prices. At the same time, Bitcoin's move above $85,000 has improved overall market sentiment.
If broader risk appetite remains strong, $ETH could continue attracting attention from traders looking for opportunities beyond Bitcoin.
⚠️ Bulls Still Face Risks
Momentum does not guarantee a straight-line rally.
Recent ETF outflows show that institutional demand can change quickly. ETH also remains below its previous major highs, meaning traders may continue taking profits if momentum weakens.
A sustained move higher would require more than one strong trading session. Traders will likely watch ETF flows, Bitcoin's strength, trading volume and macroeconomic developments for confirmation.
👀 What Traders Are Watching Now
The next phase of Ethereum's move could depend on:
- ETH holding above the $2,700 area
- Renewed Ethereum ETF inflows
- Bitcoin maintaining its breakout
- Global liquidity and interest-rate expectations
- Trading volume and market-wide risk appetite
🚨 Bottom Line
Ethereum is showing fresh momentum as Bitcoin leads a broader crypto-market recovery. ETH's move toward and above $2,700 is attracting attention, but recent ETF outflows highlight an important contradiction: price momentum is improving while institutional flows have recently weakened.
The coming sessions could reveal whether Ethereum's latest move is the beginning of a larger recovery or simply another short-term crypto rally.
ETH traders are watching. The next move could be important.
#Ethereum #ETH #ETHPrice #EthereumETF #Crypto #CryptoNews #Bitcoin #BTC #Altcoins #BinanceSquare #CryptoTrading #EthereumRally #EthereumSurpasses$2700 #BitcoinHits$85K
96
·
--
Article
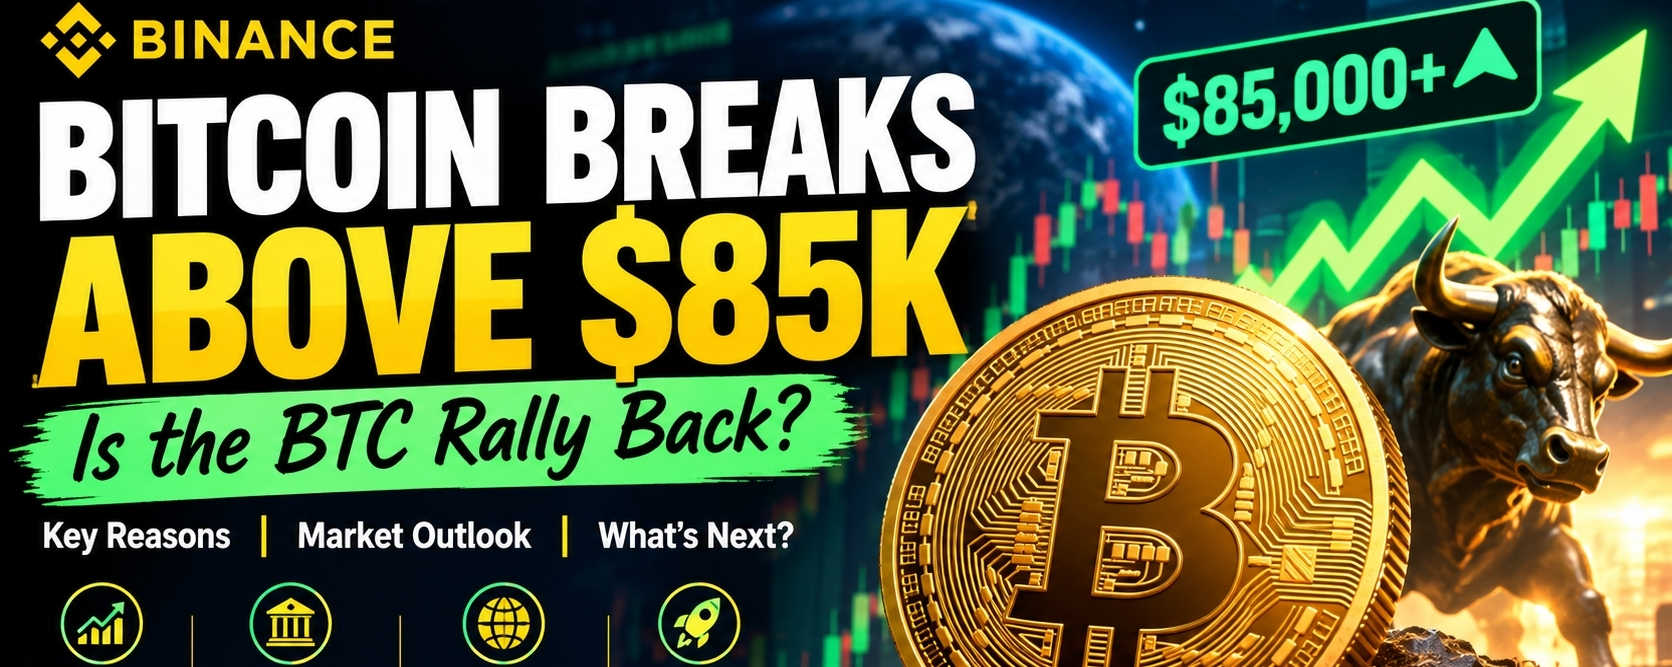
🚨Bitcoin Breaks Above $85K: Is the BTC Rally Back? Bitcoin just sent a message the market couldn't ignore. 🚀 $BTC has smashed through $85,000 — but the real story isn't the number itself. The real question is whether this breakout marks the beginning of Bitcoin's next major rally.
After weeks of volatility and pressure around the $75K–$80K zone, Bitcoin has suddenly shifted the mood from fear to optimism. Short sellers are being squeezed, ETF demand is returning, and traders are watching closely to see whether BTC can turn $85K from resistance into support.
Is this the start of the next Bitcoin leg higher or just another short-lived crypto pump? Let's break it down.
🚀 Bitcoin Reclaims $85K:
Bitcoin's move above $85K represents an important psychological and technical milestone. BTC had recently recovered from around $75,000 and pushed back above $80,000 before accelerating higher.
The breakout has brought fresh attention from traders because Bitcoin had struggled to sustain moves above the low-$80K area during previous attempts.
🔥 The Short Squeeze Adds Fuel:
One of the biggest forces behind the latest move is the liquidation of bearish leveraged positions.
When short sellers are forced to close losing trades, they effectively become buyers. That additional buying pressure can accelerate Bitcoin's upside momentum and create a powerful short squeeze.
But there is one major question:
Can Bitcoin keep climbing after the forced buying disappears?
🏦 ETF Demand Could Be the Bigger Story
Short squeezes can create fast moves, but sustained rallies usually need stronger underlying demand.
Bitcoin spot ETFs remain one of the most important indicators to watch. If ETF inflows continue, they could provide additional spot-market demand and potentially give BTC's recovery a stronger foundation.
This makes the next few trading sessions especially important.
📊 $85K Is Now the Key Battle Zone:
Bitcoin's breakout doesn't automatically guarantee another massive rally.
The market will now watch whether BTC can hold above the $85K area after the initial excitement fades.
If $85K becomes support, traders could start looking toward higher resistance zones.
If Bitcoin falls back below the breakout area, however, the move could turn into a classic breakout-and-retest scenario.
🌍 Macro Still Matters:
Bitcoin's next move won't depend on crypto alone.
Federal Reserve policy, interest-rate expectations, Treasury yields, global liquidity, the U.S. dollar and overall risk appetite can all influence BTC.
A more favorable macro environment could support risk assets, while renewed inflation or rate concerns could increase pressure on Bitcoin.
👀 What Traders Should Watch Now:
🔸 $85K
The most important psychological level after the breakout.
🔸 $82K–$83K
A potential area to watch if BTC performs a downside retest.
🔸 ETF Flows
Continued inflows could signal stronger spot demand.
🔸 Bitcoin Open Interest
High leverage can amplify both rallies and corrections.
🔸 Volume
A breakout supported by strong spot volume would provide more confirmation than a move driven mainly by derivatives.
🔮 Is the BTC Rally Really Back?
Bitcoin breaking above $85K has changed the short-term market narrative.
But one breakout does not prove that a new long-term bull phase has started.
The next major test is simple:
Can BTC stay above $85K after the short squeeze cools down?
If Bitcoin successfully converts the $85K area into support while ETF demand remains positive and market liquidity improves, traders may begin watching the next major resistance levels.
For now, $85K is the line in the sand.
Bitcoin has broken through it.
Now the market wants to know whether BTC can build on it. 🚀
Meta Description: Bitcoin breaks above $85K as bullish momentum returns. Explore the BTC breakout, ETF demand, short squeeze, key support levels and what comes next.
Secondary Keywords: Bitcoin price today, $BTC rally, Bitcoin $85K, BTC breakout, Bitcoin ETF,
URL Slug: "bitcoin-breaks-above-85k-btc-rally"
Hashtags:
#Bitcoin #BTC #BitcoinNews #BTCPrice #BitcoinHits$85K #BOJRaisesRatesTo31YearHigh #EthereumSurpasses$2700 #BitcoinRally #CryptoNews #CryptoMarket #BitcoinETF #BTCAnalysis #BinanceSquare
🚨Bitcoin Breaks Above $85K: Is the BTC Rally Back?
Bitcoin just sent a message the market couldn't ignore. 🚀 $BTC has smashed through $85,000 — but the real story isn't the number itself. The real question is whether this breakout marks the beginning of Bitcoin's next major rally.
After weeks of volatility and pressure around the $75K–$80K zone, Bitcoin has suddenly shifted the mood from fear to optimism. Short sellers are being squeezed, ETF demand is returning, and traders are watching closely to see whether BTC can turn $85K from resistance into support.
Is this the start of the next Bitcoin leg higher or just another short-lived crypto pump? Let's break it down.
🚀 Bitcoin Reclaims $85K:
Bitcoin's move above $85K represents an important psychological and technical milestone. BTC had recently recovered from around $75,000 and pushed back above $80,000 before accelerating higher.
The breakout has brought fresh attention from traders because Bitcoin had struggled to sustain moves above the low-$80K area during previous attempts.
🔥 The Short Squeeze Adds Fuel:
One of the biggest forces behind the latest move is the liquidation of bearish leveraged positions.
When short sellers are forced to close losing trades, they effectively become buyers. That additional buying pressure can accelerate Bitcoin's upside momentum and create a powerful short squeeze.
But there is one major question:
Can Bitcoin keep climbing after the forced buying disappears?
🏦 ETF Demand Could Be the Bigger Story
Short squeezes can create fast moves, but sustained rallies usually need stronger underlying demand.
Bitcoin spot ETFs remain one of the most important indicators to watch. If ETF inflows continue, they could provide additional spot-market demand and potentially give BTC's recovery a stronger foundation.
This makes the next few trading sessions especially important.
📊 $85K Is Now the Key Battle Zone:
Bitcoin's breakout doesn't automatically guarantee another massive rally.
The market will now watch whether BTC can hold above the $85K area after the initial excitement fades.
If $85K becomes support, traders could start looking toward higher resistance zones.
If Bitcoin falls back below the breakout area, however, the move could turn into a classic breakout-and-retest scenario.
🌍 Macro Still Matters:
Bitcoin's next move won't depend on crypto alone.
Federal Reserve policy, interest-rate expectations, Treasury yields, global liquidity, the U.S. dollar and overall risk appetite can all influence BTC.
A more favorable macro environment could support risk assets, while renewed inflation or rate concerns could increase pressure on Bitcoin.
👀 What Traders Should Watch Now:
🔸 $85K
The most important psychological level after the breakout.
🔸 $82K–$83K
A potential area to watch if BTC performs a downside retest.
🔸 ETF Flows
Continued inflows could signal stronger spot demand.
🔸 Bitcoin Open Interest
High leverage can amplify both rallies and corrections.
🔸 Volume
A breakout supported by strong spot volume would provide more confirmation than a move driven mainly by derivatives.
🔮 Is the BTC Rally Really Back?
Bitcoin breaking above $85K has changed the short-term market narrative.
But one breakout does not prove that a new long-term bull phase has started.
The next major test is simple:
Can BTC stay above $85K after the short squeeze cools down?
If Bitcoin successfully converts the $85K area into support while ETF demand remains positive and market liquidity improves, traders may begin watching the next major resistance levels.
For now, $85K is the line in the sand.
Bitcoin has broken through it.
Now the market wants to know whether BTC can build on it. 🚀
Meta Description: Bitcoin breaks above $85K as bullish momentum returns. Explore the BTC breakout, ETF demand, short squeeze, key support levels and what comes next.
Secondary Keywords: Bitcoin price today, $BTC rally, Bitcoin $85K, BTC breakout, Bitcoin ETF,
URL Slug: "bitcoin-breaks-above-85k-btc-rally"
Hashtags:
#Bitcoin #BTC #BitcoinNews #BTCPrice #BitcoinHits$85K #BOJRaisesRatesTo31YearHigh #EthereumSurpasses$2700 #BitcoinRally #CryptoNews #CryptoMarket #BitcoinETF #BTCAnalysis #BinanceSquare
After weeks of volatility and pressure around the $75K–$80K zone, Bitcoin has suddenly shifted the mood from fear to optimism. Short sellers are being squeezed, ETF demand is returning, and traders are watching closely to see whether BTC can turn $85K from resistance into support.
Is this the start of the next Bitcoin leg higher or just another short-lived crypto pump? Let's break it down.
🚀 Bitcoin Reclaims $85K:
Bitcoin's move above $85K represents an important psychological and technical milestone. BTC had recently recovered from around $75,000 and pushed back above $80,000 before accelerating higher.
The breakout has brought fresh attention from traders because Bitcoin had struggled to sustain moves above the low-$80K area during previous attempts.
🔥 The Short Squeeze Adds Fuel:
One of the biggest forces behind the latest move is the liquidation of bearish leveraged positions.
When short sellers are forced to close losing trades, they effectively become buyers. That additional buying pressure can accelerate Bitcoin's upside momentum and create a powerful short squeeze.
But there is one major question:
Can Bitcoin keep climbing after the forced buying disappears?
🏦 ETF Demand Could Be the Bigger Story
Short squeezes can create fast moves, but sustained rallies usually need stronger underlying demand.
Bitcoin spot ETFs remain one of the most important indicators to watch. If ETF inflows continue, they could provide additional spot-market demand and potentially give BTC's recovery a stronger foundation.
This makes the next few trading sessions especially important.
📊 $85K Is Now the Key Battle Zone:
Bitcoin's breakout doesn't automatically guarantee another massive rally.
The market will now watch whether BTC can hold above the $85K area after the initial excitement fades.
If $85K becomes support, traders could start looking toward higher resistance zones.
If Bitcoin falls back below the breakout area, however, the move could turn into a classic breakout-and-retest scenario.
🌍 Macro Still Matters:
Bitcoin's next move won't depend on crypto alone.
Federal Reserve policy, interest-rate expectations, Treasury yields, global liquidity, the U.S. dollar and overall risk appetite can all influence BTC.
A more favorable macro environment could support risk assets, while renewed inflation or rate concerns could increase pressure on Bitcoin.
👀 What Traders Should Watch Now:
🔸 $85K
The most important psychological level after the breakout.
🔸 $82K–$83K
A potential area to watch if BTC performs a downside retest.
🔸 ETF Flows
Continued inflows could signal stronger spot demand.
🔸 Bitcoin Open Interest
High leverage can amplify both rallies and corrections.
🔸 Volume
A breakout supported by strong spot volume would provide more confirmation than a move driven mainly by derivatives.
🔮 Is the BTC Rally Really Back?
Bitcoin breaking above $85K has changed the short-term market narrative.
But one breakout does not prove that a new long-term bull phase has started.
The next major test is simple:
Can BTC stay above $85K after the short squeeze cools down?
If Bitcoin successfully converts the $85K area into support while ETF demand remains positive and market liquidity improves, traders may begin watching the next major resistance levels.
For now, $85K is the line in the sand.
Bitcoin has broken through it.
Now the market wants to know whether BTC can build on it. 🚀
Meta Description: Bitcoin breaks above $85K as bullish momentum returns. Explore the BTC breakout, ETF demand, short squeeze, key support levels and what comes next.
Secondary Keywords: Bitcoin price today, $BTC rally, Bitcoin $85K, BTC breakout, Bitcoin ETF,
URL Slug: "bitcoin-breaks-above-85k-btc-rally"
Hashtags:
#Bitcoin #BTC #BitcoinNews #BTCPrice #BitcoinHits$85K #BOJRaisesRatesTo31YearHigh #EthereumSurpasses$2700 #BitcoinRally #CryptoNews #CryptoMarket #BitcoinETF #BTCAnalysis #BinanceSquare
117
·
--
Article
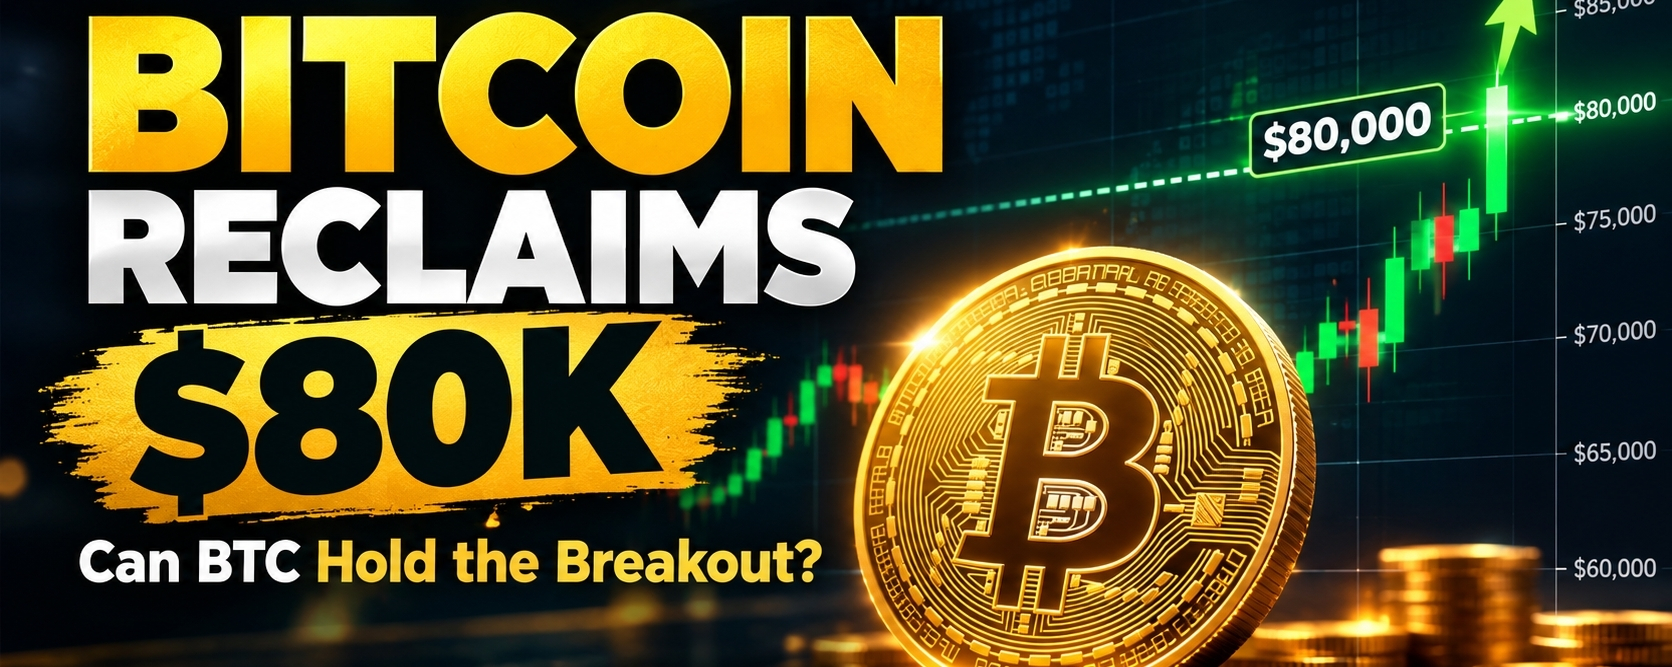
Bitcoin Reclaims $80K — Is $85K Next? 🚀Bitcoin is back above the $80,000 psychological level, putting the crypto market back into the spotlight.
The move above $80K comes after Btc recovered strongly from the mid-$70K area. Recent market reports also point to renewed ETF demand and significant short-position liquidations helping fuel the rebound.
🔥 The Key Question:
Can Bitcoin turn $80K from resistance into support?
The $81K–$82K area is now an important zone to watch. A sustained move above this region could keep traders focused on higher levels, while rejection could bring $80K and lower support areas back into focus.
📊 What Could Drive the Next Move?
• Bitcoin holding above $80K
• ETF inflows and institutional demand
• Interest-rate expectations
• Market liquidity
• Short-term profit-taking
Bitcoin's recovery is attracting fresh attention, but crypto remains highly volatile. A breakout alone does not guarantee that the move will continue.
The big question now:
🚀 Can BTC push toward $85K?
Or will $80K become another major resistance zone?
Follow the price, volume and liquidity — the next Bitcoin move could be decisive.
$BTC $ETH $BNB
#Bitcoin #BTC #BTCBreaks80K #Bitcoin80K #Crypto #BinanceSquare #CryptoNews #BitcoinPrice #BTCUSDT #CryptoMarket #BTCBreaks80K
Bitcoin Reclaims $80K — Is $85K Next? 🚀
Bitcoin is back above the $80,000 psychological level, putting the crypto market back into the spotlight.
The move above $80K comes after Btc recovered strongly from the mid-$70K area. Recent market reports also point to renewed ETF demand and significant short-position liquidations helping fuel the rebound.
🔥 The Key Question:
Can Bitcoin turn $80K from resistance into support?
The $81K–$82K area is now an important zone to watch. A sustained move above this region could keep traders focused on higher levels, while rejection could bring $80K and lower support areas back into focus.
📊 What Could Drive the Next Move?
• Bitcoin holding above $80K
• ETF inflows and institutional demand
• Interest-rate expectations
• Market liquidity
• Short-term profit-taking
Bitcoin's recovery is attracting fresh attention, but crypto remains highly volatile. A breakout alone does not guarantee that the move will continue.
The big question now:
🚀 Can BTC push toward $85K?
Or will $80K become another major resistance zone?
Follow the price, volume and liquidity — the next Bitcoin move could be decisive.
$BTC $ETH $BNB
#Bitcoin #BTC #BTCBreaks80K #Bitcoin80K #Crypto #BinanceSquare #CryptoNews #BitcoinPrice #BTCUSDT #CryptoMarket #BTCBreaks80K
The move above $80K comes after Btc recovered strongly from the mid-$70K area. Recent market reports also point to renewed ETF demand and significant short-position liquidations helping fuel the rebound.
🔥 The Key Question:
Can Bitcoin turn $80K from resistance into support?
The $81K–$82K area is now an important zone to watch. A sustained move above this region could keep traders focused on higher levels, while rejection could bring $80K and lower support areas back into focus.
📊 What Could Drive the Next Move?
• Bitcoin holding above $80K
• ETF inflows and institutional demand
• Interest-rate expectations
• Market liquidity
• Short-term profit-taking
Bitcoin's recovery is attracting fresh attention, but crypto remains highly volatile. A breakout alone does not guarantee that the move will continue.
The big question now:
🚀 Can BTC push toward $85K?
Or will $80K become another major resistance zone?
Follow the price, volume and liquidity — the next Bitcoin move could be decisive.
$BTC $ETH $BNB
#Bitcoin #BTC #BTCBreaks80K #Bitcoin80K #Crypto #BinanceSquare #CryptoNews #BitcoinPrice #BTCUSDT #CryptoMarket #BTCBreaks80K
80
·
--
Article
XRP Exchange Reserves Hit 7-Year Low: Is XRP Supply Getting Tighter?XRP Exchange Reserves Hit 7-Year Low: Is XRP Supply Getting Tighter?
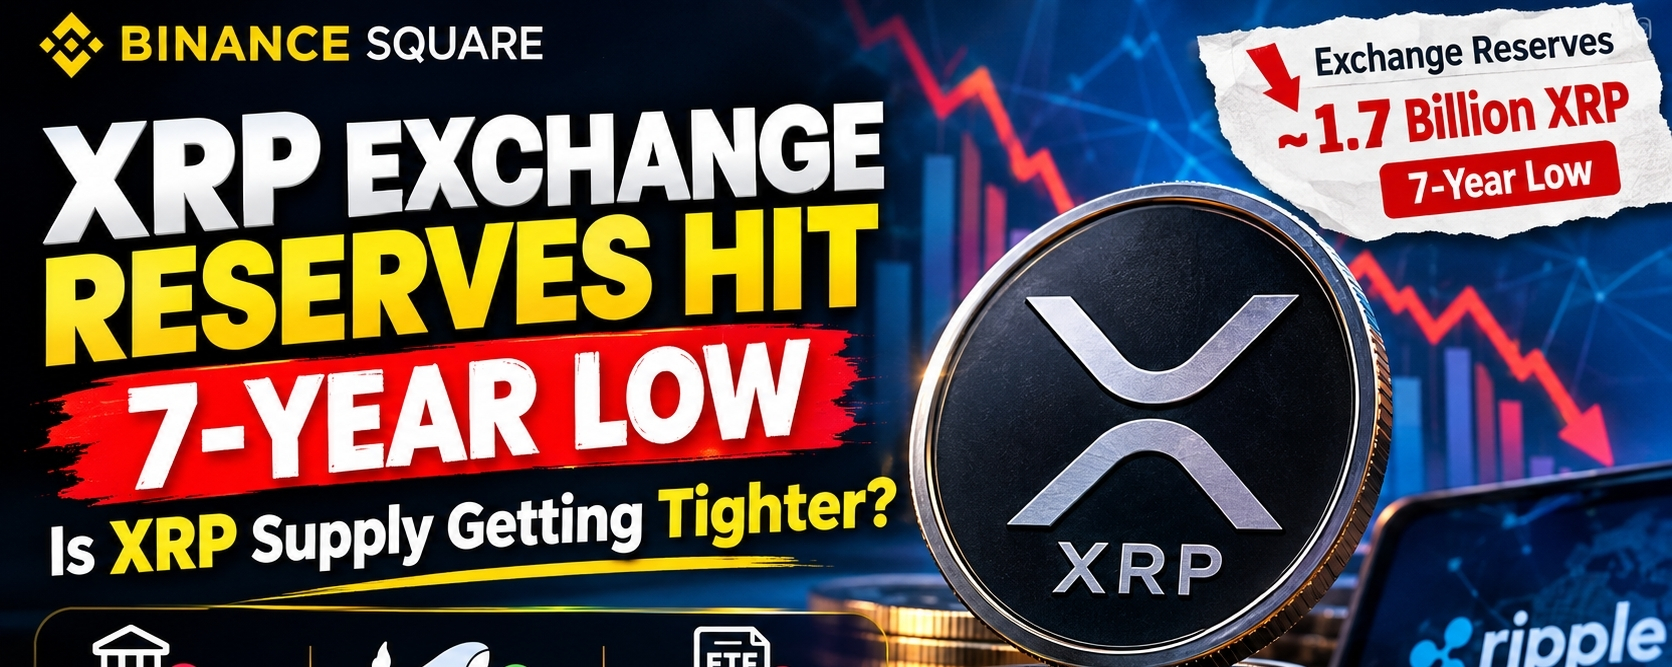
$XRP exchange reserves have fallen to nearly 1.7 billion tokens, reaching their lowest level in around seven years. This major on-chain development is putting XRP’s available exchange supply back in the spotlight as traders watch the next potential move.
According to recent market data reported by Binance News, $XRP held on exchanges has dropped to approximately 1.7 billion XRP, while the token has remained under pressure after its August high.
📉 Why Are $XRP Exchange Reserves Falling?
Exchange reserves measure how much XRP is held on centralized exchanges and potentially available for trading.
Recent data indicates that exchange-held XRP has declined substantially from its previous levels. One report puts the reserve level at roughly 1.6–1.7 billion XRP, compared with about 3.76 billion XRP around the October 2025 peak.
When fewer tokens are sitting on exchanges, the amount of immediately available exchange supply becomes smaller.
However, lower exchange reserves do not automatically mean XRP’s price must rise. Tokens can leave exchanges for several reasons, including self-custody, long-term holding, institutional custody, or transfers between wallets and platforms.
🐋 What Does This Mean for XRP Whales?
The falling exchange supply becomes particularly interesting when combined with whale activity.
Recent reports show that XRP whale deposits to Binance have also increased, with 30-day cumulative whale inflows reaching around 1.6 billion XRP, the highest level since March. Importantly, deposits alone do not prove that whales are preparing to sell.
This creates an important market question:
Are large XRP holders accumulating and moving coins into custody, or is exchange liquidity beginning to return?
Traders will need to watch the direction of reserves and netflows rather than relying on a single metric.
💰 XRP ETFs Add Another Layer:
XRP’s exchange-supply story is developing alongside activity in the spot ETF market.
Binance News reported a $5.15 million outflow from XRP spot ETFs on September 18, although the ETFs were still showing approximately $9.60 million in net inflows for the week at that point.
This means the XRP market currently has conflicting signals: exchange reserves are shrinking, while ETF flows can fluctuate from session to session.
🔎 What Should XRP Traders Watch Next?
Three indicators could become especially important:
1. Exchange Reserves:
If XRP reserves continue falling, immediately available exchange supply could remain relatively tight.
2. Whale Netflows:
Large deposits to exchanges could increase short-term volatility, but deposits alone are not confirmation of selling.
3. ETF Flows:
Sustained ETF inflows could add another source of demand, while persistent outflows could weaken that support.
🚨 The Bigger Picture:
The seven-year-low XRP exchange reserve figure is an important on-chain supply signal, but it should not be treated as a guaranteed price prediction.
The real question is whether declining exchange supply will eventually meet stronger demand.
If exchange reserves continue falling while demand increases, XRP could become more sensitive to large buying or selling orders because less supply is immediately available on exchanges.
For now, XRP’s 7-year exchange-reserve low is a metric worth watching—not a guarantee of the next price move.
#XRP #Ripple #XRPNews #XRPPrice #Crypto #BinanceSquare #CryptoNews #XRPArmy #Altcoins #CryptoAnalysis #XRPExchangeReservesHitSevenYearLow
XRP Exchange Reserves Hit 7-Year Low: Is XRP Supply Getting Tighter?
XRP Exchange Reserves Hit 7-Year Low: Is XRP Supply Getting Tighter?
$XRP exchange reserves have fallen to nearly 1.7 billion tokens, reaching their lowest level in around seven years. This major on-chain development is putting XRP’s available exchange supply back in the spotlight as traders watch the next potential move.
According to recent market data reported by Binance News, $XRP held on exchanges has dropped to approximately 1.7 billion XRP, while the token has remained under pressure after its August high.
📉 Why Are $XRP Exchange Reserves Falling?
Exchange reserves measure how much XRP is held on centralized exchanges and potentially available for trading.
Recent data indicates that exchange-held XRP has declined substantially from its previous levels. One report puts the reserve level at roughly 1.6–1.7 billion XRP, compared with about 3.76 billion XRP around the October 2025 peak.
When fewer tokens are sitting on exchanges, the amount of immediately available exchange supply becomes smaller.
However, lower exchange reserves do not automatically mean XRP’s price must rise. Tokens can leave exchanges for several reasons, including self-custody, long-term holding, institutional custody, or transfers between wallets and platforms.
🐋 What Does This Mean for XRP Whales?
The falling exchange supply becomes particularly interesting when combined with whale activity.
Recent reports show that XRP whale deposits to Binance have also increased, with 30-day cumulative whale inflows reaching around 1.6 billion XRP, the highest level since March. Importantly, deposits alone do not prove that whales are preparing to sell.
This creates an important market question:
Are large XRP holders accumulating and moving coins into custody, or is exchange liquidity beginning to return?
Traders will need to watch the direction of reserves and netflows rather than relying on a single metric.
💰 XRP ETFs Add Another Layer:
XRP’s exchange-supply story is developing alongside activity in the spot ETF market.
Binance News reported a $5.15 million outflow from XRP spot ETFs on September 18, although the ETFs were still showing approximately $9.60 million in net inflows for the week at that point.
This means the XRP market currently has conflicting signals: exchange reserves are shrinking, while ETF flows can fluctuate from session to session.
🔎 What Should XRP Traders Watch Next?
Three indicators could become especially important:
1. Exchange Reserves:
If XRP reserves continue falling, immediately available exchange supply could remain relatively tight.
2. Whale Netflows:
Large deposits to exchanges could increase short-term volatility, but deposits alone are not confirmation of selling.
3. ETF Flows:
Sustained ETF inflows could add another source of demand, while persistent outflows could weaken that support.
🚨 The Bigger Picture:
The seven-year-low XRP exchange reserve figure is an important on-chain supply signal, but it should not be treated as a guaranteed price prediction.
The real question is whether declining exchange supply will eventually meet stronger demand.
If exchange reserves continue falling while demand increases, XRP could become more sensitive to large buying or selling orders because less supply is immediately available on exchanges.
For now, XRP’s 7-year exchange-reserve low is a metric worth watching—not a guarantee of the next price move.
#XRP #Ripple #XRPNews #XRPPrice #Crypto #BinanceSquare #CryptoNews #XRPArmy #Altcoins #CryptoAnalysis #XRPExchangeReservesHitSevenYearLow
$XRP exchange reserves have fallen to nearly 1.7 billion tokens, reaching their lowest level in around seven years. This major on-chain development is putting XRP’s available exchange supply back in the spotlight as traders watch the next potential move.
According to recent market data reported by Binance News, $XRP held on exchanges has dropped to approximately 1.7 billion XRP, while the token has remained under pressure after its August high.
📉 Why Are $XRP Exchange Reserves Falling?
Exchange reserves measure how much XRP is held on centralized exchanges and potentially available for trading.
Recent data indicates that exchange-held XRP has declined substantially from its previous levels. One report puts the reserve level at roughly 1.6–1.7 billion XRP, compared with about 3.76 billion XRP around the October 2025 peak.
When fewer tokens are sitting on exchanges, the amount of immediately available exchange supply becomes smaller.
However, lower exchange reserves do not automatically mean XRP’s price must rise. Tokens can leave exchanges for several reasons, including self-custody, long-term holding, institutional custody, or transfers between wallets and platforms.
🐋 What Does This Mean for XRP Whales?
The falling exchange supply becomes particularly interesting when combined with whale activity.
Recent reports show that XRP whale deposits to Binance have also increased, with 30-day cumulative whale inflows reaching around 1.6 billion XRP, the highest level since March. Importantly, deposits alone do not prove that whales are preparing to sell.
This creates an important market question:
Are large XRP holders accumulating and moving coins into custody, or is exchange liquidity beginning to return?
Traders will need to watch the direction of reserves and netflows rather than relying on a single metric.
💰 XRP ETFs Add Another Layer:
XRP’s exchange-supply story is developing alongside activity in the spot ETF market.
Binance News reported a $5.15 million outflow from XRP spot ETFs on September 18, although the ETFs were still showing approximately $9.60 million in net inflows for the week at that point.
This means the XRP market currently has conflicting signals: exchange reserves are shrinking, while ETF flows can fluctuate from session to session.
🔎 What Should XRP Traders Watch Next?
Three indicators could become especially important:
1. Exchange Reserves:
If XRP reserves continue falling, immediately available exchange supply could remain relatively tight.
2. Whale Netflows:
Large deposits to exchanges could increase short-term volatility, but deposits alone are not confirmation of selling.
3. ETF Flows:
Sustained ETF inflows could add another source of demand, while persistent outflows could weaken that support.
🚨 The Bigger Picture:
The seven-year-low XRP exchange reserve figure is an important on-chain supply signal, but it should not be treated as a guaranteed price prediction.
The real question is whether declining exchange supply will eventually meet stronger demand.
If exchange reserves continue falling while demand increases, XRP could become more sensitive to large buying or selling orders because less supply is immediately available on exchanges.
For now, XRP’s 7-year exchange-reserve low is a metric worth watching—not a guarantee of the next price move.
#XRP #Ripple #XRPNews #XRPPrice #Crypto #BinanceSquare #CryptoNews #XRPArmy #Altcoins #CryptoAnalysis #XRPExchangeReservesHitSevenYearLow
90
·
--
#BTCBreaks80K
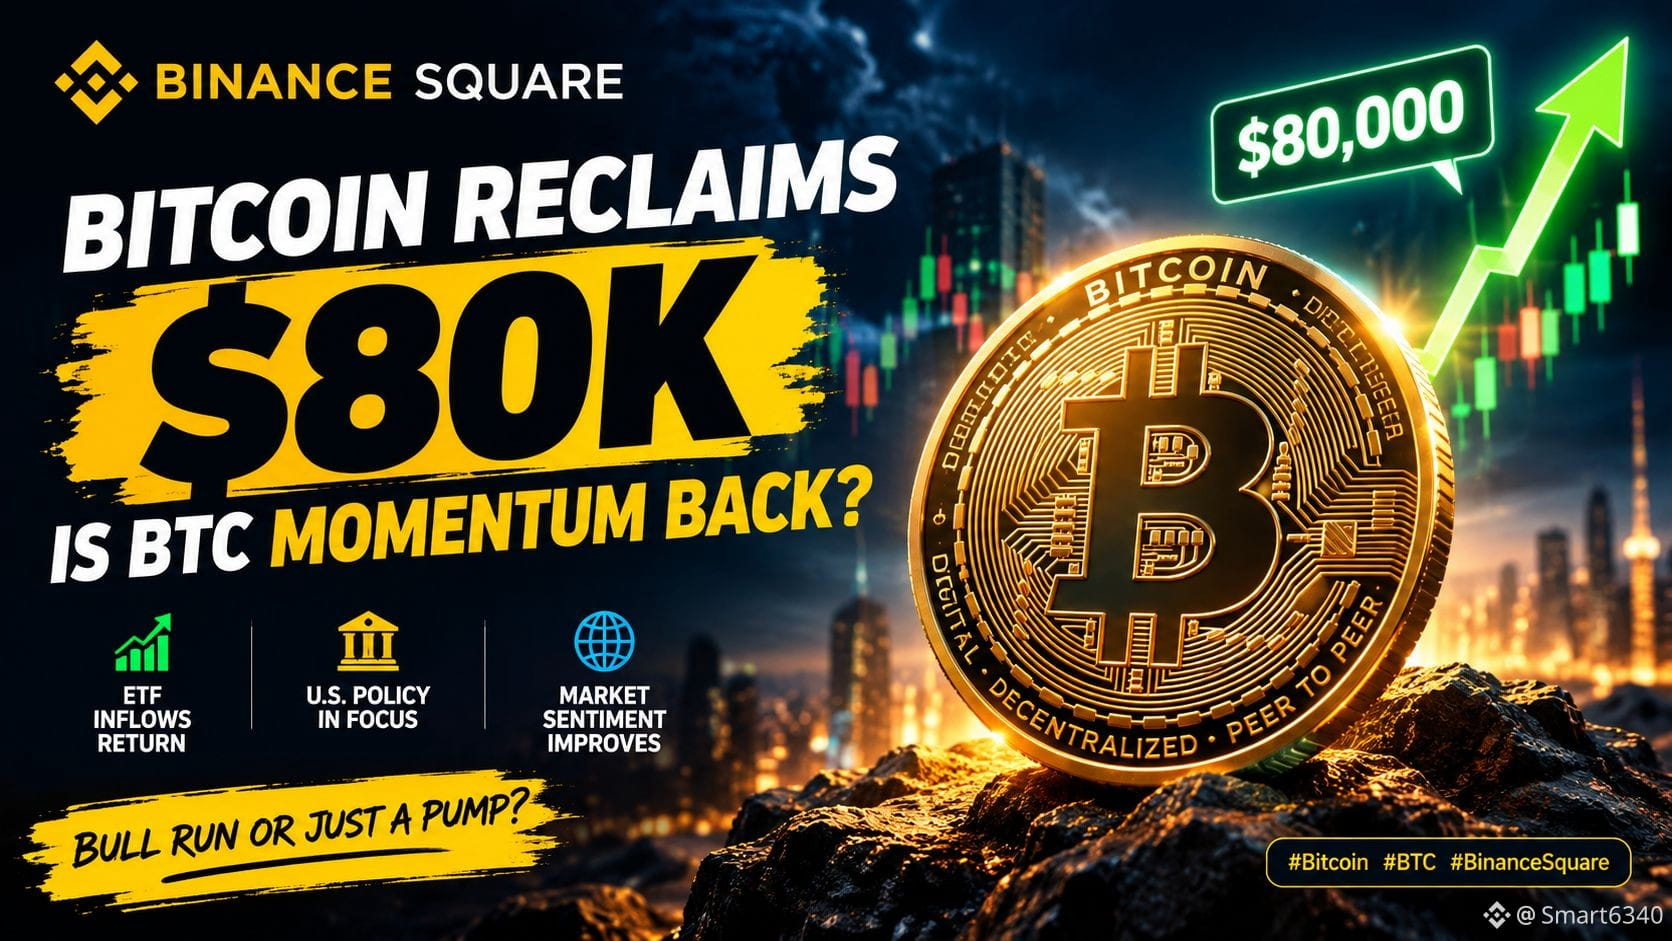
Bitcoin Reclaims $80K: Is BTC Momentum Back? 🚀
$BTC is back above $80,000, marking a strong recovery after recent market pressure. BTC climbed more than 5% in the latest session, while renewed ETF inflows and improving crypto-market sentiment supported the move.
🔥 Why $80K Matters:
The $80K level is now an important psychological and technical zone. Holding above it could show that buyers are regaining control, while a rejection could bring renewed volatility.
👀 What’s Next for Bitcoin?
Traders are watching whether $BTC can maintain its momentum and push toward higher resistance levels. ETF flows, U.S. monetary policy and broader risk sentiment could remain key catalysts.
Bitcoin is back above $80K — but the real question is: Can BTC stay there?
#Bitcoin #BTC #Crypto #BitcoinPrice #BTCUSD #BinanceSquare #CryptoNews #Bitcoin❗
#BTCBreaks80K
Bitcoin Reclaims $80K: Is BTC Momentum Back? 🚀
$BTC is back above $80,000, marking a strong recovery after recent market pressure. BTC climbed more than 5% in the latest session, while renewed ETF inflows and improving crypto-market sentiment supported the move.
🔥 Why $80K Matters:
The $80K level is now an important psychological and technical zone. Holding above it could show that buyers are regaining control, while a rejection could bring renewed volatility.
👀 What’s Next for Bitcoin?
Traders are watching whether $BTC can maintain its momentum and push toward higher resistance levels. ETF flows, U.S. monetary policy and broader risk sentiment could remain key catalysts.
Bitcoin is back above $80K — but the real question is: Can BTC stay there?
#Bitcoin #BTC #Crypto #BitcoinPrice #BTCUSD #BinanceSquare #CryptoNews #Bitcoin❗
Bitcoin Reclaims $80K: Is BTC Momentum Back? 🚀
$BTC is back above $80,000, marking a strong recovery after recent market pressure. BTC climbed more than 5% in the latest session, while renewed ETF inflows and improving crypto-market sentiment supported the move.
🔥 Why $80K Matters:
The $80K level is now an important psychological and technical zone. Holding above it could show that buyers are regaining control, while a rejection could bring renewed volatility.
👀 What’s Next for Bitcoin?
Traders are watching whether $BTC can maintain its momentum and push toward higher resistance levels. ETF flows, U.S. monetary policy and broader risk sentiment could remain key catalysts.
Bitcoin is back above $80K — but the real question is: Can BTC stay there?
#Bitcoin #BTC #Crypto #BitcoinPrice #BTCUSD #BinanceSquare #CryptoNews #Bitcoin❗
1
88
·
--
#BTCBreaks80K
🚨 BTC BREAKS $80,000! 🚀🔥
$BTC is back above the $80K milestone!
Bulls are showing serious strength — now all eyes are on the next move. 👀📈
$80K broken. What’s next? $85K or higher? 🚀
#Bitcoin #BTC #Crypto #BinanceSquare #BTC80K #CryptoMarket
#BTCBreaks80K
🚨 BTC BREAKS $80,000! 🚀🔥
$BTC is back above the $80K milestone!
Bulls are showing serious strength — now all eyes are on the next move. 👀📈
$80K broken. What’s next? $85K or higher? 🚀
#Bitcoin #BTC #Crypto #BinanceSquare #BTC80K #CryptoMarket
🚨 BTC BREAKS $80,000! 🚀🔥
$BTC is back above the $80K milestone!
Bulls are showing serious strength — now all eyes are on the next move. 👀📈
$80K broken. What’s next? $85K or higher? 🚀
#Bitcoin #BTC #Crypto #BinanceSquare #BTC80K #CryptoMarket

1
79
·
--
#BitcoinMarketCapTopsTesla
🚨 BREAKING: $NVDA.US is once again bigger than Tesla by market capitalization. 📈🔥
AI demand continues to drive Nvidia’s dominance, while Tesla faces a changing market.
AI vs EV — the race is heating up! 👀
#NVIDIA #NVDA #Tesla #TSLA #AI #StockMarket #BinanceSquare
#BitcoinMarketCapTopsTesla
🚨 BREAKING: $NVDA.US is once again bigger than Tesla by market capitalization. 📈🔥
AI demand continues to drive Nvidia’s dominance, while Tesla faces a changing market.
AI vs EV — the race is heating up! 👀
#NVIDIA #NVDA #Tesla #TSLA #AI #StockMarket #BinanceSquare
🚨 BREAKING: $NVDA.US is once again bigger than Tesla by market capitalization. 📈🔥
AI demand continues to drive Nvidia’s dominance, while Tesla faces a changing market.
AI vs EV — the race is heating up! 👀
#NVIDIA #NVDA #Tesla #TSLA #AI #StockMarket #BinanceSquare
TSLAB+0.24%
NVDAUS+1.45%
272
·
--
Article
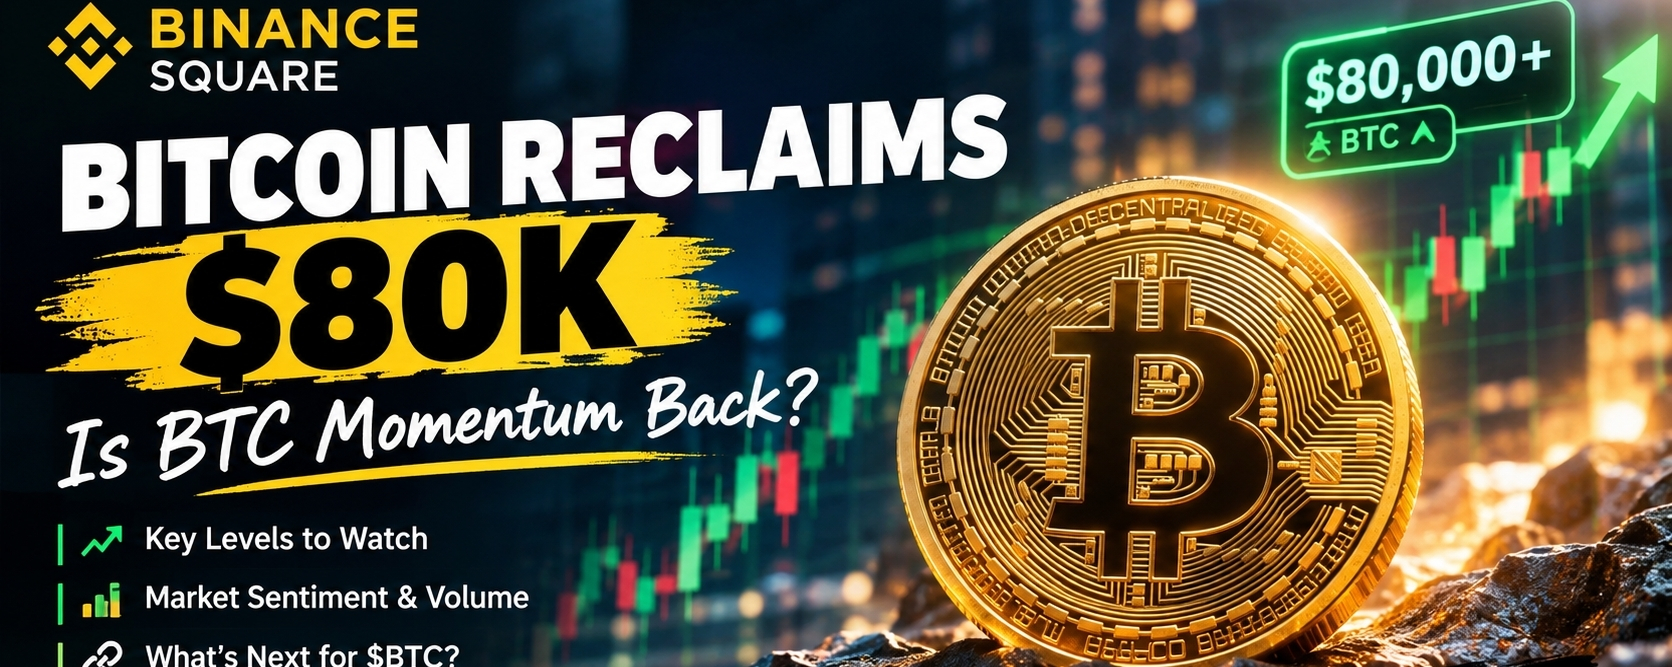
🚨Bitcoin Reclaims $80K: Is BTC Momentum Back?Bitcoin ($BTC) is back above the $80,000 level and the market is paying attention. 🔥
After a volatile week filled with macro pressure and regulatory uncertainty, Bitcoin has delivered a strong rebound. Recent market data shows $BTC gaining more than 6% over 24 hours, while the broader crypto market is also showing renewed strength.
📈 Why Is Bitcoin Moving Higher?
The latest rally comes after Bitcoin pushed back above the psychologically important $80K level.
Recent reports point to several factors behind the move, including short liquidations, renewed market interest and improving sentiment around the crypto market. Bitcoin reached above $81K during the latest move.
But the important question is not simply:
“Did BTC break $80K?”
The bigger question is:
👉 Can Bitcoin HOLD above $80K?
That is where traders should pay attention.
🔎 Key $BTC Levels to Watch
$80,000 — Psychological Support
Holding above this area could keep attention focused on the upside.
$81,000–$82,000 — Important Resistance Zone
Bitcoin has recently traded around this area, making it an important zone to monitor for confirmation of continued momentum.
Below $80K — Momentum Risk
If Bitcoin loses the $80K area after the breakout, traders may want to watch whether the move was a temporary spike or a genuine breakout.
⚡ What About the Rest of Crypto?
Bitcoin's move is also supporting broader market activity.
Recent data showed strong gains across major cryptocurrencies, including $(ETH), $(xrp) and $(SOL), with Solana posting a particularly sharp 24-hour move.
That makes the current market especially interesting for traders watching liquidity and momentum.
🧠 The Real Signal to Watch
Price alone isn't enough.
Keep an eye on:
• $BTC trading volume
• Futures open interest
• Liquidations
• Market momentum
• Whether $BTC can remain above $80K
A breakout with strong volume can tell a very different story from a breakout followed by a quick rejection.
⚠️ Don't Chase the Candle
Bitcoin can move extremely fast.
Instead of entering simply because $BTC is rising, traders should check price action, volume and risk before making any decision.
The $80K breakout is interesting — but confirmation matters.
👀 Are you watching $BTC above $80K?
Check the $BTC chart, monitor the volume and watch how price reacts around the $80K–$82K zone.
What do you think — can Bitcoin hold above $80K? 👇
#Bitcoin #BTC #BTCUSDT #Crypto #Binance #BitcoinPrice #CryptoTrading #BTCAnalysis #CryptoMarket #BinanceSquare
🚨Bitcoin Reclaims $80K: Is BTC Momentum Back?
Bitcoin ($BTC ) is back above the $80,000 level and the market is paying attention. 🔥
After a volatile week filled with macro pressure and regulatory uncertainty, Bitcoin has delivered a strong rebound. Recent market data shows $BTC gaining more than 6% over 24 hours, while the broader crypto market is also showing renewed strength.
📈 Why Is Bitcoin Moving Higher?
The latest rally comes after Bitcoin pushed back above the psychologically important $80K level.
Recent reports point to several factors behind the move, including short liquidations, renewed market interest and improving sentiment around the crypto market. Bitcoin reached above $81K during the latest move.
But the important question is not simply:
“Did BTC break $80K?”
The bigger question is:
👉 Can Bitcoin HOLD above $80K?
That is where traders should pay attention.
🔎 Key $BTC Levels to Watch
$80,000 — Psychological Support
Holding above this area could keep attention focused on the upside.
$81,000–$82,000 — Important Resistance Zone
Bitcoin has recently traded around this area, making it an important zone to monitor for confirmation of continued momentum.
Below $80K — Momentum Risk
If Bitcoin loses the $80K area after the breakout, traders may want to watch whether the move was a temporary spike or a genuine breakout.
⚡ What About the Rest of Crypto?
Bitcoin's move is also supporting broader market activity.
Recent data showed strong gains across major cryptocurrencies, including $(ETH), $(xrp) and $(SOL), with Solana posting a particularly sharp 24-hour move.
That makes the current market especially interesting for traders watching liquidity and momentum.
🧠 The Real Signal to Watch
Price alone isn't enough.
Keep an eye on:
• $BTC trading volume
• Futures open interest
• Liquidations
• Market momentum
• Whether $BTC can remain above $80K
A breakout with strong volume can tell a very different story from a breakout followed by a quick rejection.
⚠️ Don't Chase the Candle
Bitcoin can move extremely fast.
Instead of entering simply because $BTC is rising, traders should check price action, volume and risk before making any decision.
The $80K breakout is interesting — but confirmation matters.
👀 Are you watching $BTC above $80K?
Check the $BTC chart, monitor the volume and watch how price reacts around the $80K–$82K zone.
What do you think — can Bitcoin hold above $80K? 👇
#Bitcoin #BTC #BTCUSDT #Crypto #Binance #BitcoinPrice #CryptoTrading #BTCAnalysis #CryptoMarket #BinanceSquare
After a volatile week filled with macro pressure and regulatory uncertainty, Bitcoin has delivered a strong rebound. Recent market data shows $BTC gaining more than 6% over 24 hours, while the broader crypto market is also showing renewed strength.
📈 Why Is Bitcoin Moving Higher?
The latest rally comes after Bitcoin pushed back above the psychologically important $80K level.
Recent reports point to several factors behind the move, including short liquidations, renewed market interest and improving sentiment around the crypto market. Bitcoin reached above $81K during the latest move.
But the important question is not simply:
“Did BTC break $80K?”
The bigger question is:
👉 Can Bitcoin HOLD above $80K?
That is where traders should pay attention.
🔎 Key $BTC Levels to Watch
$80,000 — Psychological Support
Holding above this area could keep attention focused on the upside.
$81,000–$82,000 — Important Resistance Zone
Bitcoin has recently traded around this area, making it an important zone to monitor for confirmation of continued momentum.
Below $80K — Momentum Risk
If Bitcoin loses the $80K area after the breakout, traders may want to watch whether the move was a temporary spike or a genuine breakout.
⚡ What About the Rest of Crypto?
Bitcoin's move is also supporting broader market activity.
Recent data showed strong gains across major cryptocurrencies, including $(ETH), $(xrp) and $(SOL), with Solana posting a particularly sharp 24-hour move.
That makes the current market especially interesting for traders watching liquidity and momentum.
🧠 The Real Signal to Watch
Price alone isn't enough.
Keep an eye on:
• $BTC trading volume
• Futures open interest
• Liquidations
• Market momentum
• Whether $BTC can remain above $80K
A breakout with strong volume can tell a very different story from a breakout followed by a quick rejection.
⚠️ Don't Chase the Candle
Bitcoin can move extremely fast.
Instead of entering simply because $BTC is rising, traders should check price action, volume and risk before making any decision.
The $80K breakout is interesting — but confirmation matters.
👀 Are you watching $BTC above $80K?
Check the $BTC chart, monitor the volume and watch how price reacts around the $80K–$82K zone.
What do you think — can Bitcoin hold above $80K? 👇
#Bitcoin #BTC #BTCUSDT #Crypto #Binance #BitcoinPrice #CryptoTrading #BTCAnalysis #CryptoMarket #BinanceSquare
1
96
·
--
Article
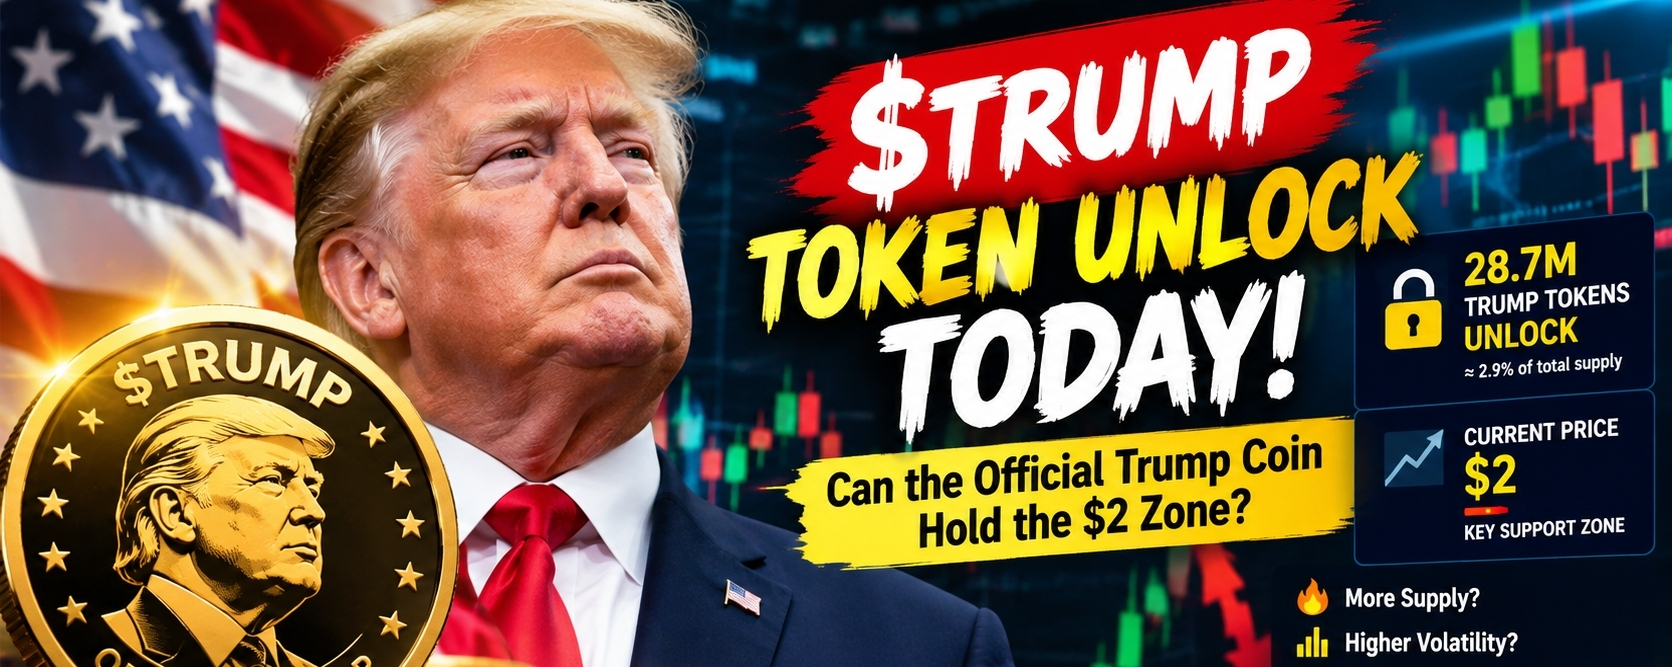
$TRUMP Token Unlock Today: Can the Official Trump Coin Hold the $2 Zone?🚨 $TRUMP Token Unlock Today: Can the Official Trump Coin Hold the $2 Zone?
The Official Trump ($TRUMP) memecoin is facing a major supply event today — and traders are watching the $2 zone closely.
On September 18, around 28.7 million TRUMP tokens, equal to roughly 2.9% of the total supply, are scheduled to unlock. That makes the token unlock one of the key short-term catalysts for $TRUMP and could increase volatility as traders react to changing supply conditions.
📊 $TRUMP Market Snapshot:
Current market data shows Official Trump trading around the $2 level, with recent sessions showing increased volatility. The token remains far below its January 2025 all-time high of $73.43, according to CoinGecko-sourced data.
The key question now is simple:
Will the new supply create additional selling pressure, or will traders absorb the unlocked tokens and push $TRUMP higher?
🐋 Why Traders Are Watching the Unlock:
Token unlocks can change the balance between available supply and market demand. If newly unlocked tokens enter the market and sellers become aggressive, price pressure can increase.
On the other hand, if demand remains strong and the market absorbs the additional supply, the unlock could become less damaging than expected.
Recent reports also indicate that the Official Trump team moved a large amount of SOL ahead of the scheduled unlock, adding another layer of attention around today's event.
🔥 The $2 Level Matters:
With $trump trading around $2, traders are watching whether the token can maintain this psychological price area.
A sustained move above recent highs could attract fresh momentum, while a breakdown could increase selling pressure.
However, meme coins can move rapidly in either direction, so short-term price targets remain speculative.
🎯 What Comes Next for $TRUMP?
For traders, the biggest things to watch are:
• 28.7M TRUMP token unlock
• Trading volume after the unlock
• Whale and team wallet movements
• Whether $TRUMP holds the $2 area
• Overall Bitcoin and crypto-market momentum
The next major move may depend less on the unlock itself and more on how the market reacts to the additional supply.
⚠️ Final Take:
$TRUMP is entering a high-volatility moment. The September 18 token unlock puts supply firmly in focus, while traders are watching price action around the $2 region.
One thing is certain: the next reaction from buyers and sellers could determine whether $TRUMP stabilizes or faces another wave of volatility.
This article is for informational purposes only and is not financial advice. Meme coins carry significant risk and can experience extreme price movements
#TRUMP #TrumpCoin #OfficialTrump #TRUMPToken #Crypto #Memecoin #BinanceSquare #CryptoNews #TokenUnlock #Bitcoin
$TRUMP Token Unlock Today: Can the Official Trump Coin Hold the $2 Zone?
🚨 $TRUMP Token Unlock Today: Can the Official Trump Coin Hold the $2 Zone?
The Official Trump ($TRUMP ) memecoin is facing a major supply event today — and traders are watching the $2 zone closely.
On September 18, around 28.7 million TRUMP tokens, equal to roughly 2.9% of the total supply, are scheduled to unlock. That makes the token unlock one of the key short-term catalysts for $TRUMP and could increase volatility as traders react to changing supply conditions.
📊 $TRUMP Market Snapshot:
Current market data shows Official Trump trading around the $2 level, with recent sessions showing increased volatility. The token remains far below its January 2025 all-time high of $73.43, according to CoinGecko-sourced data.
The key question now is simple:
Will the new supply create additional selling pressure, or will traders absorb the unlocked tokens and push $TRUMP higher?
🐋 Why Traders Are Watching the Unlock:
Token unlocks can change the balance between available supply and market demand. If newly unlocked tokens enter the market and sellers become aggressive, price pressure can increase.
On the other hand, if demand remains strong and the market absorbs the additional supply, the unlock could become less damaging than expected.
Recent reports also indicate that the Official Trump team moved a large amount of SOL ahead of the scheduled unlock, adding another layer of attention around today's event.
🔥 The $2 Level Matters:
With $trump trading around $2, traders are watching whether the token can maintain this psychological price area.
A sustained move above recent highs could attract fresh momentum, while a breakdown could increase selling pressure.
However, meme coins can move rapidly in either direction, so short-term price targets remain speculative.
🎯 What Comes Next for $TRUMP ?
For traders, the biggest things to watch are:
• 28.7M TRUMP token unlock
• Trading volume after the unlock
• Whale and team wallet movements
• Whether $TRUMP holds the $2 area
• Overall Bitcoin and crypto-market momentum
The next major move may depend less on the unlock itself and more on how the market reacts to the additional supply.
⚠️ Final Take:
$TRUMP is entering a high-volatility moment. The September 18 token unlock puts supply firmly in focus, while traders are watching price action around the $2 region.
One thing is certain: the next reaction from buyers and sellers could determine whether $TRUMP stabilizes or faces another wave of volatility.
This article is for informational purposes only and is not financial advice. Meme coins carry significant risk and can experience extreme price movements
#TRUMP #TrumpCoin #OfficialTrump #TRUMPToken #Crypto #Memecoin #BinanceSquare #CryptoNews #TokenUnlock #Bitcoin
The Official Trump ($TRUMP ) memecoin is facing a major supply event today — and traders are watching the $2 zone closely.
On September 18, around 28.7 million TRUMP tokens, equal to roughly 2.9% of the total supply, are scheduled to unlock. That makes the token unlock one of the key short-term catalysts for $TRUMP and could increase volatility as traders react to changing supply conditions.
📊 $TRUMP Market Snapshot:
Current market data shows Official Trump trading around the $2 level, with recent sessions showing increased volatility. The token remains far below its January 2025 all-time high of $73.43, according to CoinGecko-sourced data.
The key question now is simple:
Will the new supply create additional selling pressure, or will traders absorb the unlocked tokens and push $TRUMP higher?
🐋 Why Traders Are Watching the Unlock:
Token unlocks can change the balance between available supply and market demand. If newly unlocked tokens enter the market and sellers become aggressive, price pressure can increase.
On the other hand, if demand remains strong and the market absorbs the additional supply, the unlock could become less damaging than expected.
Recent reports also indicate that the Official Trump team moved a large amount of SOL ahead of the scheduled unlock, adding another layer of attention around today's event.
🔥 The $2 Level Matters:
With $trump trading around $2, traders are watching whether the token can maintain this psychological price area.
A sustained move above recent highs could attract fresh momentum, while a breakdown could increase selling pressure.
However, meme coins can move rapidly in either direction, so short-term price targets remain speculative.
🎯 What Comes Next for $TRUMP ?
For traders, the biggest things to watch are:
• 28.7M TRUMP token unlock
• Trading volume after the unlock
• Whale and team wallet movements
• Whether $TRUMP holds the $2 area
• Overall Bitcoin and crypto-market momentum
The next major move may depend less on the unlock itself and more on how the market reacts to the additional supply.
⚠️ Final Take:
$TRUMP is entering a high-volatility moment. The September 18 token unlock puts supply firmly in focus, while traders are watching price action around the $2 region.
One thing is certain: the next reaction from buyers and sellers could determine whether $TRUMP stabilizes or faces another wave of volatility.
This article is for informational purposes only and is not financial advice. Meme coins carry significant risk and can experience extreme price movements
#TRUMP #TrumpCoin #OfficialTrump #TRUMPToken #Crypto #Memecoin #BinanceSquare #CryptoNews #TokenUnlock #Bitcoin
2
326
·
--
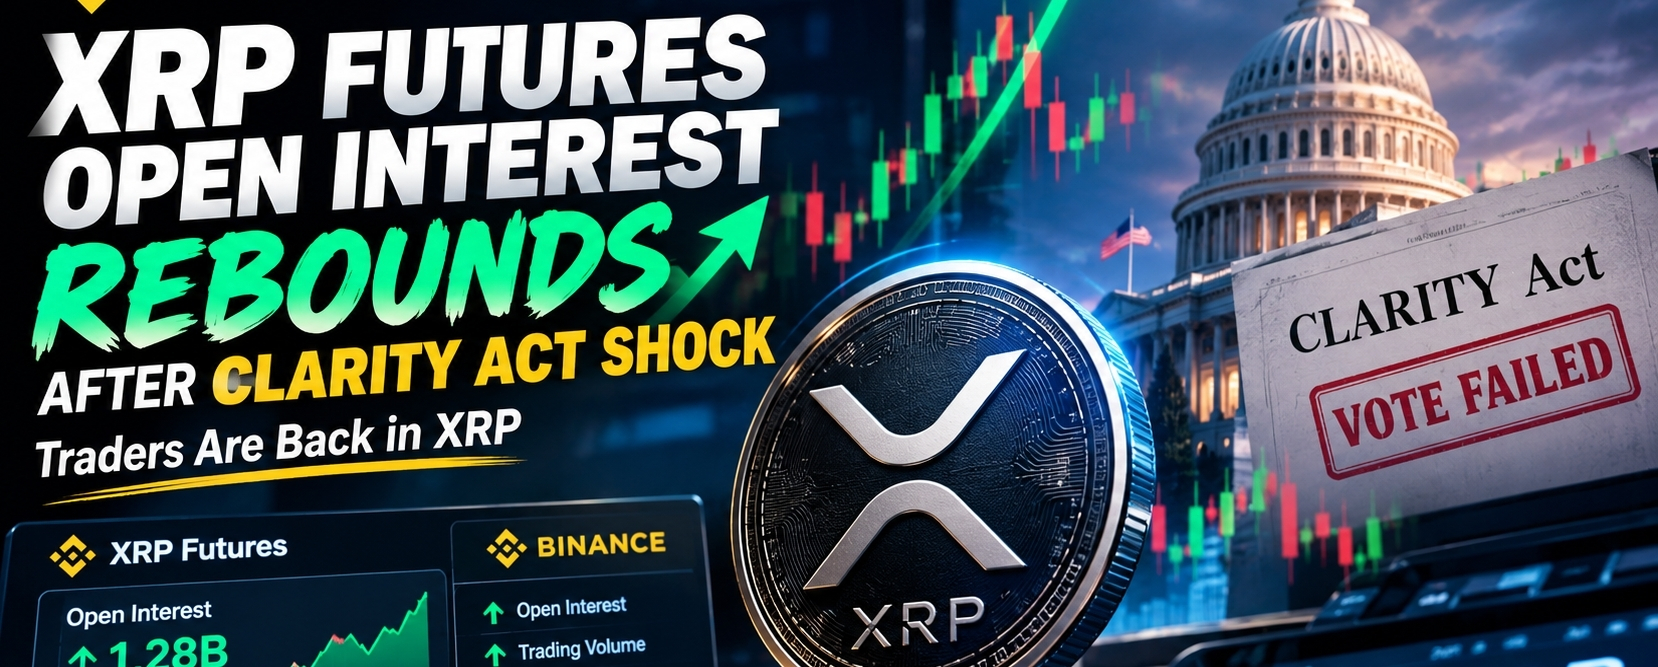
Article
XRP Futures OI Rebounds After CLARITY Act Shock — Traders Are BackXRP Futures Open Interest Rebounds After CLARITY Act Shock — Are Traders Positioning for a Comeback?
$XRP traders are sending a surprising signal. After the U.S. Senate failed to advance the CLARITY Act, XRP faced sharp volatility — but futures open interest has started recovering, suggesting traders are once again increasing their exposure to the market.
The Senate procedural vote on September 15 ended with a 49–50 result, falling short of the 60 votes required to advance the bill. The news triggered pressure across crypto markets and pushed $XRP lower.
📈 XRP Futures Open Interest Starts Recovering:
Despite the regulatory setback, Binance futures positioning has bounced back. Recent market reporting indicates that Binance traders now hold more XRP futures exposure than they did before the CLARITY Act vote.
This recovery in Open Interest (OI) is important because OI measures the amount of outstanding futures contracts. Rising OI can indicate that fresh positions are entering the market, although it does not reveal whether traders are predominantly bullish or bearish.
In other words, the market is becoming active again but the direction of those positions still matters.
⚡ Why the CLARITY Act Matters for XRP:
The CLARITY Act was designed to create a broader U.S. regulatory framework for digital assets. Its failure to advance has increased uncertainty around future crypto regulation.
$XRP was particularly sensitive to the vote because regulatory clarity has been a major theme surrounding the asset.
Before the vote, XRP derivatives activity had already increased significantly as traders positioned around the event. Binance's own coverage also highlighted the importance of the September 15 procedural vote for crypto markets.
🔥 The Bigger Signal: Traders Aren't Leaving XRP:
The recovery in futures OI suggests that the CLARITY Act disappointment did not completely remove traders' interest in XRP.
Instead, market participants appear to be rebuilding futures exposure after the initial volatility.
However, higher OI alone should not be interpreted as a guaranteed bullish signal. If leverage builds too quickly, XRP can become more vulnerable to sudden liquidations and sharp price swings.
👀 What XRP Traders Are Watching Next:
The key question now is whether rising futures participation will be supported by stronger spot demand.
Traders are likely watching:
- XRP futures Open Interest
- Funding rates
- Trading volume
- Spot XRP demand
- Key price support and resistance levels
- Future U.S. crypto regulatory developments
If OI continues rising while spot demand also strengthens, market participation could remain elevated. If OI rises mainly through aggressive leverage, volatility could increase.
🚨 Bottom Line:
The CLARITY Act vote delivered a major regulatory setback, but XRP futures activity is showing signs of renewed participation.
That creates an interesting market setup: regulatory uncertainty remains, yet derivatives traders are returning.
For XRP, the next move may depend less on the headline itself and more on whether fresh futures positioning is supported by real spot-market demand.
XRP is back on traders' radar and the next major move could be driven by positioning, liquidity and regulatory headlines.
This article is for informational purposes only and is not financial advice.
#XRPnews #XRPClearityAct #BitcoinSpotETFsNetInflow$159M #HYPEJumpsOver11% #HKMAPlansWholesaleCBDCByYearEnd
XRP Futures OI Rebounds After CLARITY Act Shock — Traders Are Back
XRP Futures Open Interest Rebounds After CLARITY Act Shock — Are Traders Positioning for a Comeback?
$XRP traders are sending a surprising signal. After the U.S. Senate failed to advance the CLARITY Act, XRP faced sharp volatility — but futures open interest has started recovering, suggesting traders are once again increasing their exposure to the market.
The Senate procedural vote on September 15 ended with a 49–50 result, falling short of the 60 votes required to advance the bill. The news triggered pressure across crypto markets and pushed $XRP lower.
📈 XRP Futures Open Interest Starts Recovering:
Despite the regulatory setback, Binance futures positioning has bounced back. Recent market reporting indicates that Binance traders now hold more XRP futures exposure than they did before the CLARITY Act vote.
This recovery in Open Interest (OI) is important because OI measures the amount of outstanding futures contracts. Rising OI can indicate that fresh positions are entering the market, although it does not reveal whether traders are predominantly bullish or bearish.
In other words, the market is becoming active again but the direction of those positions still matters.
⚡ Why the CLARITY Act Matters for XRP:
The CLARITY Act was designed to create a broader U.S. regulatory framework for digital assets. Its failure to advance has increased uncertainty around future crypto regulation.
$XRP was particularly sensitive to the vote because regulatory clarity has been a major theme surrounding the asset.
Before the vote, XRP derivatives activity had already increased significantly as traders positioned around the event. Binance's own coverage also highlighted the importance of the September 15 procedural vote for crypto markets.
🔥 The Bigger Signal: Traders Aren't Leaving XRP:
The recovery in futures OI suggests that the CLARITY Act disappointment did not completely remove traders' interest in XRP.
Instead, market participants appear to be rebuilding futures exposure after the initial volatility.
However, higher OI alone should not be interpreted as a guaranteed bullish signal. If leverage builds too quickly, XRP can become more vulnerable to sudden liquidations and sharp price swings.
👀 What XRP Traders Are Watching Next:
The key question now is whether rising futures participation will be supported by stronger spot demand.
Traders are likely watching:
- XRP futures Open Interest
- Funding rates
- Trading volume
- Spot XRP demand
- Key price support and resistance levels
- Future U.S. crypto regulatory developments
If OI continues rising while spot demand also strengthens, market participation could remain elevated. If OI rises mainly through aggressive leverage, volatility could increase.
🚨 Bottom Line:
The CLARITY Act vote delivered a major regulatory setback, but XRP futures activity is showing signs of renewed participation.
That creates an interesting market setup: regulatory uncertainty remains, yet derivatives traders are returning.
For XRP, the next move may depend less on the headline itself and more on whether fresh futures positioning is supported by real spot-market demand.
XRP is back on traders' radar and the next major move could be driven by positioning, liquidity and regulatory headlines.
This article is for informational purposes only and is not financial advice.
#XRPnews #XRPClearityAct #BitcoinSpotETFsNetInflow$159M #HYPEJumpsOver11% #HKMAPlansWholesaleCBDCByYearEnd
$XRP traders are sending a surprising signal. After the U.S. Senate failed to advance the CLARITY Act, XRP faced sharp volatility — but futures open interest has started recovering, suggesting traders are once again increasing their exposure to the market.
The Senate procedural vote on September 15 ended with a 49–50 result, falling short of the 60 votes required to advance the bill. The news triggered pressure across crypto markets and pushed $XRP lower.
📈 XRP Futures Open Interest Starts Recovering:
Despite the regulatory setback, Binance futures positioning has bounced back. Recent market reporting indicates that Binance traders now hold more XRP futures exposure than they did before the CLARITY Act vote.
This recovery in Open Interest (OI) is important because OI measures the amount of outstanding futures contracts. Rising OI can indicate that fresh positions are entering the market, although it does not reveal whether traders are predominantly bullish or bearish.
In other words, the market is becoming active again but the direction of those positions still matters.
⚡ Why the CLARITY Act Matters for XRP:
The CLARITY Act was designed to create a broader U.S. regulatory framework for digital assets. Its failure to advance has increased uncertainty around future crypto regulation.
$XRP was particularly sensitive to the vote because regulatory clarity has been a major theme surrounding the asset.
Before the vote, XRP derivatives activity had already increased significantly as traders positioned around the event. Binance's own coverage also highlighted the importance of the September 15 procedural vote for crypto markets.
🔥 The Bigger Signal: Traders Aren't Leaving XRP:
The recovery in futures OI suggests that the CLARITY Act disappointment did not completely remove traders' interest in XRP.
Instead, market participants appear to be rebuilding futures exposure after the initial volatility.
However, higher OI alone should not be interpreted as a guaranteed bullish signal. If leverage builds too quickly, XRP can become more vulnerable to sudden liquidations and sharp price swings.
👀 What XRP Traders Are Watching Next:
The key question now is whether rising futures participation will be supported by stronger spot demand.
Traders are likely watching:
- XRP futures Open Interest
- Funding rates
- Trading volume
- Spot XRP demand
- Key price support and resistance levels
- Future U.S. crypto regulatory developments
If OI continues rising while spot demand also strengthens, market participation could remain elevated. If OI rises mainly through aggressive leverage, volatility could increase.
🚨 Bottom Line:
The CLARITY Act vote delivered a major regulatory setback, but XRP futures activity is showing signs of renewed participation.
That creates an interesting market setup: regulatory uncertainty remains, yet derivatives traders are returning.
For XRP, the next move may depend less on the headline itself and more on whether fresh futures positioning is supported by real spot-market demand.
XRP is back on traders' radar and the next major move could be driven by positioning, liquidity and regulatory headlines.
This article is for informational purposes only and is not financial advice.
#XRPnews #XRPClearityAct #BitcoinSpotETFsNetInflow$159M #HYPEJumpsOver11% #HKMAPlansWholesaleCBDCByYearEnd
129
·
--
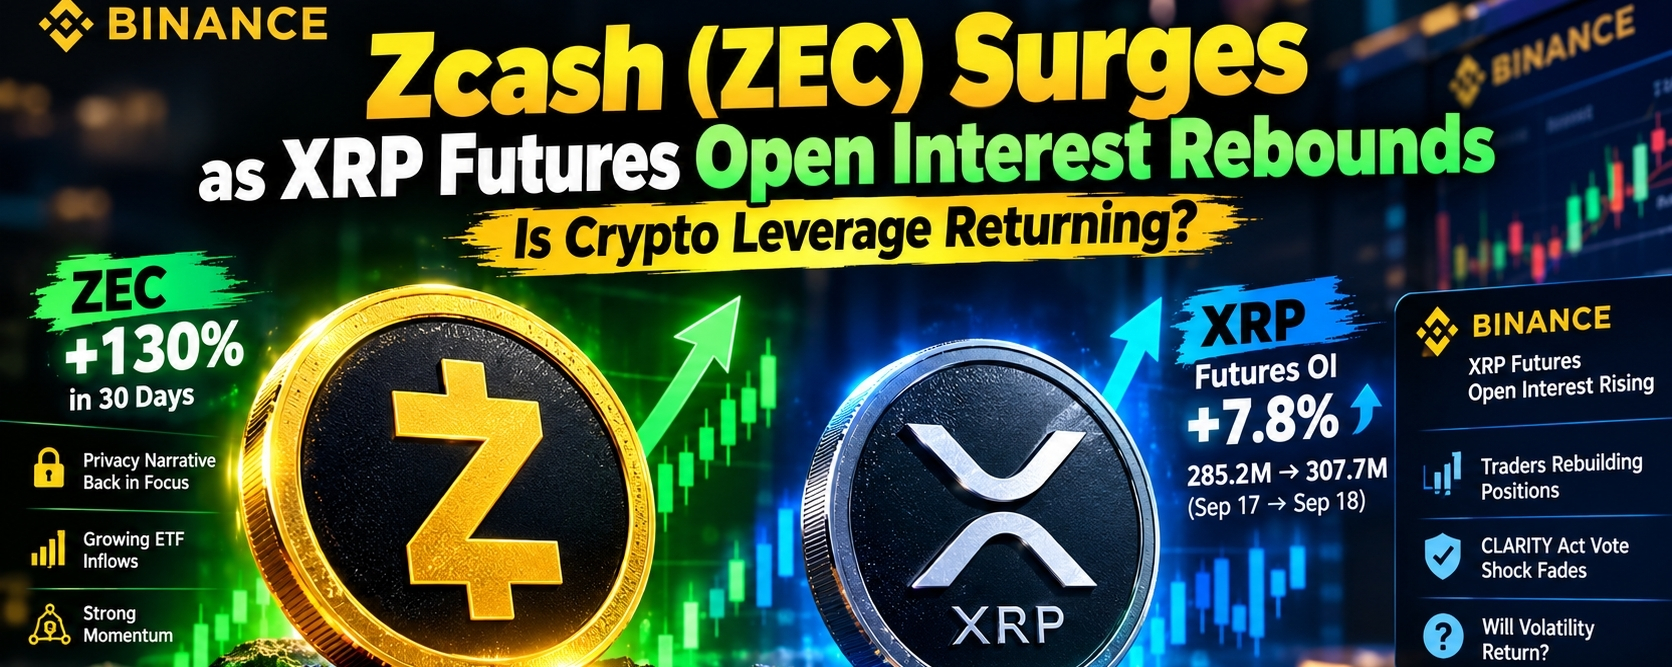
Article
Zcash (ZEC) Surges as XRP Futures Open Interest Rebounds — Is Crypto Leverage Returning?The crypto market is sending two very different signals: Zcash (ZEC) is exploding higher, while $XRP futures traders are quietly rebuilding positions. Could this be an early sign that risk appetite is returning to altcoins?
Zcash has emerged as one of the strongest-performing major crypto assets in recent sessions. Binance News reported ZEC rising sharply, with the token gaining around 130% over 30 days in one recent market update. More recently, CoinDesk reported another 23% 24-hour jump, putting ZEC around the $1,369 area.
🚀 Why Is Zcash (ZEC) Surging?
ZEC's rally comes amid renewed interest in privacy-focused cryptocurrencies.
One important development has been the growing attention around Zcash's ecosystem and its upcoming network changes. Coinholders recently voted overwhelmingly to maintain Bitcoin-style halvings, while Zcash's privacy narrative has continued attracting attention from crypto investors.
Another major factor is institutional interest. Binance News reported that the U.S. spot Zcash ETF attracted nearly $47 million in a single day, bringing its monthly inflows above $230 million.
That creates an interesting setup: spot demand is increasing while ZEC futures leverage has previously cooled from its September peak.
📊 XRP Futures Open Interest Is Recovering:
While Zcash is leading the momentum side of the market, XRP is showing a different signal.
According to a September 18 report, Binance XRP futures open interest increased from 285.2 million XRP on September 17 to 307.7 million XRP on September 18.
That means futures traders are rebuilding exposure after the sharp reaction surrounding the U.S. Senate's CLARITY Act vote.
Open interest measures the total number of outstanding futures contracts. When it rises, it generally means more positions are being opened or existing positions are being maintained with fresh capital.
But rising open interest does not automatically mean XRP will go up. Both long and short positions can increase, so traders should watch price action, funding rates and liquidation data alongside OI.
⚡ CLARITY Act Shock Didn't End XRP Futures Activity:
The CLARITY Act vote created significant volatility across crypto markets, particularly XRP.
Binance News reported that XRP dropped more than 7% after the Senate vote failed, while Zcash moved in the opposite direction.
Now, the recovery in Binance XRP futures open interest suggests that traders have not completely abandoned the XRP market.
This creates an important question:
Are traders positioning for another XRP volatility wave?
The answer will depend on whether increasing open interest is accompanied by sustained spot buying or instead becomes excessive leveraged positioning.
🔥 ZEC vs XRP: Two Different Crypto Signals:
The current market setup is particularly interesting:
ZEC: Strong price momentum + growing ETF attention + renewed privacy-coin interest.
XRP: Price volatility + recovering Binance futures open interest + continued focus on U.S. crypto regulation.
Together, these moves show that traders are looking beyond Bitcoin and Ethereum for opportunities.
👀 What Crypto Traders Should Watch Next
The next major signals could come from:
• ZEC price momentum — Can Zcash maintain its recent breakout?
• Zcash ETF flows — Continued inflows could provide additional spot-market support.
• XRP futures open interest — Further increases could signal rising trader activity.
• $XRP funding rates — Important for determining whether leverage is becoming crowded.
• Bitcoin direction — BTC remains the broader market benchmark.
• Regulatory developments — Future U.S. crypto legislation could again influence XRP and other major altcoins.
Final Takeaway:
Zcash is showing powerful momentum, while $XRP futures traders are rebuilding exposure after the CLARITY Act shock.
The combination of strong ZEC performance and recovering XRP open interest suggests that altcoin trading activity remains highly active despite recent macro and regulatory uncertainty.
The key question now isn't simply whether crypto is bullish or bearish.
It's where the next wave of liquidity will go.
#Zcash #ZEC #XRP #XRPNews #HYPEJumpsOver11% #HKMAPlansWholesaleCBDCByYearEnd #BOJHikesRatesTo31YearHigh #CryptoNews #BinanceSquare #CryptoTrading #Bitcoin #Altcoins #CryptoMarket #FuturesTrading #OpenInterest
Zcash (ZEC) Surges as XRP Futures Open Interest Rebounds — Is Crypto Leverage Returning?
The crypto market is sending two very different signals: Zcash (ZEC) is exploding higher, while $XRP futures traders are quietly rebuilding positions. Could this be an early sign that risk appetite is returning to altcoins?
Zcash has emerged as one of the strongest-performing major crypto assets in recent sessions. Binance News reported ZEC rising sharply, with the token gaining around 130% over 30 days in one recent market update. More recently, CoinDesk reported another 23% 24-hour jump, putting ZEC around the $1,369 area.
🚀 Why Is Zcash (ZEC) Surging?
ZEC's rally comes amid renewed interest in privacy-focused cryptocurrencies.
One important development has been the growing attention around Zcash's ecosystem and its upcoming network changes. Coinholders recently voted overwhelmingly to maintain Bitcoin-style halvings, while Zcash's privacy narrative has continued attracting attention from crypto investors.
Another major factor is institutional interest. Binance News reported that the U.S. spot Zcash ETF attracted nearly $47 million in a single day, bringing its monthly inflows above $230 million.
That creates an interesting setup: spot demand is increasing while ZEC futures leverage has previously cooled from its September peak.
📊 XRP Futures Open Interest Is Recovering:
While Zcash is leading the momentum side of the market, XRP is showing a different signal.
According to a September 18 report, Binance XRP futures open interest increased from 285.2 million XRP on September 17 to 307.7 million XRP on September 18.
That means futures traders are rebuilding exposure after the sharp reaction surrounding the U.S. Senate's CLARITY Act vote.
Open interest measures the total number of outstanding futures contracts. When it rises, it generally means more positions are being opened or existing positions are being maintained with fresh capital.
But rising open interest does not automatically mean XRP will go up. Both long and short positions can increase, so traders should watch price action, funding rates and liquidation data alongside OI.
⚡ CLARITY Act Shock Didn't End XRP Futures Activity:
The CLARITY Act vote created significant volatility across crypto markets, particularly XRP.
Binance News reported that XRP dropped more than 7% after the Senate vote failed, while Zcash moved in the opposite direction.
Now, the recovery in Binance XRP futures open interest suggests that traders have not completely abandoned the XRP market.
This creates an important question:
Are traders positioning for another XRP volatility wave?
The answer will depend on whether increasing open interest is accompanied by sustained spot buying or instead becomes excessive leveraged positioning.
🔥 ZEC vs XRP: Two Different Crypto Signals:
The current market setup is particularly interesting:
ZEC: Strong price momentum + growing ETF attention + renewed privacy-coin interest.
XRP: Price volatility + recovering Binance futures open interest + continued focus on U.S. crypto regulation.
Together, these moves show that traders are looking beyond Bitcoin and Ethereum for opportunities.
👀 What Crypto Traders Should Watch Next
The next major signals could come from:
• ZEC price momentum — Can Zcash maintain its recent breakout?
• Zcash ETF flows — Continued inflows could provide additional spot-market support.
• XRP futures open interest — Further increases could signal rising trader activity.
• $XRP funding rates — Important for determining whether leverage is becoming crowded.
• Bitcoin direction — BTC remains the broader market benchmark.
• Regulatory developments — Future U.S. crypto legislation could again influence XRP and other major altcoins.
Final Takeaway:
Zcash is showing powerful momentum, while $XRP futures traders are rebuilding exposure after the CLARITY Act shock.
The combination of strong ZEC performance and recovering XRP open interest suggests that altcoin trading activity remains highly active despite recent macro and regulatory uncertainty.
The key question now isn't simply whether crypto is bullish or bearish.
It's where the next wave of liquidity will go.
#Zcash #ZEC #XRP #XRPNews #HYPEJumpsOver11% #HKMAPlansWholesaleCBDCByYearEnd #BOJHikesRatesTo31YearHigh #CryptoNews #BinanceSquare #CryptoTrading #Bitcoin #Altcoins #CryptoMarket #FuturesTrading #OpenInterest
Zcash has emerged as one of the strongest-performing major crypto assets in recent sessions. Binance News reported ZEC rising sharply, with the token gaining around 130% over 30 days in one recent market update. More recently, CoinDesk reported another 23% 24-hour jump, putting ZEC around the $1,369 area.
🚀 Why Is Zcash (ZEC) Surging?
ZEC's rally comes amid renewed interest in privacy-focused cryptocurrencies.
One important development has been the growing attention around Zcash's ecosystem and its upcoming network changes. Coinholders recently voted overwhelmingly to maintain Bitcoin-style halvings, while Zcash's privacy narrative has continued attracting attention from crypto investors.
Another major factor is institutional interest. Binance News reported that the U.S. spot Zcash ETF attracted nearly $47 million in a single day, bringing its monthly inflows above $230 million.
That creates an interesting setup: spot demand is increasing while ZEC futures leverage has previously cooled from its September peak.
📊 XRP Futures Open Interest Is Recovering:
While Zcash is leading the momentum side of the market, XRP is showing a different signal.
According to a September 18 report, Binance XRP futures open interest increased from 285.2 million XRP on September 17 to 307.7 million XRP on September 18.
That means futures traders are rebuilding exposure after the sharp reaction surrounding the U.S. Senate's CLARITY Act vote.
Open interest measures the total number of outstanding futures contracts. When it rises, it generally means more positions are being opened or existing positions are being maintained with fresh capital.
But rising open interest does not automatically mean XRP will go up. Both long and short positions can increase, so traders should watch price action, funding rates and liquidation data alongside OI.
⚡ CLARITY Act Shock Didn't End XRP Futures Activity:
The CLARITY Act vote created significant volatility across crypto markets, particularly XRP.
Binance News reported that XRP dropped more than 7% after the Senate vote failed, while Zcash moved in the opposite direction.
Now, the recovery in Binance XRP futures open interest suggests that traders have not completely abandoned the XRP market.
This creates an important question:
Are traders positioning for another XRP volatility wave?
The answer will depend on whether increasing open interest is accompanied by sustained spot buying or instead becomes excessive leveraged positioning.
🔥 ZEC vs XRP: Two Different Crypto Signals:
The current market setup is particularly interesting:
ZEC: Strong price momentum + growing ETF attention + renewed privacy-coin interest.
XRP: Price volatility + recovering Binance futures open interest + continued focus on U.S. crypto regulation.
Together, these moves show that traders are looking beyond Bitcoin and Ethereum for opportunities.
👀 What Crypto Traders Should Watch Next
The next major signals could come from:
• ZEC price momentum — Can Zcash maintain its recent breakout?
• Zcash ETF flows — Continued inflows could provide additional spot-market support.
• XRP futures open interest — Further increases could signal rising trader activity.
• $XRP funding rates — Important for determining whether leverage is becoming crowded.
• Bitcoin direction — BTC remains the broader market benchmark.
• Regulatory developments — Future U.S. crypto legislation could again influence XRP and other major altcoins.
Final Takeaway:
Zcash is showing powerful momentum, while $XRP futures traders are rebuilding exposure after the CLARITY Act shock.
The combination of strong ZEC performance and recovering XRP open interest suggests that altcoin trading activity remains highly active despite recent macro and regulatory uncertainty.
The key question now isn't simply whether crypto is bullish or bearish.
It's where the next wave of liquidity will go.
#Zcash #ZEC #XRP #XRPNews #HYPEJumpsOver11% #HKMAPlansWholesaleCBDCByYearEnd #BOJHikesRatesTo31YearHigh #CryptoNews #BinanceSquare #CryptoTrading #Bitcoin #Altcoins #CryptoMarket #FuturesTrading #OpenInterest
120
·
--
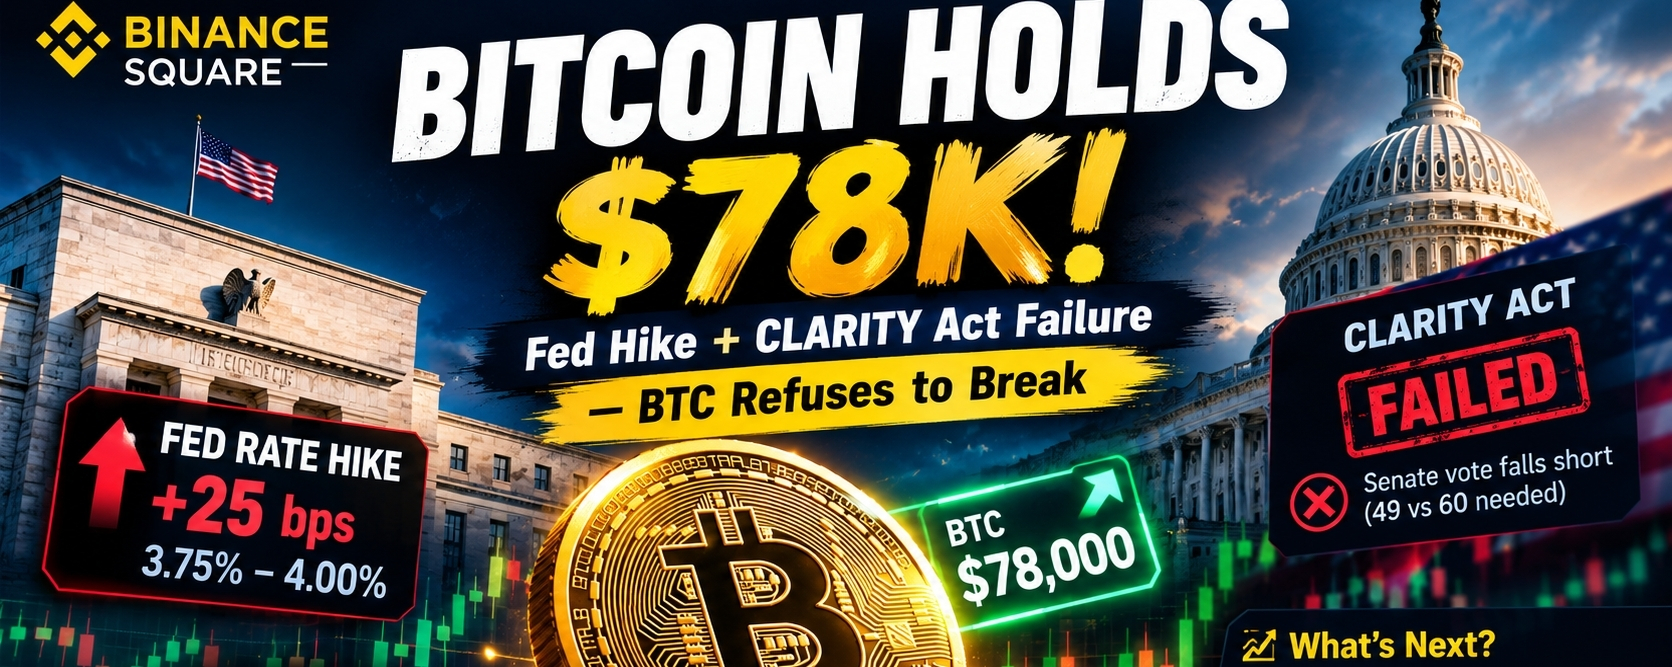
Article
Bitcoin Holds $78K After Fed Rate Hike + CLARITY Act FailureBitcoin Holds $78K Despite Fed Rate Hike & CLARITY Act Failure — What’s Next?
$BTC is showing unexpected resilience. After absorbing a 25-basis-point Federal Reserve rate hike and the failure of the U.S. Senate’s CLARITY Act vote, BTC has managed to hold around the $78,000 zone.
The bigger story may not be the negative headlines themselves — but Bitcoin’s limited reaction to them.
⚡ Two Major Headwinds Hit $BTC
The U.S. Federal Reserve raised its target interest-rate range to 3.75%–4.00%, marking its first rate increase since July 2023. Higher rates can put pressure on risk assets by keeping financial conditions tighter.
At the same time, the CLARITY Act failed to clear a key Senate procedural vote, receiving 49 votes against 50, falling short of the 60 votes required to advance.
Yet Bitcoin did not experience a sustained collapse.
📊 Why Is BTC Holding Up?
One explanation discussed in current Binance coverage is that positioning and selling pressure may already have been reduced after the recent market pullback. Binance News reported that BTC-denominated open contracts had fallen significantly earlier in September, potentially reducing forced selling.
Meanwhile, Bitcoin has been trading near the $78K area, with the $80K–$82K region remaining an important area for traders to watch.
🔥 The Real Test Comes Next:
Holding $78K does not automatically confirm a new rally. The market still faces several variables:
• Federal Reserve policy and future rate expectations
• Bitcoin ETF flows
• U.S. dollar and Treasury yields
• Regulatory developments
• Whether $BTC can regain the $80K–$82K area
CoinShares also noted that the CLARITY Act setback and a more hawkish Fed have created near-term headwinds for Bitcoin.
🚨 Bottom Line:
Bitcoin has absorbed two major macro and regulatory shocks without breaking dramatically lower. That resilience is now becoming one of the key market stories.
The next question is simple:
Can Bitcoin turn $78K into a launchpad — or will $80K–$82K continue to act as resistance?
#Bitcoin #BTC #Crypto #Fed #CLARITYAct #BitcoinSpotETFsNetInflow$159M #HKMAPlansWholesaleCBDCByYearEnd #NEARSurges26%Past$3.45 #BitcoinNews #CryptoMarket #BinanceSquar
Bitcoin Holds $78K After Fed Rate Hike + CLARITY Act Failure
Bitcoin Holds $78K Despite Fed Rate Hike & CLARITY Act Failure — What’s Next?
$BTC is showing unexpected resilience. After absorbing a 25-basis-point Federal Reserve rate hike and the failure of the U.S. Senate’s CLARITY Act vote, BTC has managed to hold around the $78,000 zone.
The bigger story may not be the negative headlines themselves — but Bitcoin’s limited reaction to them.
⚡ Two Major Headwinds Hit $BTC
The U.S. Federal Reserve raised its target interest-rate range to 3.75%–4.00%, marking its first rate increase since July 2023. Higher rates can put pressure on risk assets by keeping financial conditions tighter.
At the same time, the CLARITY Act failed to clear a key Senate procedural vote, receiving 49 votes against 50, falling short of the 60 votes required to advance.
Yet Bitcoin did not experience a sustained collapse.
📊 Why Is BTC Holding Up?
One explanation discussed in current Binance coverage is that positioning and selling pressure may already have been reduced after the recent market pullback. Binance News reported that BTC-denominated open contracts had fallen significantly earlier in September, potentially reducing forced selling.
Meanwhile, Bitcoin has been trading near the $78K area, with the $80K–$82K region remaining an important area for traders to watch.
🔥 The Real Test Comes Next:
Holding $78K does not automatically confirm a new rally. The market still faces several variables:
• Federal Reserve policy and future rate expectations
• Bitcoin ETF flows
• U.S. dollar and Treasury yields
• Regulatory developments
• Whether $BTC can regain the $80K–$82K area
CoinShares also noted that the CLARITY Act setback and a more hawkish Fed have created near-term headwinds for Bitcoin.
🚨 Bottom Line:
Bitcoin has absorbed two major macro and regulatory shocks without breaking dramatically lower. That resilience is now becoming one of the key market stories.
The next question is simple:
Can Bitcoin turn $78K into a launchpad — or will $80K–$82K continue to act as resistance?
#Bitcoin #BTC #Crypto #Fed #CLARITYAct #BitcoinSpotETFsNetInflow$159M #HKMAPlansWholesaleCBDCByYearEnd #NEARSurges26%Past$3.45 #BitcoinNews #CryptoMarket #BinanceSquar
$BTC is showing unexpected resilience. After absorbing a 25-basis-point Federal Reserve rate hike and the failure of the U.S. Senate’s CLARITY Act vote, BTC has managed to hold around the $78,000 zone.
The bigger story may not be the negative headlines themselves — but Bitcoin’s limited reaction to them.
⚡ Two Major Headwinds Hit $BTC
The U.S. Federal Reserve raised its target interest-rate range to 3.75%–4.00%, marking its first rate increase since July 2023. Higher rates can put pressure on risk assets by keeping financial conditions tighter.
At the same time, the CLARITY Act failed to clear a key Senate procedural vote, receiving 49 votes against 50, falling short of the 60 votes required to advance.
Yet Bitcoin did not experience a sustained collapse.
📊 Why Is BTC Holding Up?
One explanation discussed in current Binance coverage is that positioning and selling pressure may already have been reduced after the recent market pullback. Binance News reported that BTC-denominated open contracts had fallen significantly earlier in September, potentially reducing forced selling.
Meanwhile, Bitcoin has been trading near the $78K area, with the $80K–$82K region remaining an important area for traders to watch.
🔥 The Real Test Comes Next:
Holding $78K does not automatically confirm a new rally. The market still faces several variables:
• Federal Reserve policy and future rate expectations
• Bitcoin ETF flows
• U.S. dollar and Treasury yields
• Regulatory developments
• Whether $BTC can regain the $80K–$82K area
CoinShares also noted that the CLARITY Act setback and a more hawkish Fed have created near-term headwinds for Bitcoin.
🚨 Bottom Line:
Bitcoin has absorbed two major macro and regulatory shocks without breaking dramatically lower. That resilience is now becoming one of the key market stories.
The next question is simple:
Can Bitcoin turn $78K into a launchpad — or will $80K–$82K continue to act as resistance?
#Bitcoin #BTC #Crypto #Fed #CLARITYAct #BitcoinSpotETFsNetInflow$159M #HKMAPlansWholesaleCBDCByYearEnd #NEARSurges26%Past$3.45 #BitcoinNews #CryptoMarket #BinanceSquar
84
·
--
#MemeLaunchpads82%OfArcDayOneVolume $BTC ETF Outflows Deepen — $746M Leaves in 2 Days
#MemeLaunchpads82%OfArcDayOneVolume $BTC ETF Outflows Deepen — $746M Leaves in 2 Days
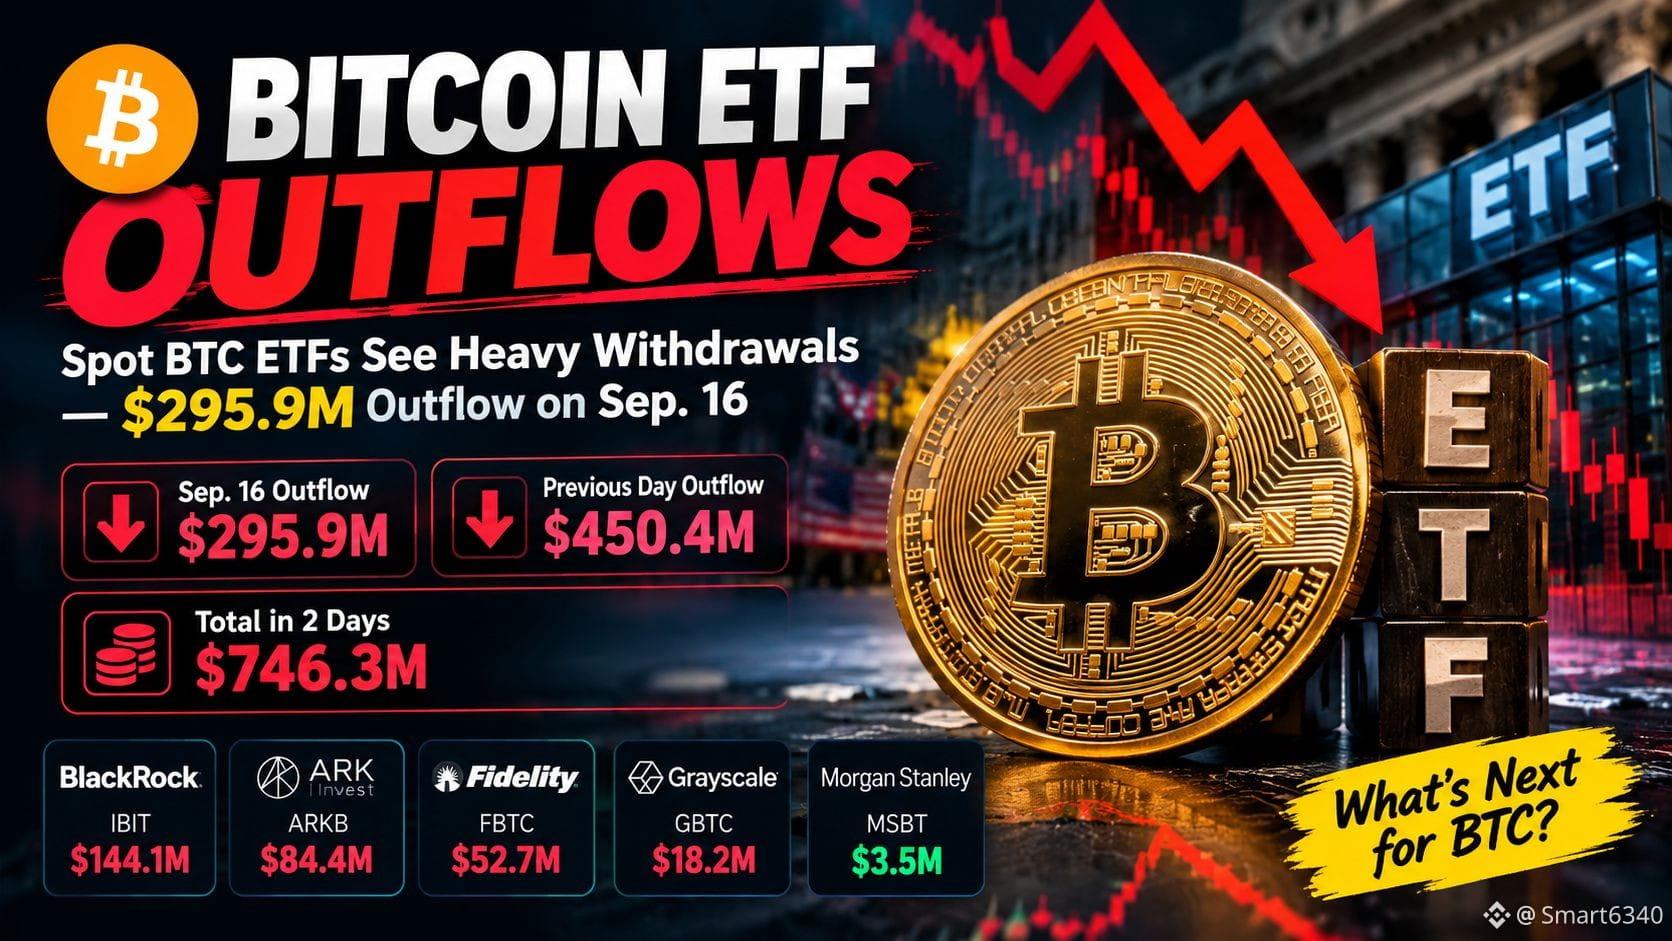
1
69
·
--
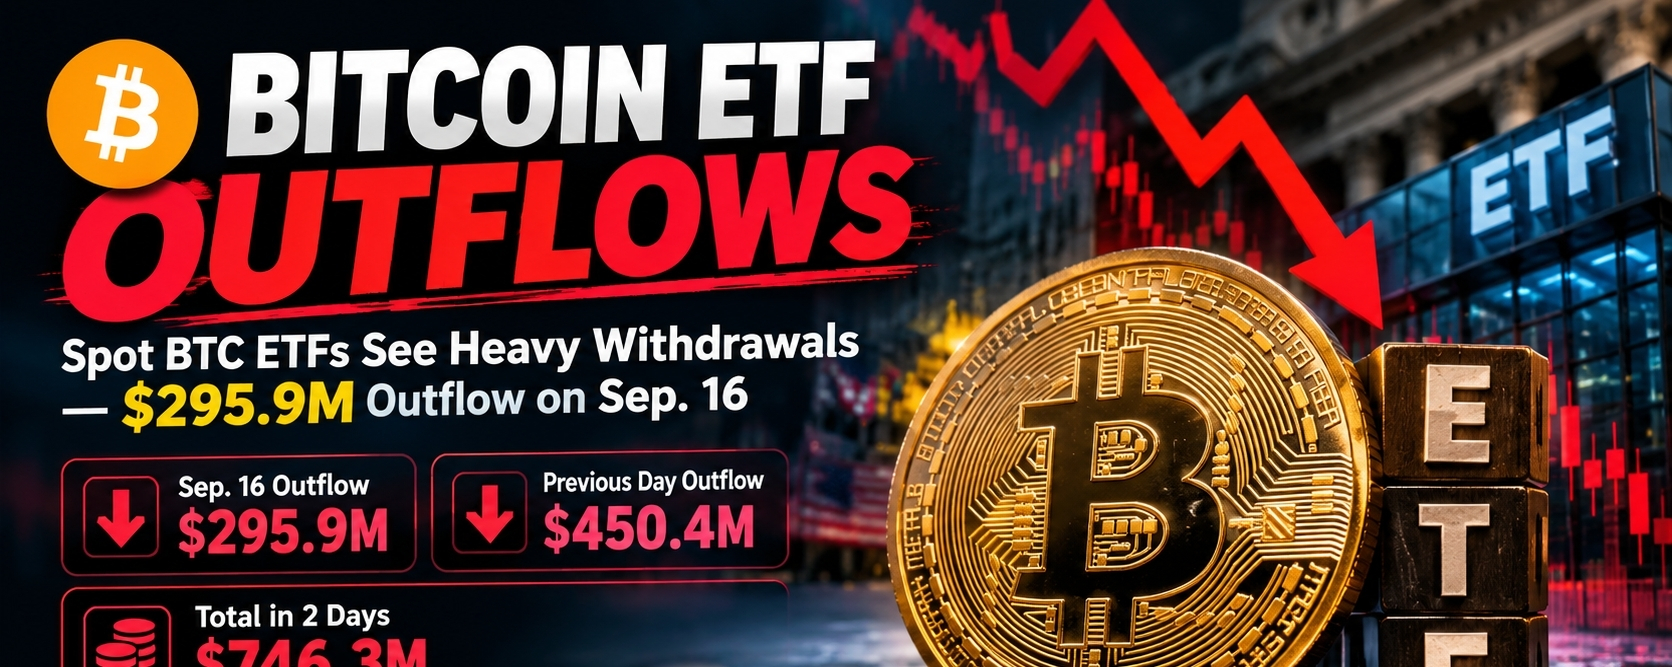
Article
🔥Bitcoin ETF Outflows Deepen — $746M Leaves in 2 DaysBitcoin ETF selling pressure is back.
U.S. spot $BTC ETFs recorded approximately $295.9 million in net outflows on September 16, extending the withdrawal streak to a second consecutive trading session.
The previous session was even heavier, with $450.4 million leaving $BTC ETFs. Together, investors pulled around $746.3 million in just two trading days. �
FinanceFeeds +1
🏦 BlackRock Leads the Latest Outflows:
On September 16, BlackRock’s IBIT recorded about $144.1 million in outflows.
Other major withdrawals included:
ARKB: $84.4M outflow
Fidelity FBTC: $52.7M outflow
Grayscale GBTC: $18.2M outflow
Meanwhile, Morgan Stanley’s MSBT recorded a small $3.5M inflow. �
bloomingbit
📉 Why Does This Matter for BTC?
ETF flows are closely watched because they provide an important indication of demand from investors using regulated spot Bitcoin products.
The latest withdrawals came during a period of broader market pressure, including the failed U.S. Senate procedural vote on the CLARITY Act and heightened attention around Federal Reserve policy. Bitcoin was trading around the $75K–$76K area during the period. �
Reuters +1
However, two days of outflows alone do not confirm a long-term bearish trend. Traders will be watching whether ETF withdrawals continue or whether fresh institutional demand returns in the next sessions.
👀 What to Watch Next:
ETF Flows → Fed Policy → BTC $76K Support → $80K Recovery
If ETF outflows continue, selling pressure could remain an important factor for Bitcoin. On the other hand, a return to strong ETF inflows could signal renewed demand.
The next few trading sessions may reveal whether this is a temporary risk-off move or the start of a longer period of institutional selling.
#Bitcoin #BTC #BitcoinETF #Crypto #CryptoNews #ETF #BTCUSD #BinanceSquare #BitcoinNews #MemeLaunchpads82%OfArcDayOneVolume #FedSEPProjects2026RateAt4.1% #SKPoliceRefer18PolymarketUsersToProsecutors #InstitutionalInvestors
🔥Bitcoin ETF Outflows Deepen — $746M Leaves in 2 Days
Bitcoin ETF selling pressure is back.
U.S. spot $BTC ETFs recorded approximately $295.9 million in net outflows on September 16, extending the withdrawal streak to a second consecutive trading session.
The previous session was even heavier, with $450.4 million leaving $BTC ETFs. Together, investors pulled around $746.3 million in just two trading days. �
FinanceFeeds +1
🏦 BlackRock Leads the Latest Outflows:
On September 16, BlackRock’s IBIT recorded about $144.1 million in outflows.
Other major withdrawals included:
ARKB: $84.4M outflow
Fidelity FBTC: $52.7M outflow
Grayscale GBTC: $18.2M outflow
Meanwhile, Morgan Stanley’s MSBT recorded a small $3.5M inflow. �
bloomingbit
📉 Why Does This Matter for BTC?
ETF flows are closely watched because they provide an important indication of demand from investors using regulated spot Bitcoin products.
The latest withdrawals came during a period of broader market pressure, including the failed U.S. Senate procedural vote on the CLARITY Act and heightened attention around Federal Reserve policy. Bitcoin was trading around the $75K–$76K area during the period. �
Reuters +1
However, two days of outflows alone do not confirm a long-term bearish trend. Traders will be watching whether ETF withdrawals continue or whether fresh institutional demand returns in the next sessions.
👀 What to Watch Next:
ETF Flows → Fed Policy → BTC $76K Support → $80K Recovery
If ETF outflows continue, selling pressure could remain an important factor for Bitcoin. On the other hand, a return to strong ETF inflows could signal renewed demand.
The next few trading sessions may reveal whether this is a temporary risk-off move or the start of a longer period of institutional selling.
#Bitcoin #BTC #BitcoinETF #Crypto #CryptoNews #ETF #BTCUSD #BinanceSquare #BitcoinNews #MemeLaunchpads82%OfArcDayOneVolume #FedSEPProjects2026RateAt4.1% #SKPoliceRefer18PolymarketUsersToProsecutors #InstitutionalInvestors
U.S. spot $BTC ETFs recorded approximately $295.9 million in net outflows on September 16, extending the withdrawal streak to a second consecutive trading session.
The previous session was even heavier, with $450.4 million leaving $BTC ETFs. Together, investors pulled around $746.3 million in just two trading days. �
FinanceFeeds +1
🏦 BlackRock Leads the Latest Outflows:
On September 16, BlackRock’s IBIT recorded about $144.1 million in outflows.
Other major withdrawals included:
ARKB: $84.4M outflow
Fidelity FBTC: $52.7M outflow
Grayscale GBTC: $18.2M outflow
Meanwhile, Morgan Stanley’s MSBT recorded a small $3.5M inflow. �
bloomingbit
📉 Why Does This Matter for BTC?
ETF flows are closely watched because they provide an important indication of demand from investors using regulated spot Bitcoin products.
The latest withdrawals came during a period of broader market pressure, including the failed U.S. Senate procedural vote on the CLARITY Act and heightened attention around Federal Reserve policy. Bitcoin was trading around the $75K–$76K area during the period. �
Reuters +1
However, two days of outflows alone do not confirm a long-term bearish trend. Traders will be watching whether ETF withdrawals continue or whether fresh institutional demand returns in the next sessions.
👀 What to Watch Next:
ETF Flows → Fed Policy → BTC $76K Support → $80K Recovery
If ETF outflows continue, selling pressure could remain an important factor for Bitcoin. On the other hand, a return to strong ETF inflows could signal renewed demand.
The next few trading sessions may reveal whether this is a temporary risk-off move or the start of a longer period of institutional selling.
#Bitcoin #BTC #BitcoinETF #Crypto #CryptoNews #ETF #BTCUSD #BinanceSquare #BitcoinNews #MemeLaunchpads82%OfArcDayOneVolume #FedSEPProjects2026RateAt4.1% #SKPoliceRefer18PolymarketUsersToProsecutors #InstitutionalInvestors
61
·
--
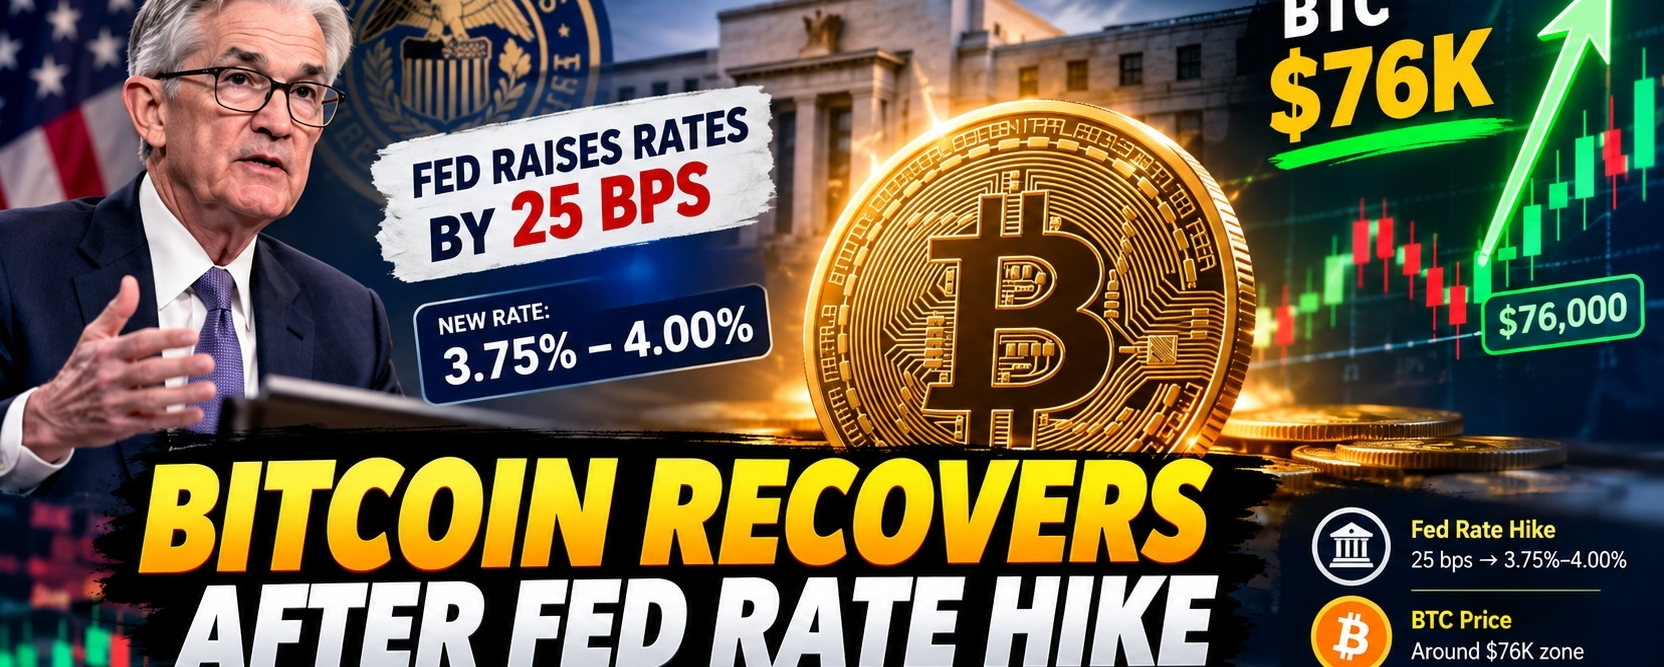
Article
🚨Bitcoin Recovers After Fed Rate Hike — BTC Holds Near $76K$BTC is showing resilience after the U.S. Federal Reserve delivered a 25-basis-point rate hike. Instead of a major sell-off, BTC has remained around the $76,000 zone, keeping traders focused on what comes next for crypto markets.
📌 Fed Raises Rates by 25 BPS:
On September 16, the Federal Reserve raised its benchmark interest-rate target by 25 basis points to 3.75%–4.00%. The decision was unanimous and came as inflation remains elevated above the Fed’s 2% target.
Higher interest rates can generally create pressure on risk assets such as Bitcoin because investors may become more cautious with speculative investments.
But Bitcoin’s reaction has been relatively controlled.
$BTC Holds the $76K Zone:
$BTC traded around $76,000–$76,500 on September 17, with the market absorbing the Fed decision rather than experiencing an immediate sharp breakdown.
This makes the $76K area an important short-term level to watch.
If buyers continue defending this zone, market participants may look for a recovery toward higher resistance levels. On the other hand, renewed selling pressure could put lower support levels back into focus.
🔥 What Comes Next for Bitcoin?
The Fed’s next moves could remain an important catalyst for BTC.
The latest policy signals indicate that monetary policy may remain restrictive, while investors are also watching inflation, Treasury yields, the U.S. dollar and liquidity conditions.
For Bitcoin, the key question is simple:
Can BTC turn the $76K area into strong support after the Fed hike?
The answer could determine whether this recovery develops into a stronger rebound or another test of lower levels.
👀 Key Levels to Watch:
🔹 $76K: Current important support zone
🔹 $78K–$80K: Recovery area traders may watch
🔹 Below $75K: Could increase downside pressure
Bitcoin has once again shown that a Fed rate hike does not automatically mean an immediate crypto crash. Market reaction, liquidity and future Fed expectations will likely remain crucial for BTC’s next move.
#Bitcoin #BTC #Fed #FOMC #CryptoNews #BitcoinPrice #CryptoMarket #BTCUSD #BinanceSquare #OstiumLoanDisputeHearingSetInNYFederalCourt #SKPoliceRefer18PolymarketUsersToProsecutors #FedSEPProjects2026RateAt4.1%
🚨Bitcoin Recovers After Fed Rate Hike — BTC Holds Near $76K
$BTC is showing resilience after the U.S. Federal Reserve delivered a 25-basis-point rate hike. Instead of a major sell-off, BTC has remained around the $76,000 zone, keeping traders focused on what comes next for crypto markets.
📌 Fed Raises Rates by 25 BPS:
On September 16, the Federal Reserve raised its benchmark interest-rate target by 25 basis points to 3.75%–4.00%. The decision was unanimous and came as inflation remains elevated above the Fed’s 2% target.
Higher interest rates can generally create pressure on risk assets such as Bitcoin because investors may become more cautious with speculative investments.
But Bitcoin’s reaction has been relatively controlled.
$BTC Holds the $76K Zone:
$BTC traded around $76,000–$76,500 on September 17, with the market absorbing the Fed decision rather than experiencing an immediate sharp breakdown.
This makes the $76K area an important short-term level to watch.
If buyers continue defending this zone, market participants may look for a recovery toward higher resistance levels. On the other hand, renewed selling pressure could put lower support levels back into focus.
🔥 What Comes Next for Bitcoin?
The Fed’s next moves could remain an important catalyst for BTC.
The latest policy signals indicate that monetary policy may remain restrictive, while investors are also watching inflation, Treasury yields, the U.S. dollar and liquidity conditions.
For Bitcoin, the key question is simple:
Can BTC turn the $76K area into strong support after the Fed hike?
The answer could determine whether this recovery develops into a stronger rebound or another test of lower levels.
👀 Key Levels to Watch:
🔹 $76K: Current important support zone
🔹 $78K–$80K: Recovery area traders may watch
🔹 Below $75K: Could increase downside pressure
Bitcoin has once again shown that a Fed rate hike does not automatically mean an immediate crypto crash. Market reaction, liquidity and future Fed expectations will likely remain crucial for BTC’s next move.
#Bitcoin #BTC #Fed #FOMC #CryptoNews #BitcoinPrice #CryptoMarket #BTCUSD #BinanceSquare #OstiumLoanDisputeHearingSetInNYFederalCourt #SKPoliceRefer18PolymarketUsersToProsecutors #FedSEPProjects2026RateAt4.1%
📌 Fed Raises Rates by 25 BPS:
On September 16, the Federal Reserve raised its benchmark interest-rate target by 25 basis points to 3.75%–4.00%. The decision was unanimous and came as inflation remains elevated above the Fed’s 2% target.
Higher interest rates can generally create pressure on risk assets such as Bitcoin because investors may become more cautious with speculative investments.
But Bitcoin’s reaction has been relatively controlled.
$BTC Holds the $76K Zone:
$BTC traded around $76,000–$76,500 on September 17, with the market absorbing the Fed decision rather than experiencing an immediate sharp breakdown.
This makes the $76K area an important short-term level to watch.
If buyers continue defending this zone, market participants may look for a recovery toward higher resistance levels. On the other hand, renewed selling pressure could put lower support levels back into focus.
🔥 What Comes Next for Bitcoin?
The Fed’s next moves could remain an important catalyst for BTC.
The latest policy signals indicate that monetary policy may remain restrictive, while investors are also watching inflation, Treasury yields, the U.S. dollar and liquidity conditions.
For Bitcoin, the key question is simple:
Can BTC turn the $76K area into strong support after the Fed hike?
The answer could determine whether this recovery develops into a stronger rebound or another test of lower levels.
👀 Key Levels to Watch:
🔹 $76K: Current important support zone
🔹 $78K–$80K: Recovery area traders may watch
🔹 Below $75K: Could increase downside pressure
Bitcoin has once again shown that a Fed rate hike does not automatically mean an immediate crypto crash. Market reaction, liquidity and future Fed expectations will likely remain crucial for BTC’s next move.
#Bitcoin #BTC #Fed #FOMC #CryptoNews #BitcoinPrice #CryptoMarket #BTCUSD #BinanceSquare #OstiumLoanDisputeHearingSetInNYFederalCourt #SKPoliceRefer18PolymarketUsersToProsecutors #FedSEPProjects2026RateAt4.1%
53
Log in to explore more content
Join global crypto users on Binance Square
⚡️ Get latest and useful information about crypto.
💬 Trusted by the world’s largest crypto exchange.
👍 Discover real insights from verified creators.
Email / Phone number
Trending Topics
SECHaltsCryptoETFReviewsAmidFundingLapse
8,368 views
162 Discussing
#SECHaltsCryptoETFReviewsAmidFundingLapse
SEC Halts Crypto ETF Reviews Amid Funding Lapse
The U.S. Securities and Exchange Commission (SEC) has reportedly paused certain cryptocurrency ETF review activities amid a government funding lapse.
This development has created uncertainty in the crypto market, particularly for investors and companies waiting for regulatory decisions on crypto-related exchange-traded funds (ETFs).
Impact on the Crypto Market
The delay could affect the approval timeline of pending crypto ETF applications. Investors are closely monitoring the situation as regulatory clarity remains an important factor in the growth of the digital asset industry.
Although the pause does not necessarily mean that crypto ETF applications will be rejected, it highlights how government funding disruptions can influence financial regulatory processes.
What Happens Next?
Market participants will be watching for updates on government funding and the SEC's ability to resume normal operations.
Crypto ETFs remain an important topic for institutional adoption, market development, and investor confidence.
Conclusion: The temporary halt highlights the importance of regulatory stability for the future of cryptocurrency investments.
#Crypto #Bitcoin #ETF #SEC #CryptoNews #Blockchain #Binance
King2112
·0 Likes
·109 views
ZcashETFPostsFirstWeeklyOutflow$93.6M
56,729 views
173 Discussing
GreekPoliceBustCryptoScamRingArrest17
171,142 views
1,199 Discussing