KOKIM 4758

Verified Creator
Open Trade
High-Frequency Trader
1.1 Years
Juntos somos mais fortes!!!!!!
1.7K+ Following
42.8K+ Followers
41.7K+ Liked
7.9K+ Shared
All
Quotes
Videos
Live
PINNED
See original
❌BINANCE RAISES THE RED FLAG, AND THOSE WHO IGNORE THIS ALERT BECOME LIQUIDITY EXIT
During my manual investigation within Binance itself, upon accessing the Audit tab of the AT/USDT pair, I found a warning that distinguishes those who survive in the market from those who learn by losing money. Binance makes it clear: the token has an Updatable Contract on the Ethereum network. Direct translation, no beating around the bush: the rules can change whenever they want.
An updatable contract means that developers maintain full control to alter functions, parameters, and internal structures. Today it may seem safe, tomorrow it may not be. Binance itself warns that this analysis is not a guarantee of safety, just a reference. In other words, the risk is wide open, not hidden.
This is not an accusation of a scam; it is a brutal reality check: those who enter without understanding the contract agree to play without knowing the rules. Changes can affect transfers, liquidity, fees, or even restrict movements. Binance recommends utmost caution, constant monitoring, and full awareness of the risk before any position.
This text was written, analyzed, and researched exclusively by me, with raw information directly from the source.
✅In crypto, ignoring alerts is not a mistake, it's a choice.✌️
$AT
#altcoins
#binancealert
#CryptoAlert
#CryptoNews
#SmartContract
PINNED
See original
IT'S MY TURN
I am pleased to show the end-of-year gift granted by #Binance as a recognition, I only managed this because of followers and those who follow my posts believed in my posts, believed in my tips, believed in my global market information, so I leave my huge thanks to them, without them, @KOKIM 4758 would not exist.
And I still walk side by side with her, my right arm, my safe harbor @NAPOL
TOGETHER WE ARE STRONGER!!!!!
BIOGRAPHY ON BINANCE!
#BinanceSquareFamily ♥️
#thankyoubinance
#binanceswag
By #kokim4758 ✌️
See original
⚠️ MAXIMUM ALERT: WHAT CAN TAKE DOWN OR EXPLODE YOUR CRYPTO IN WEEK 29/12/2025! ⚠️
The global market enters the last week of 2025 with a macro scenario dominating crypto: central banks have lowered interest rates and expanded liquidity at a historic pace, favoring risk and volatile assets like cryptocurrencies, but pricing in future cuts more cautiously, reducing immediate buying momentum.
Investors will closely monitor decisions from the Bank of Japan and signals of global monetary policy that may alter the flow of capital to crypto this week.
In crypto, the correlation with stocks and S&P500 remains strong in 2025 while sentiment still oscillates between fear and hope, consolidating the outlook that BTC may react strongly to global liquidity but may also suffer during risk retracement moments.
What to expect:
🔥 Global liquidity continues to be the main engine, more money in the markets tends to push Bitcoin and large-cap altcoins up.
Mixed sentiment may keep volatility high in the short term.
Macro data (GDP, inflation, central bank disclosures) may reset quick buying/selling trends.
🕵️♀️Coin to watch: Bitcoin (BTC)👀 remains at the center of the game and should lead upward movements if global easing signals intensify; altcoins may follow, but with greater risk.
The overall trend points to liquidity and correlation with traditional markets as key to the next movement.
$BTC $SOL $ETH
#CryptoMarketAnalysis
#BTC
#altcoins
#crypto
#CryptoNews
Trading Marks
1 trades
BTC/BRL
Bnb
Good night! Claim go#Click fast ret poket #Claim #红包大派送 500U🎁🎁🎁🧧🧧🧧✨✨✨🌿🌿🌿🎁🎁🎁🍀🍀🍀🧧🧧🧧
#PEPE #加密市场观察
#PEPE #加密市场观察
1
$ETH Long time no post, give me a follow I want to reach 20k
{future}(ETHUSDT)
{future}(ETHUSDT)
See original
IF YOU STILL DOUBT FALCON FINANCE, IT'S BECAUSE YOU ARRIVED LATE
While many people are still discussing narratives, Falcon Finance is already operating where serious money plays. Companies watch, capital enters, and the structure grows. It's not a promise, it's execution.
The @Falcon Finance does what few can: it transforms assets into real liquidity without forcing anyone to sell their position. It's pure efficiency. That's why institutional investors pay attention.
ETH here doesn't stay still. It becomes a gear. It becomes a productive base. It becomes a tool to generate income within a system that understands how money really works.
The $FF is not a decorative token. It commands, organizes, governs, and sustains the ecosystem. Those who ignore this usually only realize when the price no longer forgives.
Billions have already passed through the structure. Users spread around the world. Constant expansion. This doesn't come from hype, it comes from engineering and cold vision.
The truth hurts: those who still call this “just another project” haven't understood anything about the game.
#FalconFinance
See original
FALCON FINANCE WAS NOT BORN BY CHANCE — IT WAS BORN OUT OF REVOLT
“Do you remember how it all started?”
“Of course. It was at the end of 2023, when the core team got tired of seeing projects promising financial freedom and delivering nothing but empty hype.”
It was then that the idea of Falcon Finance emerged. The inspiration came from a real pain in the market: lost investors, little transparency, and zero focus on long-term utility. The founding team decided to create something different, an ecosystem designed by those who live the market, not by those who just sell promises.
“We wanted a project that would soar high, but with the radar on.”
“Exactly. That’s how the concept of the falcon was born: vision, precision, and striking at the right moment.”
In 2024, the project began to take shape. Structure defined, tokenomics adjusted, internal tests, and strengthening the community. Each step was built with care, correcting flaws before scaling. No shortcuts. By 2025, Falcon Finance becomes more mature, with active presence, real engagement, and organic growth driven by trust in the ecosystem and in token $FF
“And today?”
“Today, Falcon Finance delivers something that makes the investor's life easier.”
The project simplifies decisions, organizes opportunities, and creates an environment where the investor does not operate in the dark. The FF token becomes the central piece of this system, connecting utility, access, and participation. Less noise, more clarity. Less emotion, more strategy.
“That’s why it’s not possible to be left out.”
“Exactly. Those who ignore Falcon now will chase after it later.”
The @Falcon Finance is not just another project: it is a direct response to the market's failures. And the ($FF ) is not just a token; it is positioning. Those who understand this early will get ahead.
✅Falcon Finance does not ask for attention. It takes it.
#FalconFinance
Trading Marks
1 trades
FF/USDT
See original
FALCON FINANCE DOES NOT NEED A LICENSE: EITHER YOU UNDERSTAND THE GAME, OR YOU FALL BEHIND
What @Falcon Finance has been building is not an empty promise, it is a structure. The ecosystem delivers direct, simple, and functional solutions designed for those who want to operate with efficiency and protection. The project's proposal revolves around real utility, seamless integration, and a model that favors those who participate from the beginning. Security is one of the pillars: verified contracts, audited processes, and publicly discussed analyses widely debated in Binance Square, where no critical risks were identified, reinforcing trust in the project.
The token $FF has been gaining organic traction, increasing visibility and engagement, with a clear trend of strengthening as the community grows. The movement is consistent, without empty hype. Those who follow Binance Square have already noticed that Falcon Finance has stopped being a promise and has become a recurring topic.
This is not advice, it's a reading of the scenario: projects with utility, published audits, and active communities tend to get ahead. Those who understand this early usually pay less. Those who ignore it… buy later.
#FalconFinance
See original
KOKIM X NAPOL
TOGETHER again Live
You can deny
the house is yours
join us 🥰🥰🥰🥰
$BNB $SOL $ETH
#kokim4758
#napol
TOGETHER again Live
You can deny
the house is yours
join us 🥰🥰🥰🥰
$BNB $SOL $ETH
#kokim4758
#napol
NAPOL

--
[Replay] 🎙️ sejam todos bem vindos 🩷
01 h 33 m 57 s · 5.6k listens
See original
PORTFÓLIO NÃO É TORCIDA — É ESTRATÉGIA FRIA E DISCIPLINA
This print shows exactly how I operate: protection first, attack later. Almost 50% in USDT is not fear, it's ammunition. Liquidity to rotate when the market offers real opportunity. SOL remains a pillar, strong, liquid, and with clear flow. The others with small value come in as asymmetric bets, calculated risk, seeking multiplication. Nothing here is random, it's management, cycle reading, and patience. Those who only want pump break.
Those who build structure survive and grow. The market does not forgive emotion, it rewards method.
$SOL $USDT $BNB
#cryptotrade
#CryptoMarket
#NFT
#BinanceSquareFamily
#kokim4758
My Assets Distribution
USDT
SOL
Others
49.49%
19.35%
31.16%
See original
🔥 SUN HAS AWOKEN TO BREAK — WHO SLEEPS STAYS BEHIND
The SUN/USDT chart shows a clear shift of buying strength. The price returned above the short averages, held support, and is now accelerating with strong candles. The short-term trend is BULLISH, with a continuation structure after consolidation. MACD opened positive and the RSI is already pressing a strong zone, showing real flow entering, it is not empty pump.
Trend: Up in the short term
🎯 Entry zone: 123.40 – 124.20
🚀 TP1: 125.30
🚀 TP2: 126.80
🚀 TP3: 129.00
🛑 Stop loss: below 121.90
As long as the price respects the region of the averages and does not lose support, the game remains in the hands of the buyers. This type of structure usually punishes those who wait for "perfect confirmation." The chart is already speaking, now it's cold reading and management.
⚠️ Volatility connected, clean technical movement and open space for expansion.
$SOL
#solana
#sol
#CryptoTrading
#crypto
#altcoins
🎙️ Saturday night live stream on crypto Market $BTC DO YOU RIGHT ▶️

End
02 h 18 m 51 s
7.7k
See original
USA RECOIL, AND THE STAKING BREATHES: THE GAME HAS TURNED!
The debate about the #USCryptoStakingTaxReview has revealed a crack in the US tax system.
The review of taxation on staking rewards shows real market pressure for fairness: it makes no sense to tax something that hasn't even turned into money in hand. This movement reignites institutional confidence, strengthens validators, and gives breath back to the investor who builds in the long term.
The message is clear: the regulatory siege is being reassessed, and crypto is gaining political and economic space again. Those who understand the timing know that when the rules change, capital anticipates. And those who sleep pay the price later.
$BTC $SOL $XRP
#CryptoRegulation
#StakingRewards
#Bitcoin
#Altcoins!
See original
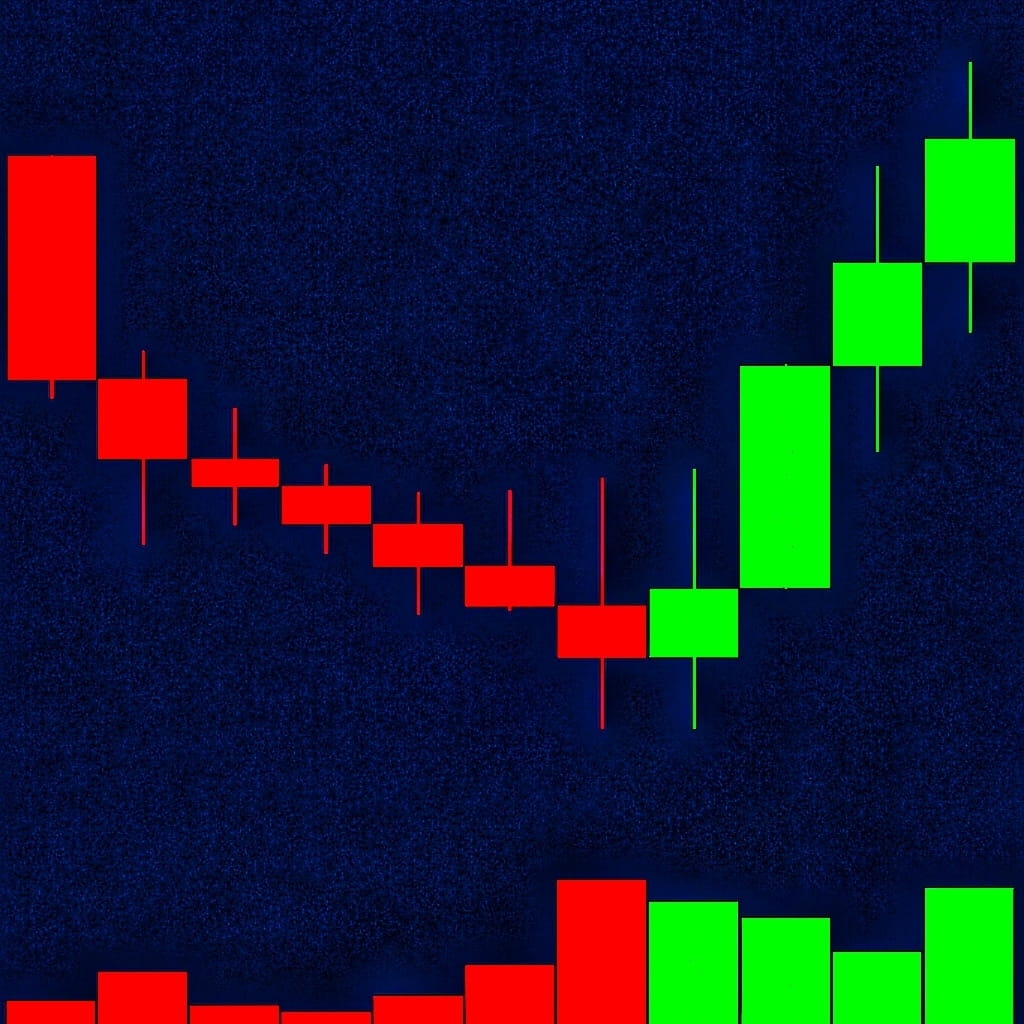
NTRN/USDT has just exploded on the chart and entered total attention mode. The current movement shows a strong breakout from consolidation, with a strong candle above the averages and aggressive volume confirming buyer interest.
The short-term trend is now BULLISH, but already in the overbought region, requiring strategy and management.
Trend: Up in the short term, with a possible technical pullback before a new continuation leg.
The RSI is extremely stretched, which usually generates short corrections before following the flow.
Entry zone (healthy pullback):
• 0.0335 – 0.0318
(Region where the price can breathe without losing structure)
📤 Exit zones / targets:
✅ TP1: 0.0395
✅ TP2: 0.0430
✅ TP3: 0.0485
🛑 Stop loss: below 0.0299
(Loss of this region invalidates the current breakout)
Technical reading:
The breakout came after a long lateral period, with a clear increase in volume and acceleration of the MACD. This type of movement tends to attract late traders, generating strong volatility. Those who enter with criteria can ride the continuation, while those who enter at the top become liquidity.
⚠️ Management is everything. It's not about hitting the top, it's about surviving to catch the next movement.
$NTRN
#NTRN
#cryptotrading
#trade
#altcoins
#BinanceSquare
Login to explore more contents