First of all, for an ordinary person, it should not be difficult to come up with, let alone 20,000 yuan.
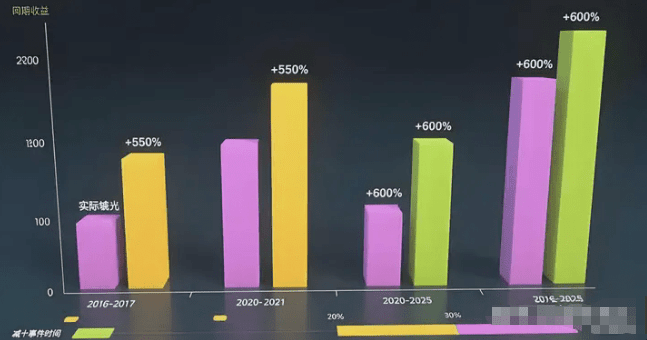
Excluding the earliest players, and calculating based on time that ordinary people can understand, Big Pie has gone through four cycles from 2016 to today.
The price basically increases by 3-6 times in each cycle. Because you cannot buy at the absolute bottom or sell at the absolute top, we can cut off the beginning and end and calculate it as 4 times. 20,000 yuan in 4 cycles can become: 5.12 million.
If the initial capital is 50,000, do you know how much it will become after 4 cycles? 12.8 million.
Look at these numbers, can they help ordinary people turn their lives around?
Okay, here comes the dividing line, and now comes the key point of the problem.
Can ordinary people really be so optimistic about the big pie?
Can you hold on for 8-10 years? It's difficult.
It is not difficult for everyone to be steadfast in the stock market for 10 years, because it is endorsed by the state. The stock market is a legal trading place and anyone can participate legally as long as they have money.
But the cryptocurrency industry is not like that. There is no supervision and no country to endorse it. It is basically growing wildly. Any disturbance will seriously shake the hearts of ordinary people.
Do you really know what his value structure and basic needs are?
The reason most ordinary people are ordinary in the investment market is that the main thing they see is money, that is, the superficial price. They trade based on that price, chasing the ups and downs day by day. Profits are based on luck, losses are based on strength, and in the end they are exhausted.
Bitcoin serves as the anchor of the entire cryptocurrency world. If RWA (Real World Asset) and large-scale on-chain real-world assets become a reality, Bitcoin’s position as an anchor will become even more prominent. Coupled with its inherent scarcity, its position will be stable in the long run.
Can you really hold on to the big pie in the cryptocurrency world?
If you don't understand something, don't touch it. This understanding is very important. If you don't realize that even if you get lucky and get a big pie, you will throw it away at the slightest fluctuation. Basically, you are just gambling with luck.
There are so many temptations in the cryptocurrency world that ordinary people often find it hard to resist. Seeing coins that have increased by dozens or even hundreds of times in value around them, it is hard not to try a few of them. As a result, the first time you get involved, you are doomed. By the time you see it, it is already the end of the crossbow, and you have to buy it.
In the cryptocurrency world, the key is to hold on to the big pie and use all your strength to resist and block all kinds of temptations and interferences, so that you can really achieve the mathematical formula in front of the dividing line.
Assuming you can hold onto the big pie, what is the most important thing in the cryptocurrency world?
Holding Bitcoin does not mean that you can make a comeback in the cryptocurrency world. The most important thing is to store Bitcoin in your own cold wallet. Only the coins in your own wallet are in your pocket, otherwise they belong to others.
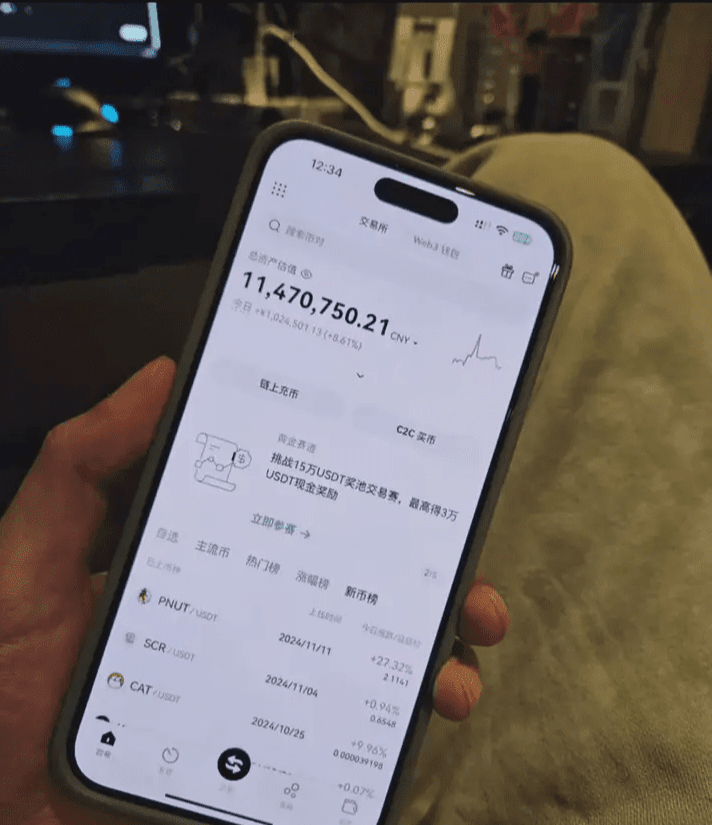
In the past two years, I have spent hundreds of days and nights studying various graphics and charts, summarizing simple and replicable trading methods, and practicing tens of thousands of transactions. My method of cryptocurrency trading is very simple and practical. It took me only one year to make eight figures. I only trade in one pattern and enter the market only when I see the right opportunity. I don’t trade without a pattern. I have maintained a winning rate of over 90% for five years!
My Secret to Wealth: The Simplest and Dumbest Way to Trade Cryptocurrencies (Trend Trading Method)
1. What is a trend?
A trend is the direction of market movement, whether upward, downward, or sideways. It is a regular pattern observed in financial markets (such as stocks, futures, foreign exchange, and currency markets). Changes in buying and selling decisions shape the different forms of trends. Trends always follow the path of least resistance, and identifying trends is essentially finding the path of least resistance. Financial trading experts generally recommend following trends.
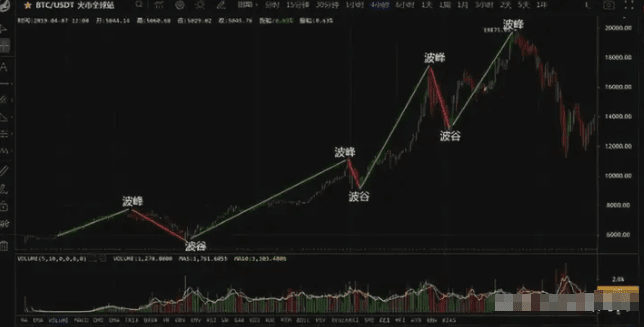
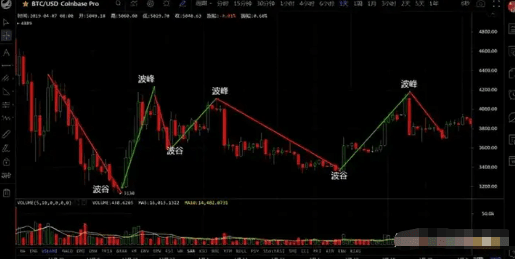
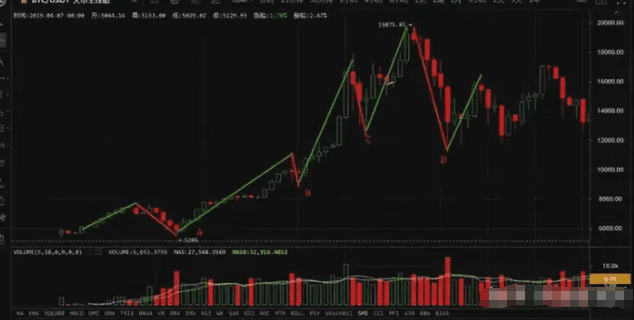
According to Dow Theory, every trend will eventually complete, meaning a bull market is always followed by a bear market, and the cycle repeats. Market prices don't rise in a straight line in one direction; instead, trends follow a continuous wave pattern, with distinct peaks and troughs.
Peaks and troughs are the basic elements that make up different trends. Depending on the location of the peaks and troughs, they can be divided into: rising trends, falling trends, and oscillating trends.
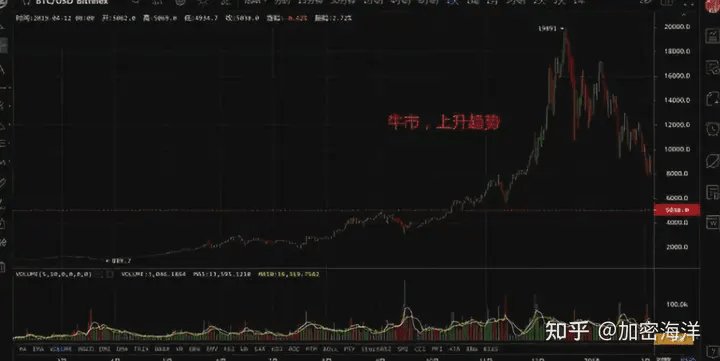
1. Upward trend:
Judgment basis: Both the peak and the trough gradually rise.
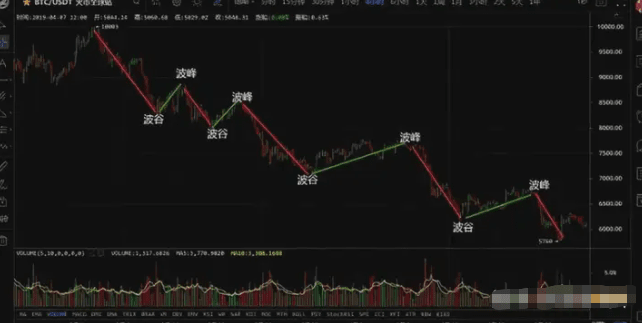
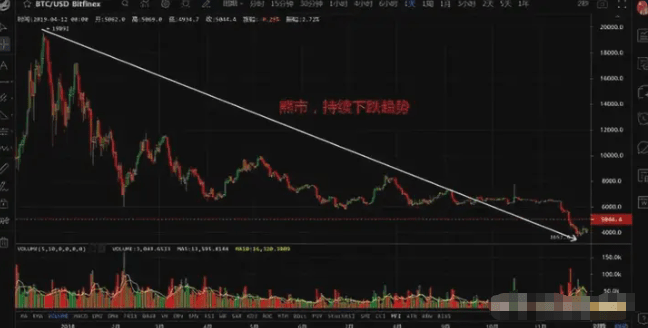
2. Downward trend:
Judgment basis: Both the peak and the trough gradually decrease.
3. Oscillating trend:
Judgment basis: The peaks do not rise regularly, and the troughs do not fall regularly. There is no clear rising or falling pattern between the peaks and troughs. In special cases, the peaks and troughs may be on the same horizontal line.
2. Classification of trends:
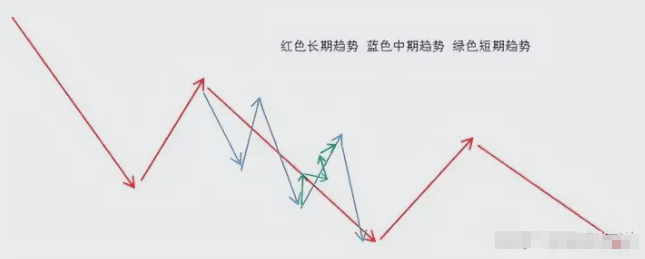
1. According to different time periods, it is usually divided into short-term trends, medium-term trends and long-term trends.
The trend within a few days is called a short-term trend, and short-term trading mainly refers to the cycle.
The trend of several days to several weeks is the medium-term trend, and the mid-line operations mainly refer to the cycle.
A trend that lasts for several months to several years is a long-term trend, and long-term trading mainly refers to the cycle.
Multiple short-term trends make up a medium-term trend, and multiple medium-term trends make up a long-term trend. The bull and bear markets we usually talk about generally refer to long-term trends of several months or years.
2. Types of trends: primary trends, secondary trends and short-term trends (Dow Theory).
① Primary Trend: This represents the overall fundamental trend, indicating a comprehensive rise or fall in market prices, with the longest time span and the largest price increase or decrease. The formation of a primary trend often requires a longer period of time and involves greater capital investment. As long as the next rise exceeds the previous high, or the next fall exceeds the previous low, the overall trend is upward, indicating a bull market. Conversely, a downward trend is considered a bear market. Trends expressed in larger timeframes, such as daily and weekly charts, are more reliable and are less likely to be manipulated by market makers.
② Secondary trend: It is within the main trend and plays an adjusting role in the rise and fall of market prices, also called correction trend.
If the primary trend is bullish, the secondary trend is a downward correction during the upward trend. If the primary trend is bearish, the secondary trend is an upward rebound during the downward trend. The correction range of the secondary trend is generally between one-third and one-half of the primary trend.
③ Short-term trends: These are intraday or smaller periodic fluctuations that are part of a secondary trend. Short-term fluctuations themselves are meaningless, so using them to analyze larger trends can easily lead to erroneous conclusions. Short-term trends are short-lived and easily manipulated, so they are not recommended for ordinary investors.
The major trend is composed of smaller trends, which often obey the major trend. When a trend reverses, smaller trends are more sensitive than the major trend. In any market, these three trends inevitably coexist. Every trend will eventually complete, meaning that a bull market is always followed by a bear market, and the cycle repeats.
Long-term traders are most concerned with major trends: daily, weekly, monthly, etc. Short-term investors are concerned with minor trends and short-term trends.
The type of trend you choose will depend on the type of investor you are.
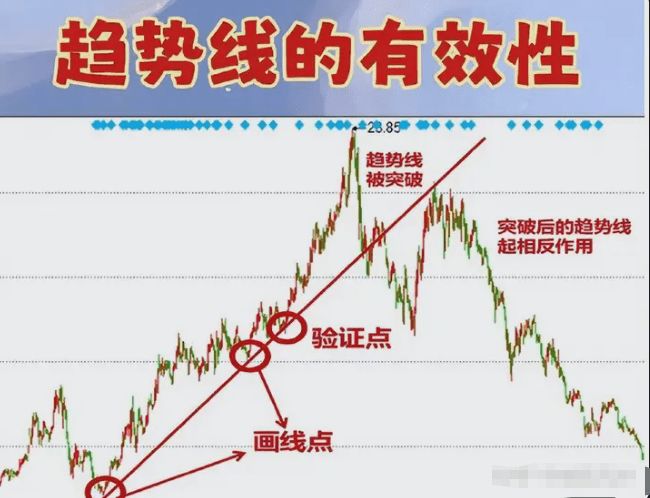
3. How to draw trend lines:
Trend lines can more intuitively show the direction of a trend. They are used to predict future market fluctuations and determine support and resistance levels. The support or resistance of a trend line will eventually be broken, causing a change in price direction.
1. What is a trend line? 2. How to draw a trend line? 3. The purpose of a trend line and what to look out for.
4. Trend end reversal conditions:
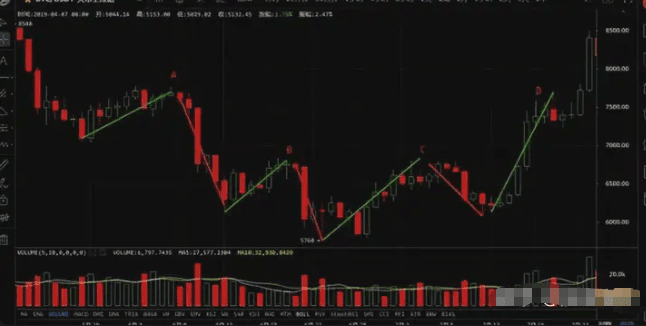
1. During the upward trend, the callback low is lower than the previous low, and the upward trend line ends. As shown in the figure, point D is lower than point C
2. In a downtrend, if the rebound high is higher than the most recent starting point of the decline, the downtrend ends. As shown in the figure:
5. Determine the trend and trade accordingly:
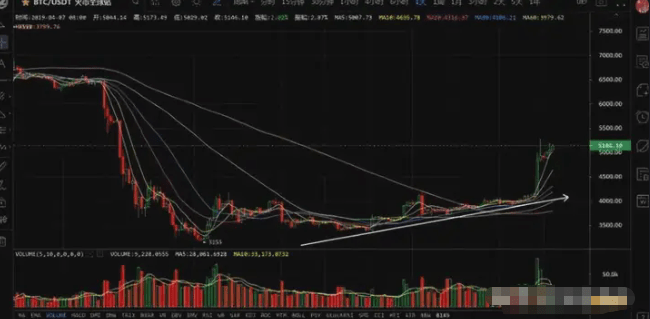
Trend analysis can be divided into major trends and minor trends. The major trend is whether it is a bear market or a bull market, and the minor trend is whether the short-term price is falling or rebounding. If the major trend has likely reached a large bottom and is sideways, and the short-term trend is a small range of fluctuations, you can choose to buy when it is at support.
If the bottom of BTC gradually rises and runs above each moving average, each moving average will gradually move upward, and multiple indicators will show an upward trend.
In addition to the above methods of analysis and trend judgment, it is also necessary to combine various technical indicators such as K-line, volume, moving average, etc. for reference;
Trend indicators include: MA moving average, BOLL indicator, MACD, Fibonacci retracement, etc.
These are historical experiences left behind by the long-term evolution of the financial market, and they are successful historical experiences. Behind them is knowledge of mathematics and psychology. Technical analysis is not speculation or divination of the future, but a summary and speculation of changes in the trading market after a long period of statistics, observation, and review by investment masters.
How to draw Bitcoin trend lines
Drawing a Bitcoin trend line mainly involves the following steps:
1. Identify trend points
Rising trend line: You need to find two consecutive lower high points and draw an rising trend line through these two points.
Downtrend line: You need to find two consecutive rising low points and draw a downtrend line through these two points.
2. Connect the dots and draw lines
Connect the two selected points with a straight line to form a trend line. Make sure the line passes through as many points as possible, but avoid deviating too much from the actual data.
3. Verify the trend line
After drawing the line, observe whether the market behavior conforms to the trend line indication. An effective trend line should play the role of support or resistance in actual operation.
4. Corrections and Adjustments
If market activity indicates that a trend line is invalid, it may need to be adjusted. It is generally recommended to use at least three clear points to determine a trend line for greater accuracy.
5. Analyze the significance
Trend lines are primarily used to assist in analyzing market trends and possible turning points. Correct trend lines can help traders identify price trends and develop trading strategies.
By following these steps, you can draw valid Bitcoin trend lines, which can then be used in technical analysis to predict market movements.
When everyone starts learning trading techniques, they will inevitably come into contact with support and resistance positions.
Support and resistance trading patterns can be broadly divided into two categories:
(1) Trade at the support and resistance levels, and then rebound or reverse.
(2) Breakout trading: after the price breaks through the support and resistance levels, enter the market to continue the trend.
Therefore, how to accurately judge the support and resistance positions is crucial to trading profitability and is also the most basic skill.
Today I will explain to you what I think are the 8 most common and effective methods for determining support and resistance positions. I believe today’s content will be very helpful to you.
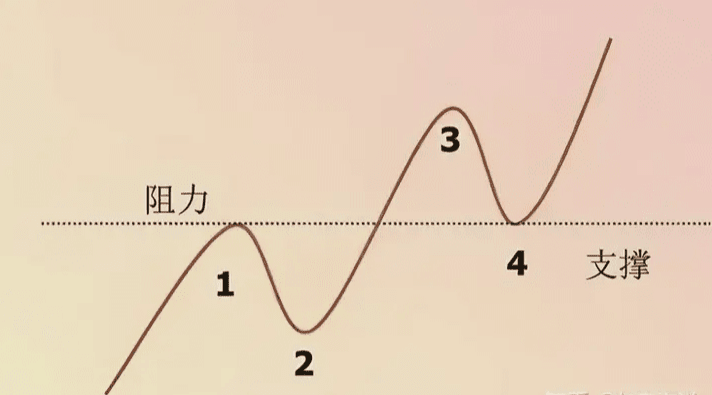
1. What is the support and pressure position?
(1) Support level: refers to the turning point below the current price where the price falls back and encounters support, turning from a decline to an increase.
Look at the picture below. This is the reversal of the support and resistance positions of the market at high and low points.
(2) Pressure level: refers to the turning point above the current price where the price encounters pressure and turns from rising to falling.
Please look at the picture below. This is the reversal of the pullback pressure and support positions in the trend continuation market.
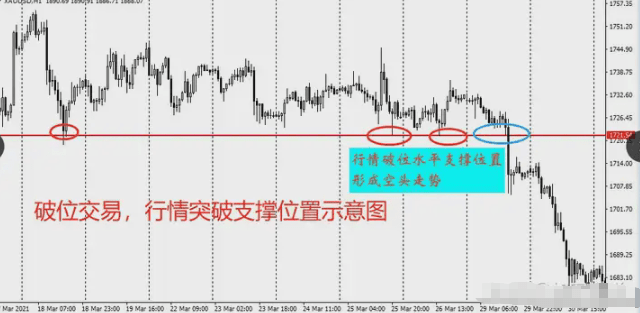
(3) Breakout point: In a breakout transaction, once the market breaks through the support or resistance, the market will continue to move at the breakout point.
Please look at the picture below. This is the trend continuation after the market breaks through the support level.
2. 8 methods to determine support and pressure
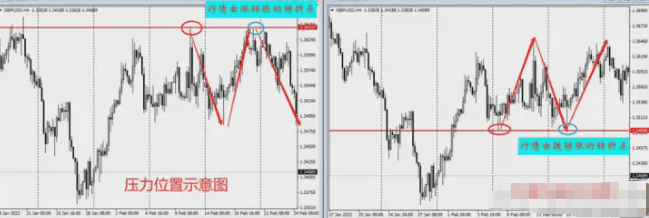
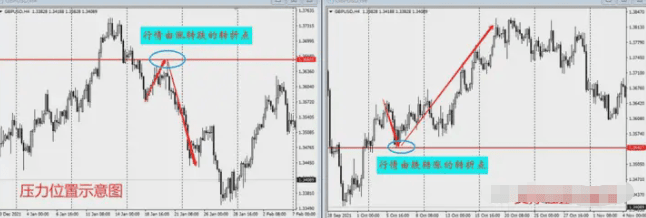
Method 1: Previous highs and lows as support and resistance levels
On the chart, the previous highs and lows of prices are the most common way to determine support and resistance positions.
Please see the diagram below:
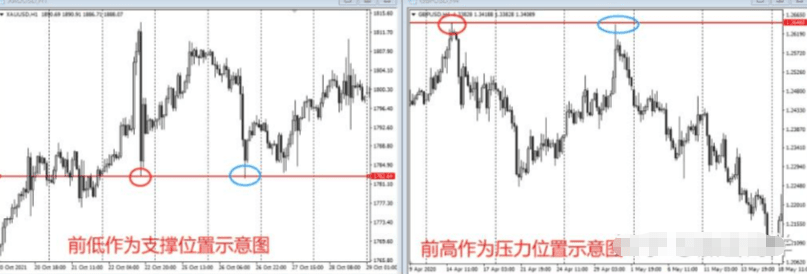
The left side of the picture is the 1-hour K-line chart of gold. After retracing to the previous low support, the price reversed upward.
On the right is the 4-hour candlestick chart of GBP/USD. After testing the previous high pressure upward, the market reversed downward.
Note:
(1) Select obvious previous highs and lows.
(2) You can use the previous highs and lows of large levels for trading, but not small levels. For example, when trading a 1-hour trend, you can use the previous highs and lows of the 4-hour level as support and resistance, but do not use the previous highs and lows of the 15-minute or 5-minute level.
(3) Selecting the previous high and low as support and resistance requires some subjective judgment on the part of the trader. Try to make the judgment when the market is closed or when no positions are held. At this time, traders are relatively calm and objective, and the support and resistance found are more effective. Once determined, do not change it at will.
Method 2: Key prices (support and resistance of price integer levels and historically important prices)
(1) The integers of product quotations usually have supporting and pressure effects.
For example, U.S. crude oil is $100 per barrel, or the Shanghai Composite Index is often hit by the 3,000-point mark.
Let’s look at the diagram:
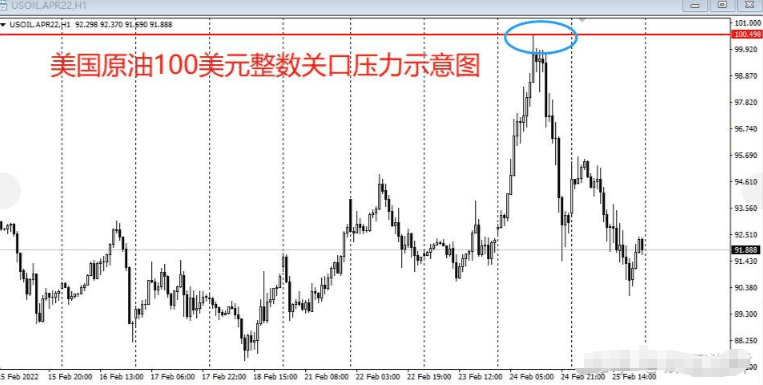
The picture shows the 1-hour K-line chart of U.S. crude oil last week. The price hit a high of 100.49, breaking through the integer mark of $100, and then reversed downward after consolidation.
(2) Historically important prices.
In the market trend of a certain variety, a relatively special and important price has both supporting and pressure effects.
Please see the diagram below:
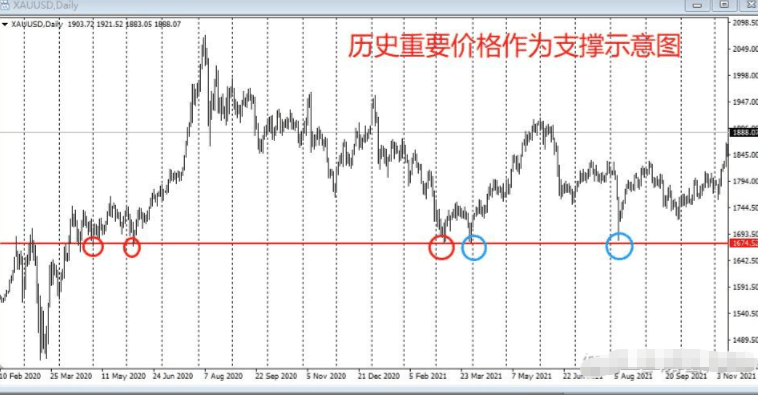
The figure is a schematic diagram of the gold daily line. Affected by the epidemic, the gold price rose to a historical high of 2074, and then fell back to a low of 1676. The market received support at 1676 several times.
Note:
(1) Not all integers have the function of support and pressure. Only important integers can be used.
(2) There are not many trading opportunities at integer thresholds and important historical prices, but once they appear, the success rate is relatively high.
Method 3: Use the moving average as a criterion for judging support and resistance
Moving average is the most commonly used technical indicator. It is used as support and resistance position, and it is also one of the most common ways to use moving average.
When the moving average is below the price, it acts as support.
When the moving average is above the price, the moving average acts as resistance.
Please see the diagram below:
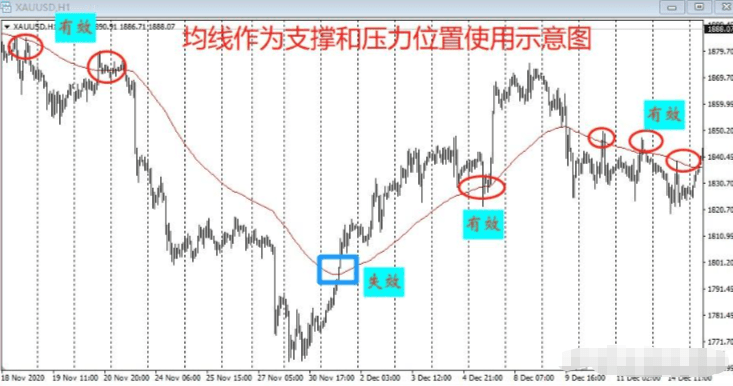
The picture shows the gold 1-hour level K-line, with the moving average EMA90 as a schematic diagram of the support and resistance positions.
Note:
(1) Once you have selected a certain moving average parameter as the standard for support and resistance positions, do not switch it frequently.
(2) The moving average has a big advantage as a standard for judging support and resistance: the moving average is automatically generated on the chart and is clear, obvious and objective, without the need for subjective judgment by traders.
(3) Do not use a moving average with too small a parameter as support and resistance. A moving average with a small parameter is too close to the market, the market changes too quickly, and the trading frequency is too high, which is not conducive to execution. At least use a moving average with a parameter of 30 or more.
Method 4: Trend Line, Channel Line
Trend lines and channel lines belong to the same category of indicators for determining trends.
(1) After the trend line is established, it has a supporting or pressure effect before it is broken through in the opposite direction. The rising trend line has a supporting effect, and the falling trend line has a pressure effect.
(2) The upper and lower channels of the channel line have the function of support and pressure. After the market test, there is a possibility of reversal, which can be used as the basis for opening positions and increasing or decreasing positions.
Let’s look at the diagram:
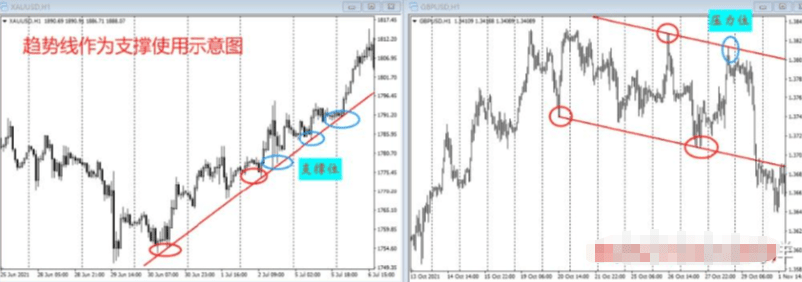
The left side of the picture shows the upward trend of gold at the 1-hour level. After the trend line was formed, the market stabilized and moved upward after several tests.
On the right side of the figure is the 1-hour K-line of GBP/USD. In the blue circle above, the market reversed under the pressure of the upper edge of the descending channel.
Note:
(1) Drawing trend lines and channel lines on a chart requires traders to make some subjective judgments. In actual practice, try to draw lines when the market is closed and no positions are held. After drawing the lines, wait for the market to retrace and try not to make temporary adjustments at will.
(2) Draw lines and trade at this level. Do not use them across levels.
Method 5: Golden Section
There are two ways to use the golden section line as support and resistance.
(1) Golden section return line.
After the market establishes its direction, it will usually retrace to the support or resistance level before continuing to move. 38.2%, 50%, and 61.8% of the golden ratio are the most commonly used retracement positions.
(2) Golden section extension line.
After the golden section is drawn at the high and low points of a market trend, the golden section indicator will automatically calculate the expansion according to 1.618 times, 2.618 times and 4.236 times, and the 1.618 times, 2.618 times and 4.236 times expansion has a support and pressure effect.
Let’s look at the diagram:
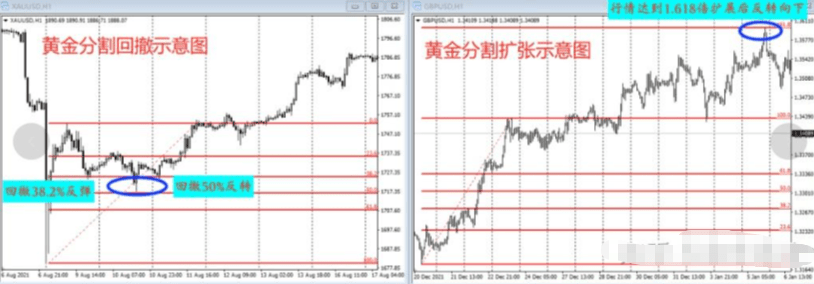
The left side of the figure is a schematic diagram of the golden section retracement. After the market rises and is established, it first retraces to 38.2%. After a brief rebound, it falls again. After testing 50%, a reversal K-line is formed, and the market continues to rise.
The right side of the figure is a schematic diagram of the golden section expansion. After a wave of bullishness is established, after a brief horizontal consolidation, the trend continues to rise. When the golden section expansion reaches 1.618 times, the market reverses downward.
Note:
(1) The golden section extension position is often used as a profit-taking target position.
(2) To draw the golden section retracement line, draw it from the starting point to the end point of the market; to draw the golden section expansion line, draw it from the end point to the starting point of the market.
Method 6: Breaking the upper and lower edges of the consolidation pattern and the neckline
(1) Before a breakout occurs in a consolidation pattern, the upper and lower edges of the pattern act as support and pressure.
(2) After the neckline of the consolidation pattern breaks, the trend may continue, which is an opportunity for breakout trading.
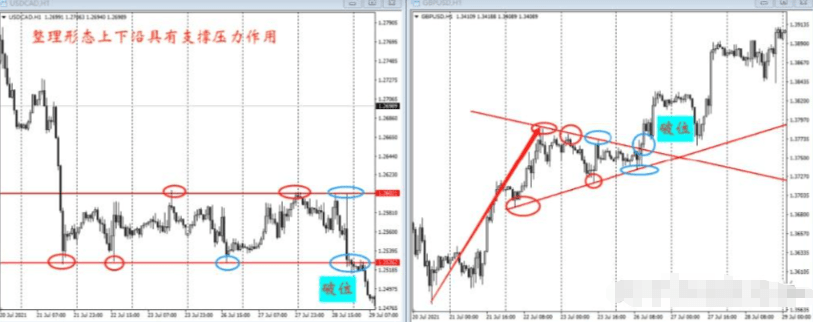
The upper and lower edges of the rectangular consolidation on the left side of the figure formed a reversal trend when the market tested them. The last test below formed a downward break, and you can enter the market to short, and the bearish trend continues.
The right side of the figure is a triangle consolidation pattern. The market tests the downward trend line and the upward trend line of the triangle, both forming a reversal trend. Finally, the market forms an upward break, you can enter the market and go long, and the bullish trend continues.
Note:
(1) If the scope of the consolidation pattern is not large and the profit margin is small, you can only choose to trade in line with the trend. For example, in the triangle consolidation on the right side of the figure, you can only go long at the lower edge of the consolidation pattern and wait for the market to break upward.
(2) The longer the consolidation period, the greater the probability of a breakthrough in the pattern formation, and the position should be increased when trading with the trend.
Method 8: The concept of support and pressure bands
In actual operation, the market will form consolidation fluctuations near the support point or pressure point, or even form a false breakthrough of support and pressure, and many orders will be stopped out by false breakthroughs.
Therefore, it is more stable to understand support and resistance as an area and look for opportunities to enter the market within the area.
There are two scenarios in which support and pressure belts are used:
(1) Near the support and resistance levels, select one or two nearby high and low points as support or resistance zones for trading. See the diagram below.
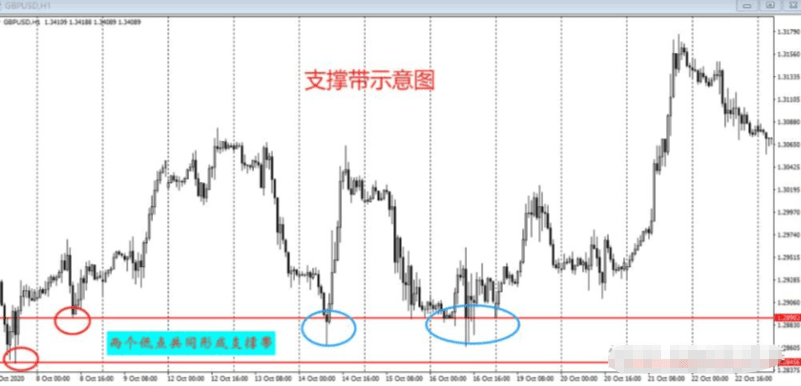
After the market tests the support downward in the figure, select two adjacent previous low points to form a support band. After the market stabilizes in the support band and forms a reversal structure, you can enter the market to trade.
(2) Different indicators for judging support and resistance point to close price areas. These areas can be used as support or resistance zones for trading. Please see the diagram below.
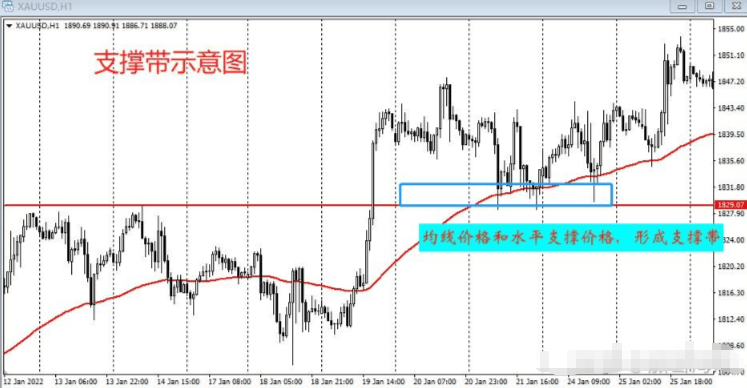
The horizontal support line and moving average in the figure form a support band. The market stabilizes in the support band, forming a reversal structure before entering the market and going long.
Note:
When trading in the support and resistance areas, it is usually combined with the entry pattern, which makes it easier to set stop losses and manage funds.
3. Notes on support pressure
1: Resonance use
(1) Different methods of judging the support and resistance positions are used in resonance, such as the resonance between trend line and moving average, the resonance between trend line and horizontal line, etc.
(2) Combining support and resistance levels with entry patterns or other indicators can be used. For example, a structured entry at a support and resistance level can be formed, or support and resistance levels can be combined with MACD or RSI to create resonance with overbought and oversold indicators.
Note: The resonance of 2-3 indicators is the most common and effective resonance trading.
2: The support and pressure that have been tested multiple times are the most effective
And once there is a reverse breakthrough, the space for operation will be larger.
3: The essence of trading is trial and error, and the effectiveness of all support and resistance is probabilistic.
When using support and resistance levels to form a trading system in actual combat, you must strictly set stop losses and do a good job of position management.
The above is a collection of 7 methods to determine the support and resistance positions. You can choose 2-3 of them to use. Be sure to review and practice before actual use.
In the cryptocurrency world, true experts don't necessarily have to have great technical skills. I have always strictly followed trading discipline. Plan your trades, trade your plans!
Trading is very flexible. Trading discipline only applies to novice traders who have not developed good habits. For veterans, giving themselves too much discipline will only tie their own hands (provided that they do not make principled mistakes).
There are many ways to make money, but the experiences and lessons learned are always the same.
01. Capital usage: Divide your capital into 10 parts, and the risk you bear for each transaction shall not exceed 11/10 of the principal.
The advantage here is that for newcomers, it is a good cost to practice trading. There is no need to worry about the fluctuation of inner feelings with the fluctuation of prices. I suggest that newcomers can divide the funds into 20 parts, and each loss should not exceed 1/20 of the principal.
The market changes every day, so only by keeping bullets can you load them on time.
02. Place a stop-loss order: Set a stop-loss order when opening an order to protect your transaction.
Before placing each order, prioritize risk. If this order goes wrong, where should I place my stop loss? If I open a position here, where should I place my stop loss?
Among the traders I know who have more than ten years of trading experience, there is no one who opens a position without setting a stop-loss. If you want to learn how to fight Sanda, you must first learn to be beaten.
Being wrong isn't a big deal; it's part of the cost of trading. What's scary is not setting a stop-loss order. One wrong trade won't cover your 10 winning trades. The confidence built up from those first few profitable trades will instantly crumble, and you'll start to doubt and question yourself.
Another aspect is that if you want to do your job well, you must first sharpen your tools. As a professional trader, you must do a good job of the basics. Just like a killer, when you prepare to open a position (hunt for a target), you will do a lot of preparation in advance, such as the target's habits, the time of day when he passes by and which street, his daily schedule, and the most repetitive daily activities, so as to develop a detailed hunting plan. Then, how should I disguise myself? Where should I shoot? After the shooting, which route should I retreat? How much time do I have to retreat?
So, this is something you have to consider. There is no sympathy in a zero-sum market. Either you hunt others or you become someone else's prey, so you have to be responsible for your own capital.
03. Do not over-trade, which will violate your fund management principles and cause capital loss.
It is better to leave it to quantitative robots or grids, which are more rational and mechanized than humans.
04. Don’t let floating profits turn into losses. Once there are floating profits of more than three points, set a protective stop loss near the opening price and never lose your principal.
In the cryptocurrency circle, it is easy to rise by more than three points, especially for small copycat stocks. At this time, you can slightly enlarge your take-profit position, adopt a moving take-profit method, and make a protective stop-loss by the way. Especially in a bull market, frequent take-profit is a must. Only in this way can you protect your profits from being taken away.
Normal people can’t stand the floating profit state. They are originally happy and have started thinking about what to do with the profit money and what to buy. But not long after, the floating profit turns into floating loss. It’s a feeling of going from heaven to hell. People with weak mental strength can’t stand it. Emotions are easily affected, which will affect your decision-making and judgment ability, and induce you to make some stupid decisions. When you come to your senses, you find that the account funds are basically clear, and you regret it.
05. Don’t fight the trend. If you are not sure which way the trend is, don’t trade.
You're not a god, the invisible hand manipulating the market, or even a master manipulator. So be honest and give up the illusion that you're destined to succeed. Follow the trend, don't try to be a mastermind. If you can't tell where the trend is headed, stop, relax, and spend time with family and friends. Don't gamble or guess. Opportunities abound; there's no need to rush.
06. If in doubt, leave and wait and see.
If you can't see which way to go, then don't force it. The market is not yours, and no one will pity you.
07. Only trade active stocks and stay away from stocks with poor liquidity.
Why would you touch a currency with a daily trading volume of only a few M? Why not trade something with good liquidity?
08. Diversify your risks and trade multiple stocks instead of putting all your eggs in one basket.
The founder, J.M. Livermore, was a great trader. He also went bankrupt several times because of his desperate bets. So do you want to learn from him? If you go bankrupt once, will your mentality be defeated? Do you have the trading skills and market insights of the founder? Do you still have the capital to continue to bet everything? If not, then please don’t dream honestly. But in the cryptocurrency circle, it is not like stocks. It is recommended not to hold some junk altcoins. It is better to allocate funds to BTC and ETH.
9. Don’t just use limit orders. Sometimes you need to be flexible and enter the market at the market price.
Sometimes when breaking through a major resistance or falling below a major support, the market will accelerate. If you rigidly place a limit order, you may not be able to enter the market and need to respond flexibly.
10. Do not open orders without sufficient reasons. Use a moving take-profit to protect profits.
I spent 800 on food today. I spent 2K to find a technician today. I spent 20,000 on business today. I spent 80,000 on a watch today. I spent 500,000 on a car today. These are not reasons for you to open a position. If you open a position with these reasons, believe me, quit this circle as soon as possible, otherwise you will be penniless.
11. Accumulate surplus. If the transaction goes smoothly, you can transfer part of the profit to a reserve account for emergency use.
Trading is work, not life, so withdraw some profits in time to prepare for your emergency needs. This will give you the opportunity to make mistakes without having to beg others for help.
12. Don't buy stocks just for the dividends.
Never buy a coin just because of airdrops/staking.
13. Never amortize your costs. This is the biggest mistake a trader can make. (Amortize your costs: buy low and keep adding to them.)
The ICP of 500 dropped to 100 and you thought it was very cheap, so you increased your position. When it dropped to 50, you thought it was even cheaper, so you increased your position again. When it dropped to 20, you thought it was a once-in-a-lifetime opportunity, so you went all in. Now, all you can do is cry.
Admit your mistakes and stand at attention when you are beaten.
14. Don’t enter the market because of impatience, and don’t leave the market because of lack of patience.
You must be like a cheetah, act at the right moment, waiting is your weapon, and patience is your claws.
15. Don’t make small profits and big losses.
It's like playing baccarat. One day I go in and win 500 with a 1200 chip bet. Satisfied, I withdraw. The next day I win another 500, and I withdraw again, feeling elated. But on the third day, things don't go so smoothly. I go in and lose 500. Not content with that, I keep gambling, hoping to recoup my losses. I bet 500, but I lose, losing 1000. All the profits from the previous two days are gone. Still not satisfied, I keep gambling, throwing in 500 and 1000 chip bets at random, only to lose 10000. This is a classic example of winning every time and losing every time.
Every time you open an order, you take risks and only make a small profit, which may not even reach your take-profit level or your protective stop-loss level, and you leave the market, feeling happy. If you lose, you will fight to the death, even until your position is liquidated. Then you are not suitable for investment trading, let alone gambling. Casinos like people like you, because you will not be so lucky every day and win a little bit, a few hundred dollars every day, but when you are unlucky, you will lose a lot and dare to place big bets, and lose tens of thousands of dollars. This is a non-food, the dealer's favorite non-food.
16. Once the stop loss is set, it cannot be cancelled at will.
Stop loss is something you should think about before opening an order. Do not cancel your stop loss unless something serious happens.
18. Be willing to go long and also be willing to sell short, and let your transactions be consistent with the trend. This is the way to make money.
You should be as willing to go short as you are to go long. Not being biased towards either side is an essential psychological quality for a trader, so that you can make neutral and objective judgments.
19. Don't buy just because the price is low, and don't sell short just because the price seems too high.
What is low will get lower, and what is high may get higher. These are not reasons for you to go long or short.
20. Don’t hedge if your position is wrong. If you are long on a stock and it starts to fall, don’t open a short position to hedge. You should stop loss and exit the market and wait for the next opportunity.
If you make a mistake, you make a mistake. If you ejaculate, you ejaculate. Replenish your body and move on to the next one.
21. Never change your trading plan without a good enough reason. You must have a sufficient reason to make a transaction and execute it according to the established plan. Do not leave the market easily before the trend reverses.
Trust your own judgment. If you are wrong, it is wrong. Learn from the lesson. The most important thing is to remember it.
22. Don’t increase your position just because you make money.
Making money within a period of time does not mean that your skills are good, it may be that you are lucky, so give yourself more time. You can think about increasing your positions only when you are profitable for a long period of time. Otherwise, the money earned by luck will most likely be lost again due to your excessive self-confidence.
I am Axin. If you don’t know what to do in a bull market, click on my avatar and follow me. I will share the bull market spot planning and contract password for free.

