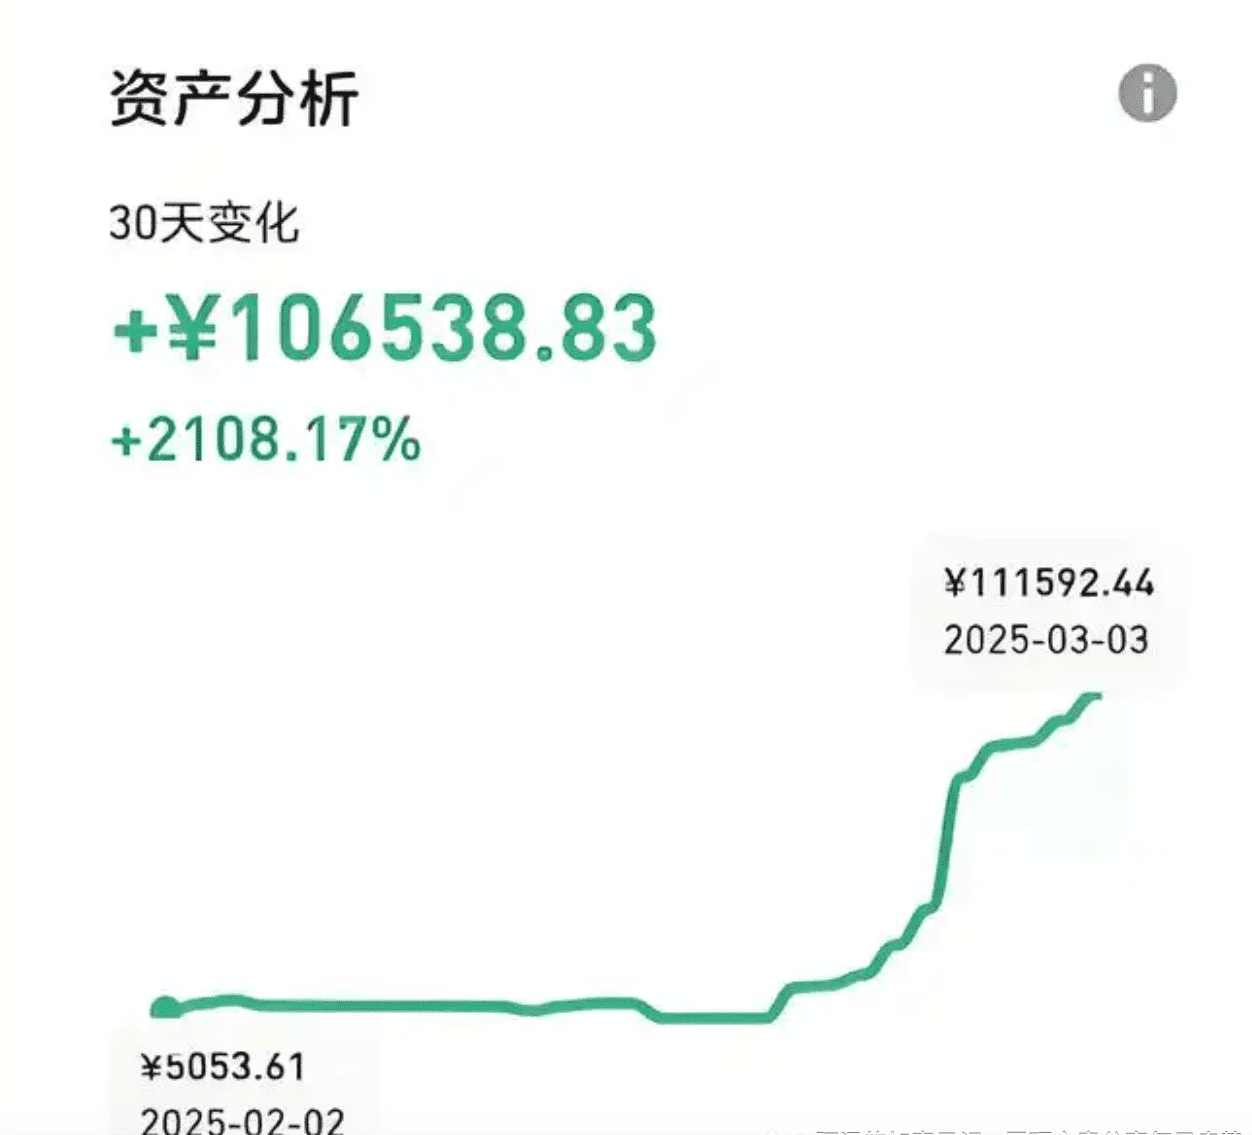
This article is not 'feel-good nonsense' or 'theoretical guidance that sounds good on paper', but rather a practical summary based on my personal practice of the rolling strategy with ten accounts over the past three months, during which the highest monthly return rate soared to 2100%.
However, the liquidation risk of this strategy is also very high, exceeding 80%.
If you just want to blindly follow trends, then you can exit the page now;
But if you are willing to rigorously follow the strategy, perhaps you can join the ranks of the 20% successful people.
Essence of the strategy: Rolling positions - ignite the 'compound interest bomb'
The key to rolling positions is not to endlessly increase the position, but to 'increase the position when profitable and stop loss when losing', using the power of compound interest to let profits accumulate like a snowball.
But 90% of people die in these 3 pits:
1. Afraid to increase positions when profitable (missing explosive market conditions)
2. Loss holding on (eventual liquidation)
3. Wrong selection of targets (poor liquidity, spike)
The core of my strategy: '3x leverage + dynamic profit-taking + hedging protection', which prevents profit reversals while allowing you to capture trending movements.
Target selection: BTC/ETH exchange rate hedging (stable volatility, not prone to spikes)
Opening Strategy:
When BTC pulls back to a key support level (such as 60,000), open a 3x long position.
After the first profit of 20% (200U), roll 50% of the profits into the next order.
Stop loss: Immediately close a position if it breaks the previous low (control loss within 10%)
Key details:
Only operate between 1-3 AM Beijing time (best liquidity, less control by market makers)
Use limit orders + take profit/stop loss to avoid slippage.
Phase 2: 3000U → 8000U (10-12 days)
Target Upgrade: High-volatility altcoins (such as SOL, ORDI)
Rolling technique:
Wait for a breakout above key resistance levels, then chase with 3x leverage.
After a profit of 30%, take partial profits and set a trailing stop for the remaining position.
If you incur two consecutive losses, stop trading for the day.
Risk control:
Absolutely do not touch low liquidity coins (easy to be harvested).
After each trade, withdraw 10% of profits to a cold wallet (to prevent over-trading)
Phase 3: 8000U → 20000U (Final Sprint)
Ultimate Strategy: Combination of Contracts and Spot Trading
70% of funds are used for BTC/ETH trend trades (5x leverage, capturing large swings).
30% of funds should be allocated to low-market-cap, high-potential coins (such as certain exchange IEO coins, specifics can be discussed privately).
Set automatic profit-taking (lock in part of the profit every 10% increase)
Last line of defense:
When total funds reach 15,000U**, withdraw the principal and only use profits for speculation.
If you encounter extreme market conditions, immediately switch to stablecoin arbitrage (annualized 20%+, for survival).
Why do 90% of people fail?
1. Emotional loss of control (profit expansion, loss holding on)
2. Leverage abuse (blindly opening 10x, 20x)
3. Ignoring time windows (missing the best trading periods)
My solution:
Use quantitative trading bots to execute automatically (to avoid manual operation errors)
Set a strict stop-loss discipline (stop trading if daily loss exceeds 10%)
Regularly take profits (to prevent 'paper wealth')
This method is also one I have personally tested: from February to March 2025, within a month, I earned 100,000 from 5,000! A profit rate of 2108.17%!
The amount of leverage in the crypto contract depends on the following conditions:
1 Your risk tolerance
2. The cryptocurrencies contracted
3. Size of the contract fund
4 Are you doing simple interest or compound interest?
5. Determine the size of the market.
Next, I will introduce two methods of position management!
1. Left-side position management
1) Do not use all your bullets at once; buy in batches!!!
2) You can divide the funds into several parts. When you are unsure about the bottom, buying in batches is the most suitable method to average the cost price!!!
(3) Bottom-fishing needs to be handled flexibly according to market conditions. Do not over-frequent averaging down, as it will have a negative effect on averaging the coin price. Entering 20%, 30%, or 50% is suitable for aggressive investors who love to catch bottoms!!!
(4) Initial entry amount is relatively small, if the price does not rise and continues to fall, gradually increase the position, with the increasing ratio getting larger, thus averaging down the cost. This method has a relatively small initial risk; the higher the funnel, the more substantial the profit!!
2. Right-side position management
(1) Buy 1: When the 5-day moving average crosses above the 10-day moving average, increase the position by 30!!
(2) Buy 2: The price effectively breaks through the life line. When it retests the life line, continue to increase the position by 30 to ensure that the total position in the early stages of the upward trend reaches 60%!
(3) Buy 3: Break through the neckline or other important resistance levels, then retest and stabilize, indicating that the reversal pattern is established, and increase the position by another 20%. The total position should reach 80%, hold the coins and wait for the rise!!
(4) Buy 4: When the price is above the life line and a golden cross appears between the 5-day and 10-day moving averages, it is a typical signal to accelerate the upward trend. At this time, you should buy the remaining 20% of your position in a timely manner to maximize profits!!!
Foolproof trading in cryptocurrencies, simple and practical. Even if you are a new trader, you can operate easily, with an accuracy rate of over 80%. Both buying and selling in the crypto world can follow this method!
1. The selected coin must be in an upward trend; of course, it can be in a consolidation phase, but it must not be in a downtrend or have the moving averages opening downward.
2. Divide the funds into three equal parts. When the price breaks through the 5-day moving average, lightly buy 30% of your position. When the price breaks through the 15-day moving average, buy another 30%. Similarly, buy the last 30% when breaking through the 30-day moving average. This requirement must be strictly executed.
3. If the price does not continue to break upward after breaking the 5-day moving average, but instead shows a pullback, as long as it does not break the 5-day line, maintain the original position. If it breaks, sell.
4. Similarly, if the price breaks through the 15-day moving average but does not continue upward, hold if it retests without breaking the 15-day moving average, sell 30% if it breaks, and if it does not break the 5-day moving average, continue to hold the 30% position on the 5-day moving average.
5. When the price continues to break through the 30-day moving average and then retests, sell in one go as before.
6. Selling is the opposite; when the price is high, if it breaks the 5-day line, sell 30% first. If it does not continue downward, hold the remaining 60% position. If the 5, 15, and 30-day lines all break, sell everything. Do not be overly optimistic.
A trading system is a tool that allows you to achieve stable profitability.
It can help you mark key levels, discover entry signals, and find trading opportunities that can make you money.
So, that being said, as long as you have a stable trading system, just act on the opportunities within the system. If you lose, so be it; focus on doing your part well, and leave the rest to the market. In the end, profits will always cover the losses.
However, 99% of people's main problem is that they do not have their own trading system, so they are afraid of losing money when trading, because once the money is lost, it cannot be recovered. Even if they make it back by luck, they will eventually lose it all by skill.
There is a stupid method for trading cryptocurrencies that allows you to maintain 'ever-profitable' status, making 30 million! This method has achieved an 80% win rate! The top 10 chart patterns you must know can accurately predict market trends. Once you learn to master them, the crypto world will be your 'ATM'.
Chart patterns are one of the most effective trading tools for traders.
They purely reflect price behavior, formed naturally by buying and selling pressures from both bulls and bears. Chart patterns have a proven reliable record, and traders often use them to identify trend continuations or reversal signals, open positions, and predict price targets.
Chart patterns refer to specific price formations on charts that can predict future price movements.
Since technical analysis is based on the fundamental assumption that 'history will repeat itself', these classic patterns often verify high-probability rules after specific price patterns.
Thus, chart patterns can be divided into:
(1) Continuation patterns—indicating that the existing trend will continue;
(2) Reversal Patterns—indicating that the trend is about to reverse.
This article will showcase the top ten classic chart patterns that traders must know. The first part will detail reversal patterns and their application methods.
Reversal Patterns (Part 1)
Head and Shoulders Pattern
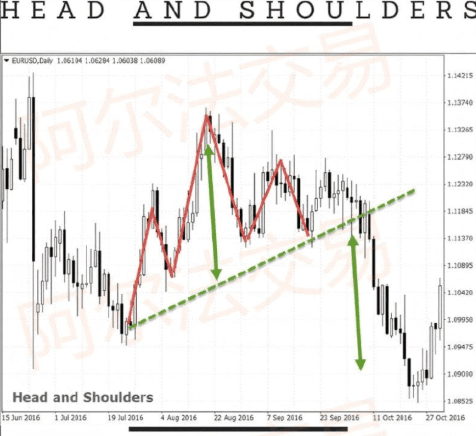
The head and shoulders pattern is a classic chart pattern indicating that the current trend is about to reverse.
This pattern consists of three peaks (high points), with the middle peak (head) being the highest (marked by the red line in the chart).
When the second highest point appears after the middle peak, it indicates that the bulls have no strength to push the price higher. Its shape resembles the head outline with left and right shoulders, hence the name.
A straight line connecting the low points of both shoulders is called the neckline.
Important notice: When the price breaks down through the neckline, it is a sell signal. The target price is the vertical distance from the head peak to the neckline (marked by the green arrow).
If the head and shoulders pattern appears in a downtrend, it is called an inverted head and shoulders pattern (composed of three troughs).
Double Top and Double Bottom
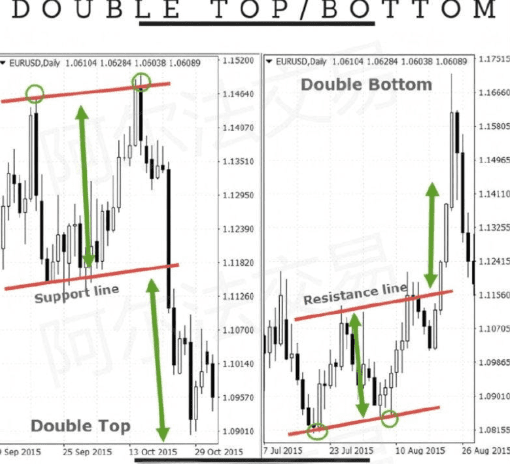
As another type of reversal pattern, double tops and double bottoms appear in upward and downward trends, respectively.
As the name suggests, a double top consists of two peaks that are close in height (or slightly different). It indicates that bulls failed to break through the previous high, and the trend may reverse.
Important notice: When the price breaks through the support line of the pattern, it triggers a sell signal, with the target price being the vertical distance from the peak to the support line.
The double bottom pattern is the opposite, consisting of two troughs. It shows that bears cannot continue to push prices lower. Buy when the price breaks through the resistance line, with the target price being the vertical distance from the trough to the resistance line.
Triple Top and Triple Bottom
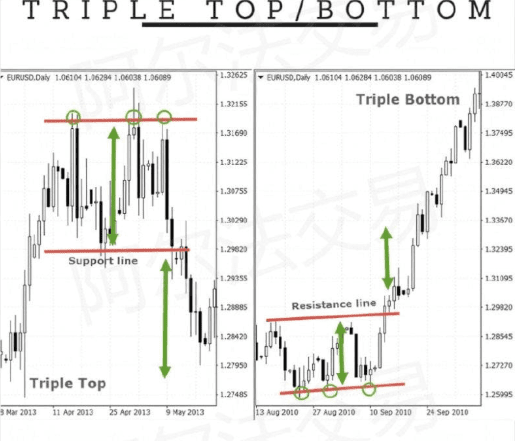
Triple Top/Bottom patterns are essentially extensions of double top/bottom patterns. Both are reversal patterns, with the difference being that triple tops/bottoms each contain three peaks and troughs.
Important notice: Trigger signals are also breakthroughs of support/resistance lines. The target price calculation method is: triple top is the vertical distance from the peak to the support line; triple bottom is the vertical distance from the trough to the resistance line.
Rounding Top
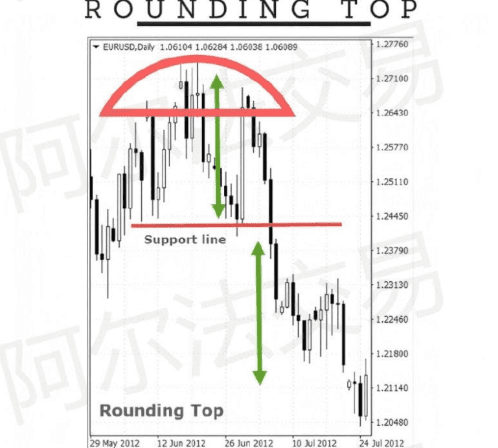
The formation cycle of the rounding top pattern is longer than other patterns in this article. It reflects the gradual transition of market sentiment from a bull market to a bear market. As shown in the chart, the price gradually constructs a 'rounded top' outline.
Important notice: When the price falls below the support line, a short signal is triggered, and the target price is the vertical distance from the peak to the support line.
Round Bottom
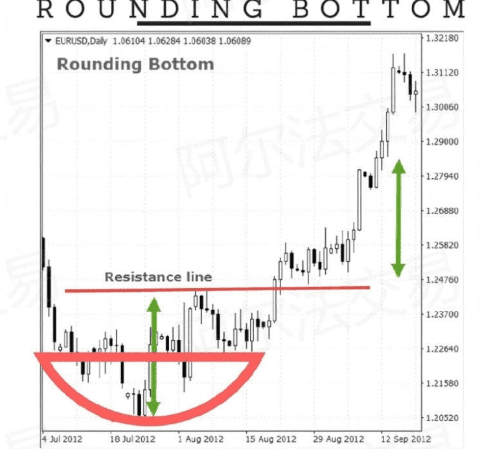
The rounding bottom is the mirror image of the rounding top. The price completes the gradual reversal of the downtrend through the 'rounded bottom' structure.
Important notice: The trading signal is the same as for the rounding top—triggered by a breakout through the resistance line, with the target price being the vertical amplitude from the bottom to the resistance line.
Continuation Patterns (Part 2)
This article will reveal the most classic continuation patterns. Continuation patterns are as important as reversal patterns and are more suitable for trend-following trading strategies. If reversal patterns are suitable for contrarian traders and swing traders, then continuation patterns can provide quality entry points for trend traders. The following patterns will open a new perspective on trading for you.
Rectangle Pattern
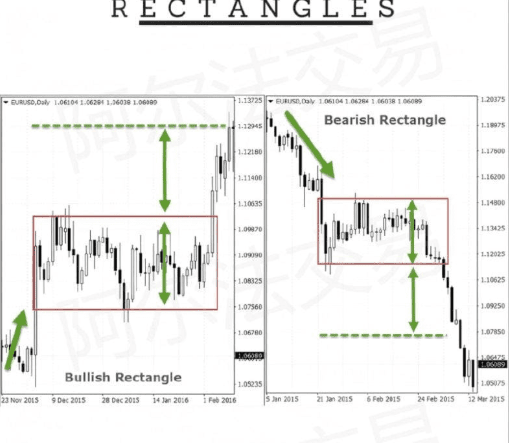
Rectangles belong to continuation patterns and confirm that the current trend will continue. They can be divided into bullish rectangles and bearish rectangles based on the trend direction.
The bullish rectangle appears in an uptrend and is formed when the price enters a consolidation phase. It is likely to break through in the original trend direction.
Important notice: When the price breaks through the upper boundary of the rectangle, it triggers a buy signal, and the target price is the height of the rectangle.
The bearish rectangle follows the opposite rule, forming in the consolidation phase of a downtrend, indicating that the price will eventually break down through the lower boundary of the rectangle. The target price amplitude also takes the height of the rectangle.
Wedge Pattern
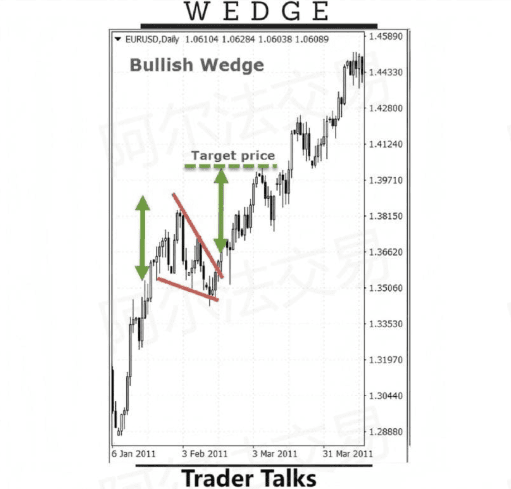
Wedges are another typical continuation pattern.
The bullish wedge appears in an uptrend, with prices operating within converging trend lines. This converging pattern indicates that bears are trying to suppress prices but cannot overcome the bullish forces. Eventually, the price breaks through the upper trend line, marking the continuation of the upward trend.
Important notice: The target amplitude takes the maximum vertical height of the wedge, projecting equal distances from the breakout point.
The principles of bearish and bullish wedges are the same, but they appear in a downtrend, and the overall slope is upward. Converging trend lines show that bulls have briefly interrupted the downtrend. When the price breaks through the lower trend line, it indicates that bears have regained control. The target amplitude is also projected from the maximum height of the wedge.
Flag Pattern
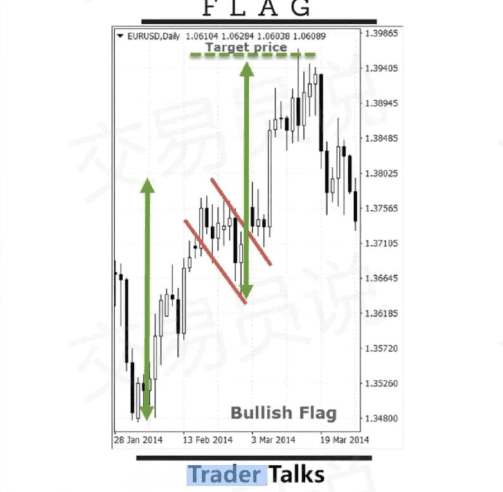
Flags are similar to wedges but are formed by parallel (rather than converging) trend lines and include a distinctive flagpole structure. The method for calculating target levels is unique and differs from other chart patterns.
Flags can be bullish or bearish; the above chart shows a bullish flag.
In an uptrend, a bullish flag will form, with parallel trend lines above and below the price movement, creating a downward slope.
Important notice: Breaking the above trend confirms that the upward trend is resuming.
Bearish flag and bullish flag are fundamentally the same, with the difference being that the bearish flag forms in a downtrend and has an upward trend.
Target amplitude calculation method: Take the vertical height of the flagpole (green arrow) and project it starting from the end of the flag pattern (lowest point for bullish flags / highest point for bearish flags).
Triangle Pattern
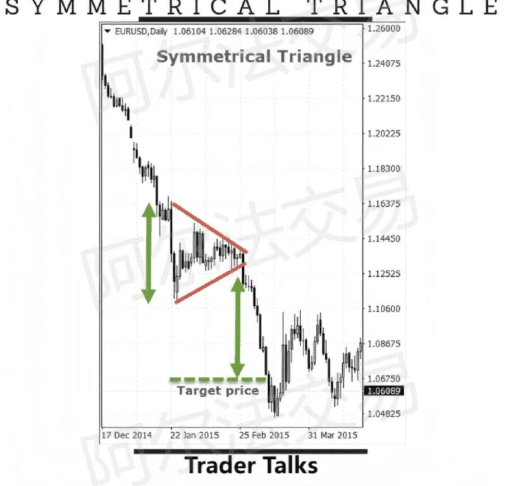
Triangles are divided into ascending triangles, descending triangles, and symmetrical triangles.
These three types of triangles look very similar, with the difference being that the ascending triangle has a flat upper trend line, while the descending triangle has a flat lower trend line.
Symmetrical triangles are the most common pattern, similar to wedge patterns, but the slope neither points upward nor downward, without a clear slope bias.
Important notice: In a downtrend, breaking the lower trend line means the continuation of the downtrend; while in an uptrend, breaking the upper trend line confirms the original upward trend.
The target price equals the maximum height of the triangle, projected outward from the breakout point.
Cup and Handle Pattern
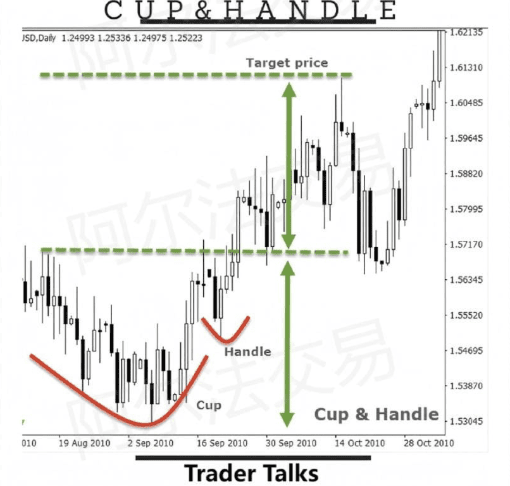
Cup and Handle pattern is a rounding top pattern, characterized by an additional pullback (the 'handle' part) after the rounding top. This is a continuation pattern indicating that in an upward trend, sellers are trying to push prices down, but market sentiment gradually shifts from sellers to buyers.
In addition, the pullback (formation of the handle) is the last attempt by sellers to control the market. When the price breaks through the resistance line (green dashed line), the target price is calculated based on the height of the cup handle pattern.
Inverse Cup & Handle pattern usually appears in a downtrend, with rules opposite to the regular cup and handle pattern.
Summary
The main purpose of this article is to show you another perspective on trading. As you can see, these chart patterns may help in judging the trend direction, but you should not rely solely on them.
In this article, we introduced 10 major chart patterns that every trader should understand. We believe these are the most important, but if you think I missed a key pattern, please share it in the comments.
To emphasize again, as mentioned in our previous articles, no trading method should be blindly copied. No single indicator is万能的, and no trading system can remain successful under inappropriate operations. You need to find a method that suits you and stick to it.
I am Ah Xin, if you don't know what to do in a bull market, click on my profile, follow me for planning in the bull market, contract secrets, and free sharing.


