Because many newcomers are just reckless and clueless, rashly entering the market and acting recklessly. But I'm different; it is precisely because I encountered Bitcoin that my life transitioned from a miserable existence to a path of wealth.
Currently living a semi-retired life, sharing a set of effective profit models in the cryptocurrency world, learning enough to dominate and occupy a new territory of my own, feel free to take it without thanks!
Three Laws of Cryptocurrency
Newton discovered the three laws of motion and became a master of physics. So today, let’s summarize the three major laws of the cryptocurrency world, can we count on everyone's support? Haha.
1. The interlinking laws of cryptocurrency trading
When Bitcoin rises, mainstream coins follow; when Bitcoin falls, mainstream coins plummet. When Bitcoin fluctuates, altcoins dance chaotically; when Bitcoin crashes, altcoins run away.
This interlinking law is basically known by everyone in the cryptocurrency circle. Usually, Bitcoin leads, and the other coins follow Bitcoin's movements.
What is mentioned here is not absolute; it basically describes how large market trends evolve. For example, this year's market from the beginning of the year until now has been driven up by Bitcoin. Of course, some altcoins are exceptions.
Second Law: Timing Law - Be patient when buying, and do not wait when selling.
Rebound operations differ from operations in an uptrend. In an uptrend, one generally waits until the price has stopped rising and starts to fall before selling. However, in rebound operations, selling does not directly wait for the price to peak.
In rebound operations, it is emphasized to sell early, generally decisively taking profits after making some gains; if for some reason you have not yet made a profit, and the market's rebound is about to reach its theoretical target, you should also sell decisively.
Because the duration and potential of rebound markets are limited, if you wait until the phase top is confirmed to sell, it is generally too late.
Third Law: Retail Trader Law - There were no retail traders in the world, but as more people rush for quick success, they inevitably become the non-traders! If you want to turn your situation around, don’t dwell on short-term gains and losses; being overly cautious can hinder your chances of success!
In conclusion: Summarizing a master's three investment decisions: 1. Invest in what you know; 2. Hold steadfastly; 3. Be prepared for overall planning.
I met a friend in New York who likes to trade spot and occasionally does contracts, particularly keen on dollar-cost averaging, buying more as prices drop. In just a few years, he has grown from small to large, now making a living from trading coins.
I have improved his 'trading strategy,' and after practicing it this year, with an initial capital of 200,000, I have now grown it to 29 million in less than a year. I hope this can help my followers!
One of the biggest challenges traders face in Smart Money Concepts (SMC) is accurately timing their entries. Even if you identify a high-probability trading opportunity on a higher time frame, entering too early or too late can lead to unnecessary losses. This is why optimizing entry points through lower time frames becomes crucial.
Lower time frames, such as 15 minutes (15M), 5 minutes (5M), 3 minutes (3M), and 1 minute (1M) charts, allow traders to grasp entry timing more precisely. Through this method, traders can lower risk, reduce stop loss ranges, and maximize profits.
This lesson will cover the following aspects:
1. Why using lower time frames can improve trading accuracy
2. How to use multi-timeframe resonance for confirmation
3. How to gradually optimize from 15M to 1M for refined entries
4. Key concepts such as Structure Breakouts (BOS) and Market Structure Shifts (MSS)
5. How to use order blocks (OB) and fair value gaps (FVG) to achieve precise entries
6. Examples of optimized entry on lower time frames
Why entering on lower time frames can improve trading accuracy
Most retail traders rely solely on signals from high time frames to enter the market, which often leads to entering too early or too late, and even getting stopped out before the market moves in the expected direction. On the other hand, smart money operates by observing price action on lower time frames to confirm signals before entering.
Using lower time frames has three core advantages:
1. Tighter stop-loss settings
Trading on higher time frames (such as 1 hour or 4 hours) usually requires setting larger stop-loss ranges to cope with price fluctuations. By entering on 1M or 3M charts, smaller stop-loss points can be set while maintaining the same direction as the larger cycles. This can significantly improve the risk-reward ratio.
2. Confirm whether smart money has genuinely intervened.
Rather than blindly entering the market when the price reaches a supply-demand zone on a higher time frame, it is better to confirm whether there are signs of smart money behavior through lower time frames. This includes observing structure breakouts, structure shifts, liquidity grabs, and more refined order blocks.
3. Avoid false breakouts
What may seem like a strong breakout on higher time frames can often be a trap (liquidity trap). By observing lower time frames, traders can better distinguish between real breakouts and false ones, thus avoiding being 'fooled' by the market.
How to use multi-timeframe resonance for confirmation
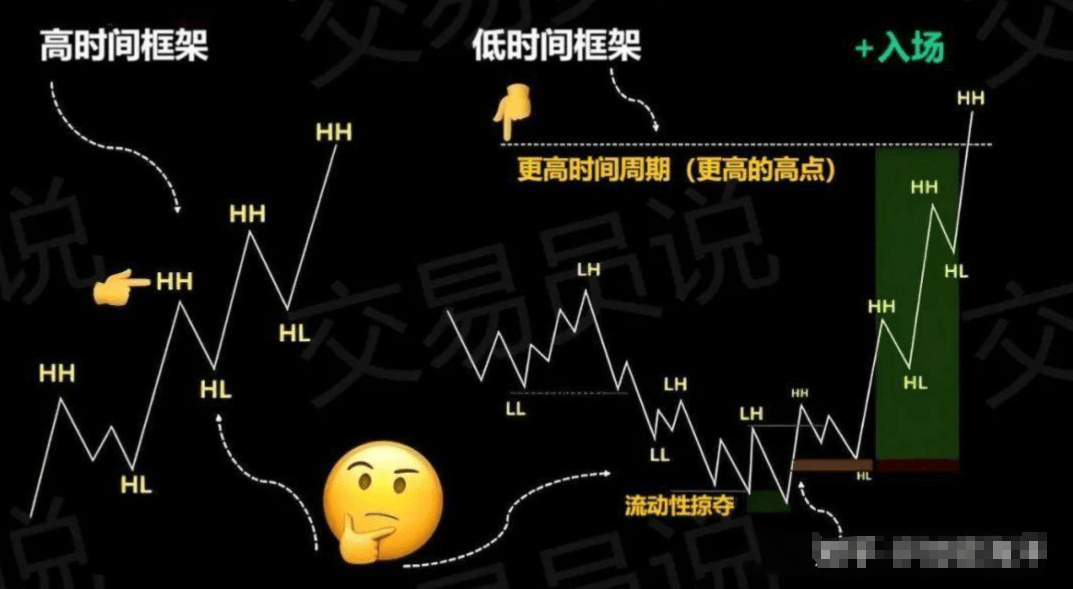
SMC traders adopt a top-down analysis approach, meaning they analyze multiple time frames before executing trades. This method ensures that entry direction aligns with the overall market trend.
1. Higher Time Frames (HTF) - Daily, 4-hour, 1-hour
◔ Used to determine overall trends and trading biases.
◔ Mark key supply-demand zones, order blocks (OB), fair value gaps (FVG), and liquidity areas.
◔ Example: If the 4-hour chart shows a bullish structure, traders should look for long opportunities instead of shorting.
2. Medium-term time frames (MTF) - 15 minutes, 5 minutes
◔ Used to optimize entry points by observing market structure shifts (MSS) and structure breakouts (BOS).
◔ Can help determine possible entry areas on lower time frames.
◔ Example: If the 15-minute chart shows liquidity sweeping + BOS, it indicates that there are signs of smart money accumulating.
3. Lower Time Frames (LTF) - 3 minutes, 1 minute
◔ Provide the most precise entry points with minimal losses.
◔ Traders will look for the last BOS or MSS as confirmation before entering.
◔ Example: In the 15-minute demand zone, using order blocks on the 1-minute chart for entry can set smaller stop losses.
Through this multi-time frame analysis method, traders can improve trading accuracy and reduce risk.
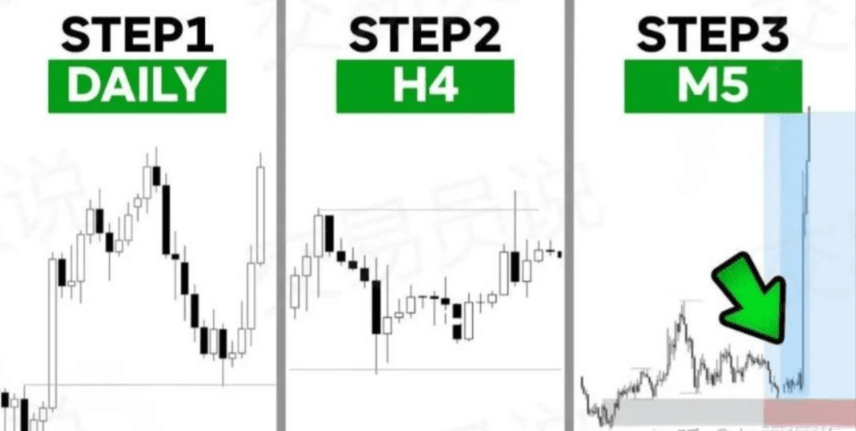
The entry optimization process from 15 minutes to 1 minute
Step #1: Identify trends on higher time frames
Before looking at lower time frames, one must first assess the overall market direction through higher time frames (such as 4-hour or 1-hour charts).
◔ If the market is in an uptrend, look for long opportunities.
◔ If the market is in a downtrend, look for shorting opportunities.
◔ Mark key areas where prices may react, such as order blocks, fair value gaps (FVG), and liquidity zones.
Step #2: Look for market structure shifts on the 15-minute chart.
Once the price enters a key area marked on a higher time frame, switch to the 15-minute chart to observe price action.
◔ Liquidity grabbing: If the price sweeps through previous highs/lows (such as clearing stop-loss orders), it indicates that smart money is in control.
◔ Structure Breakout: When the price breaks through crucial structural levels, it indicates that a trend may reverse.
◔ Demand zone rebounds: A strong rejection pattern occurs in the demand zone, signaling the emergence of buying pressure.
Step #3: Further optimize entries on 5M, 3M, or 1M charts.
After confirming structure changes on the 15M chart, continue to look at lower time frames (5M, 3M, 1M) for optimal entry points while minimizing stop loss.
◔ Look for the last BOS or MSS as a confirmation signal.
◔ Find a more refined OB or FVG as an entry area.
◔ Wait for the price to retrace to an OB or FVG before entering, rather than chasing the market up and down.
By refining entries down to the 1-minute chart, traders can achieve smaller risks and higher precision in their entry operations.
Key SMC Concepts: BOS, MSS, OBs, and FVGs
1. Structure Breakout (BOS)
When the price breaks through key highs or lows, it forms a structure breakout (BOS), which typically indicates that the trend will continue. BOS appearing on the 15-minute chart (15M) can be used to confirm trend direction, while BOS on the 1-minute chart (1M) is mainly used for precise entries.
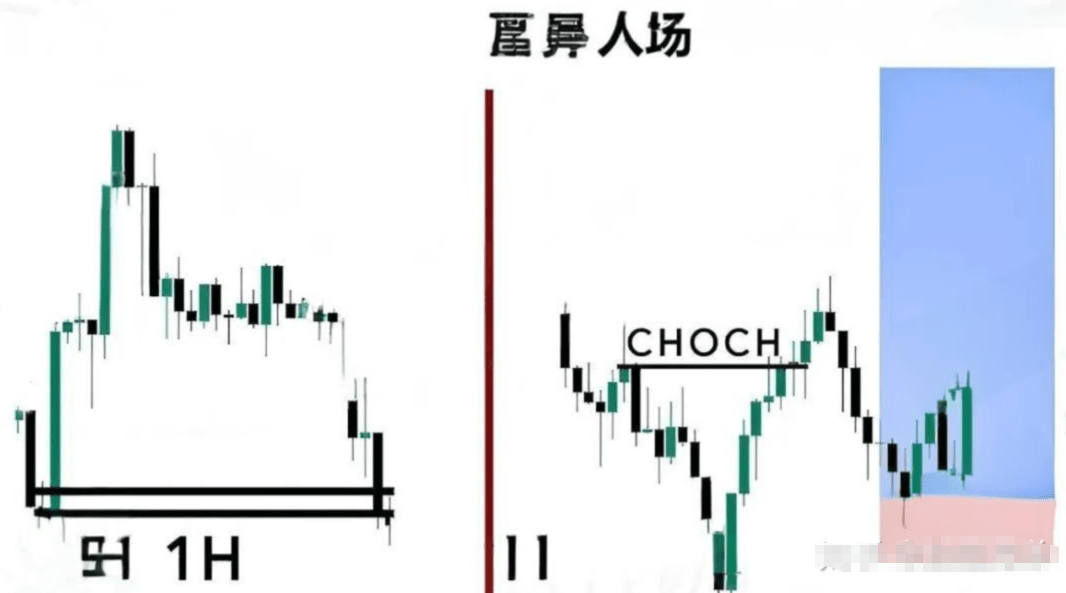
2. Market Structure Shift (MSS)
Market Structure Shift (MSS) is a sudden reversal of price structure, usually caused by manipulative behavior from smart money. This situation often occurs after liquidity grabbing, followed by a rapid price reversal in the opposite direction.
3. Order Blocks (OBs) for optimizing entries
Order Blocks (OB) are the locations where smart money once concentrated its positions. Instead of entering at any location, traders should choose optimized order blocks on lower time frames to improve entry accuracy.
4. Fair Value Gaps (FVGs) for precise entries
Fair Value Gaps (FVGs) are price gaps caused by institutional orders. These areas have a 'magnetic effect' that often attracts prices to retrace before continuing in the original trend direction. Entering at FVGs within OBs on higher time frames using 1-minute or 3-minute charts can achieve optimal trading precision.
1. 4-hour chart (4H): Price reaches the demand zone on the higher time frame.
2. 15-minute chart (15M): Price sweeps through previous lows (liquidity) and then breaks upward through structure (BOS).
3. 5-Minute Chart (5M): Price retraces to newly formed bullish order blocks (Bullish OB).
4. 1-minute chart (1M): Price enters the order block, accompanied by liquidity sweeping to form BOS again.
5. Entry point: Go long at the order block position, setting the stop loss just below the structural low, resulting in minimal stop loss.
This entry method ensures minimal losses while maximizing potential profits.
Conclusion
Using lower time frames to optimize entries is a powerful technique that allows traders to enter with higher accuracy, set smaller stop losses, and achieve better risk-reward ratios. Compared to blindly entering based solely on high time frame signals, traders can further switch to 15-minute, 5-minute, or even 1-minute charts to confirm market structure, identify liquidity grabs, and find sniper entry points at order blocks (OB) or fair value gaps (FVG).
The ten iron laws of cryptocurrency trading; newcomers should remember them!
1. In a bull market, the hottest coins that drop the fastest are often those that have been heavily speculated upon, especially those with severe market control; the bubbles burst quickly, and the more people chase, the riskier it becomes. Like blowing up a balloon, once it gets too big, it will inevitably pop.
2. Altcoin tactics are generally similar; the usual tactic is to first crash the price and then slowly raise it, continuing to harvest in different ways. This is how altcoins work, and one must be psychologically prepared.
3. The long-term trend of the market is upward. If you stretch the time frame, the curve is actually relatively stable; short-term fluctuations are normal, while the long-term trend generally rises slowly.
4. Truly potential coins are often unnoticed at the bottom; those with real potential are rarely mentioned, while those low-key coins quietly rise, such as C98 and LEVER.
5. Be cautious of newly listed coins on exchanges; avoid those that experience extreme volatility, as they are generally traps designed by market makers, leading to losses.
6. Price fluctuations are common; buying often leads to drops, and selling often leads to rises. This volatility is very normal in the cryptocurrency market. If you can't handle this level of fluctuation, you really need to practice.
7. The strongest rebounds do not necessarily represent potential; the coins that rebound the hardest are often not genuinely potential but rather speculative plays that have been hyped up. Don’t be misled by appearances; truly potential coins have smoother fluctuations.
8. Be cautious of sudden pullbacks to avoid losses. If the price rises after you buy a coin and then suddenly pulls back, it may indicate that the market makers are starting to sell. Be careful not to get caught in a loss.
9. In the second half of the explosive bull market, coins that performed mediocrely in the first half can suddenly explode several times in the latter half; they are like marathon runners who gain momentum in the later stages.
10. A market that has been sideways for months may explode into a bull market. Some markets can remain sideways for months after several times increase in value; they are likely waiting for the next wave of explosion. Keep a close watch on these coins. If trading does not go smoothly, remember two things: first, take decisive action; second, stay online and respond promptly to news!
Fate brings us together, but knowing each other is a blessing. I firmly believe that those destined to meet will ultimately connect, while those not meant to meet will pass by. The journey of investing is long, and momentary gains or losses are merely the tip of the iceberg. Remember, even the wisest will have their misjudgments, while the foolish may find an unexpected gain. Regardless of emotions, time will not stop for you. Pick up your burdens, stand up again, and move forward.
Walking in the city of cryptocurrency, mastering the seven trading paths, one must understand the progress and retreat in investment, to stand firm in the wind, yet remain stable in traps.
I am A-Xin, if you don’t know how to trade in a bull market, click on my avatar to follow me for free sharing of bull market spot strategies and contract tips.


