I started trading cryptocurrencies in early 2015 and have accumulated over 30 million in profits over the years.
As an old player in the cryptocurrency market, I have been trading for 10 years without realizing it. It is indeed not easy to survive in the crypto world until now! I have also been beaten by market manipulators before, experienced many liquidations, felt confused, and countless times hid alone in a dark corner, smoking one pack after another. This is the price of growth!
Today, I would like to share a free summary of my years of trading experience, hoping it can help everyone!
The following are the indicators I commonly use, and I don't look at just one; I consider all of them together!
I. Trend Judgment Indicators
Moving Average (MA)
Definition: A curve formed by calculating the average price over a specified period, commonly using 5-day, 10-day, or 50-day moving averages
Trading Signal:
Golden Cross: Short-term moving average crosses above long-term moving average (e.g., MA5 > MA20), buy signal
Death Cross: Short-term moving average crosses below long-term moving average, sell signal
Practical Case: BTC started a main uptrend after breaking MA50 in March 2025, soaring 58% in a single month
MACD Indicator
Composition: Composed of DIFF line (fast line), DEA line (slow line), and histogram
Key Signals:
Golden Cross: DIFF line crosses above DEA line (Bull Market Signal)
Death Cross: DIFF line crosses below DEA line (Bear Market Warning Signal)
Case: In April 2025, when ETH broke new highs, MACD golden cross occurred, and the subsequent 7-day increase exceeded 40%
II. Overbought and Oversold Indicators
Relative Strength Index (RSI)
Definition: Fluctuation in the range of 0-100, measuring the speed of price change
Operating Rules:
Overbought Area (RSI > 70): Take partial profits, beware of corrections
Oversold Area (RSI < 30): Buy on dips, ambush for rebounds
Case: SOL rebounded 32% in 3 days after RSI dropped to 25 in May 2025
KDJ Indicator
Three Lines are composed of: K Line (sensitive), D Line (medium-term), J Line (extreme fluctuations)
Buy/Sell Points:
J-line Bottoming (<0): Short-term buying signal
J-line Peaks (>100): Signal to avoid holding positions
In Practice: DOGE fell over 15% in a single day after multiple J-line overbought signals
III. Volatility Indicators
Bollinger Bands (BOLL)
The Three Bands are composed of: Upper Band (Resistance), Middle Band (Trend), Lower Band (Support)
Trading Strategy:
Opening Expansion: Price breaks above the upper band, chase the rise (e.g., BTC breaks $110,000)
Narrowing Contraction: Price close to the midline, mainly observe
Case: APE coin exploded after the Bollinger Bands narrowed in May 2025, with a 24-hour amplitude of 68%
Average True Range (ATR)
Function: Quantify market volatility intensity, assist in stop loss settings
Formula: Stop Loss = Opening Price ± (1.5 × ATR)
Application: When BTC intraday ATR = $1500, stop loss should be ≥ $2250
IV. Volume Auxiliary Indicators
Volume
Core Principle: Uptrends require volume support, while downtrends with decreasing volume indicate reversal
Divergence Signal:
❗ Price Increases with Volume Decrease: Bullish Exhaustion, beware of a top (e.g., LTC trend in April 2025)
❗ Price Drops with Volume Increase: Strong Bearish, timely stop loss
Funding Rate Arbitrage
Strategy: Short when funding rates are positive, long when negative, to profit from the rate difference
Tools: Automated monitoring platforms like XBIT can yield annual arbitrage returns of up to 35%
Five Must-Know Combination Techniques
MA+BOLL Dual Resonance: Enter long when the price simultaneously breaks through MA50 and the upper Bollinger band
RSI+MACD Divergence: New price highs but MACD not reaching new highs; open short when RSI > 80
ATR Dynamic Stop Loss: Adjust stop loss levels based on volatility to avoid being washed out
KDJ Ultra Short-term Sniping: Go long with the 1-minute K-line when J-line <0, take profit at 3%
Proven method: turned 500,000 into 10 million just by learning to read 16 types of K-lines, accurately judging buy and sell points! Win rate as high as 99%, suitable for everyone!
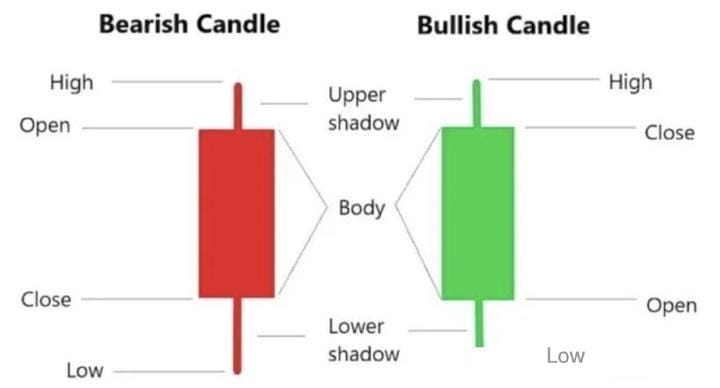
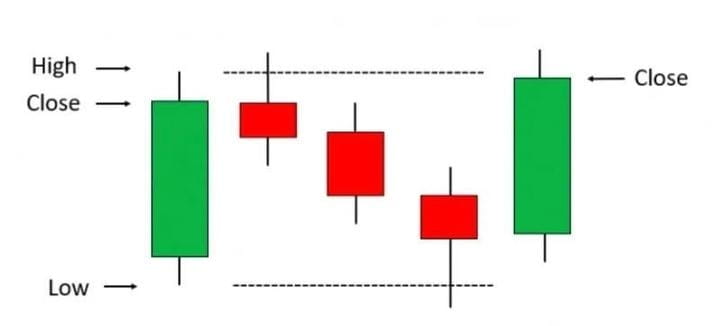
K-line Body
The K-line body represents the opening and closing prices of the asset. The position of the opening or closing price depends on the K-line and whether prices were bullish or bearish during a specific time period. In a bullish market, the closing price will be higher than the opening price, while the opposite is true in a bearish market.
K-line Shadows
Each K-line usually has two so-called shadows, although this is not a fixed rule. The shadows represent the highest and lowest prices during a specific time period. The upper shadow represents the highest value, while the lower shadow represents the lowest price reached. Sometimes a K-line may only have one shadow if the other shadow overlaps with the opening or closing price, aligning with the body on the same horizontal line.
K-line Color
The color of the body indicates the direction of price movement. Generally, a green (or white) body indicates a price increase, while a red (or black) body indicates a price decrease. Most platforms display green or red bodies. Therefore, if the body is green, the highest point of the body will represent the closing price.
How do K-lines play a role in trading?
So far, K-line charts are the most comprehensive graphical style for displaying asset prices. Cryptocurrency traders have borrowed this type of chart from stock and forex trading. Unlike line charts that only show closing prices, K-line charts provide a wealth of historical price-related information due to their structural characteristics (as mentioned above).
K-lines form in chronological order, and even without using technical indicators, they can help you understand the overall trend as well as resistance and support lines. Additionally, specific patterns formed by K-lines can serve as signals for buying or selling. The use of K-line charts is particularly important in cryptocurrency trading due to its high volatility, requiring meticulous technical analysis.
16 Popular K-line Patterns
K-line patterns are diverse, and in this article, we will introduce some of the most popular and reliable patterns, starting with bullish patterns, which appear after a downtrend and indicate an impending upward reversal. Cryptocurrency traders typically open long positions when these patterns appear.
1. Hammer
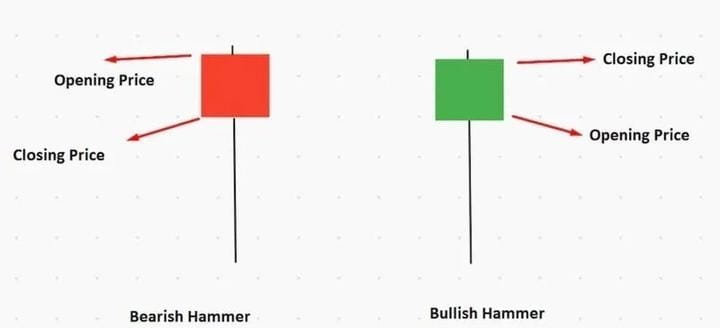
The Hammer K-line consists of a shorter body and a long lower shadow. This pattern is called a hammer because the shape of the K-line resembles an upright hammer. Generally, the hammer appears at the bottom of a downtrend. This pattern indicates that buyers resisted selling pressure during this time and pushed the price higher. The hammer can be green or red, but the bullish trend is stronger with the green hammer compared to the red one.
2. Inverted Hammer
The Inverted Hammer is similar to the standard hammer shape, but it has a much longer upper shadow and a very short lower shadow. This pattern indicates buying pressure exists, and short-sellers are attempting to lower prices but fail. As a result, buyers return with stronger pressure, pushing prices up.
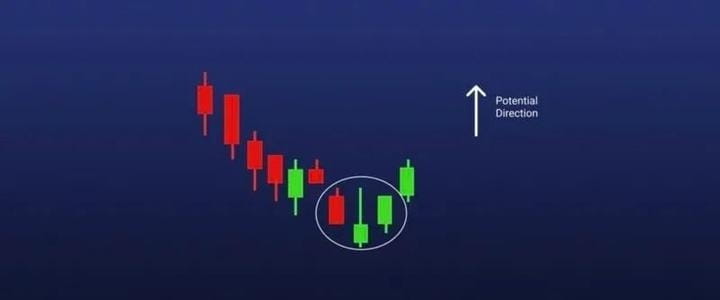
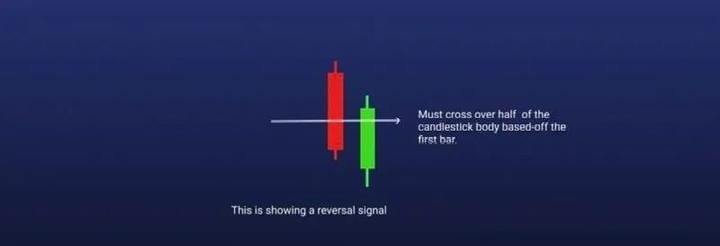
3. Bullish Engulfing
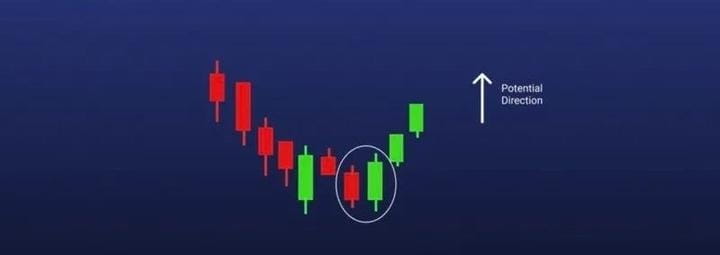
Unlike the previous two patterns, the bullish engulfing consists of two K-lines. The first K-line should be a shorter red body, which is engulfed by a larger green K-line. The opening price of the second K-line is below the previous red K-line, increasing buying pressure, leading to a reversal of the downtrend.
4. Piercing Pattern
Another type of double K-line pattern is the Piercing Pattern, which may appear at the bottom of a downtrend at support levels or during a pullback when a bullish trend is expected. This pattern consists of a long red K-line followed by a long green K-line. The key to this pattern is that there is a significant gap between the closing price of the red K-line and the opening price of the green K-line. The closing price of the green K-line is far above the opening price, indicating buying pressure.
5. Morning Star
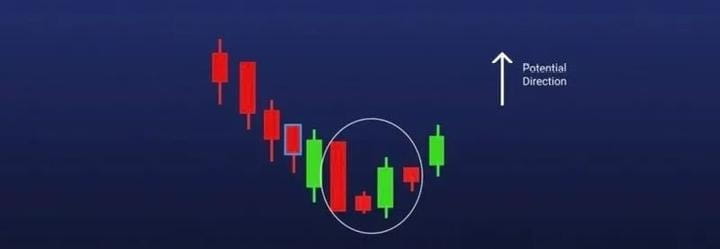
The Morning Star pattern is more complex as it consists of three K-lines: a long red K-line, followed by a short-bodied K-line and a long green K-line. The Morning Star pattern indicates that the selling pressure from the first period is weakening, and a bull market is forming.
6. Three White Soldiers
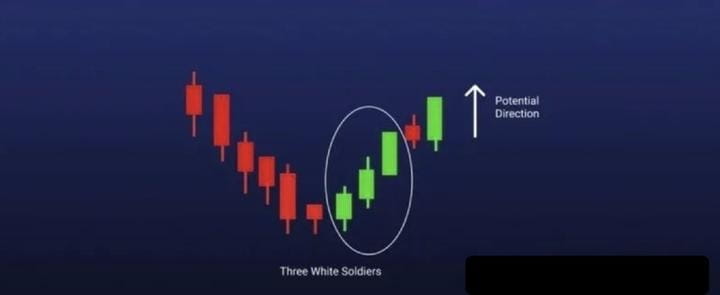
Another pattern consisting of three K-lines is the Three White Soldiers. This pattern consists of three long green K-lines, usually with short shadows. The main condition is that there are three consecutive green K-lines, and the opening and closing prices must be higher than the previous cycle. This pattern is viewed as a strong bullish signal appearing after a downtrend.
Next, we will discuss a set of bearish patterns that are expected to reverse an uptrend, usually appearing in resistance areas. These patterns often prompt traders to close long positions or open short positions.
7. Hanging Man
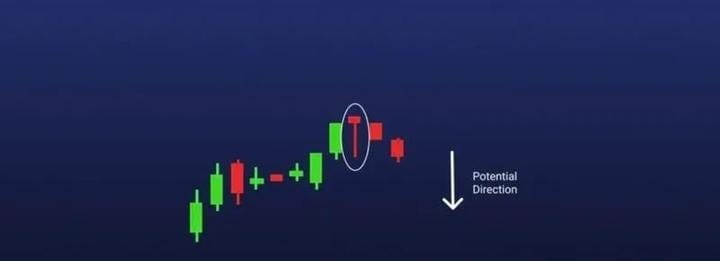
The Hanging Man is a K-line with a very short body and long shadows, either green or red. It typically appears at the end of an uptrend, indicating an impending selling wave, but short-sellers may temporarily push prices higher before losing control.
8. Shooting Star
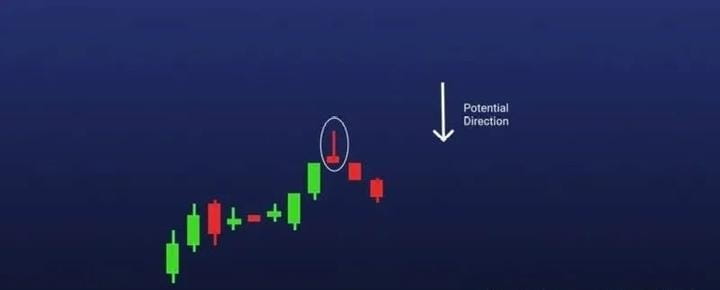
The Shooting Star is the opposite of the Inverted Hammer. This pattern consists of a small body and a long upper shadow of a red K-line. Generally, the market will gap up at the opening of the K-line and surge to a local high, with the closing price being slightly below the opening price. Sometimes the body is almost non-existent.
9. Bearish Engulfing
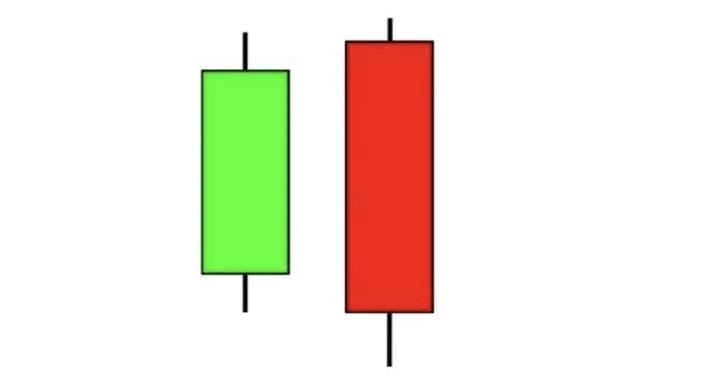
The bearish engulfing pattern is the reverse version of the bullish engulfing. The first K-line has a smaller green body that is completely covered by the following long red K-line. This pattern appears at the peak of an uptrend, indicating a reversal. The lower the closing price of the second K-line, the greater the bearish momentum.
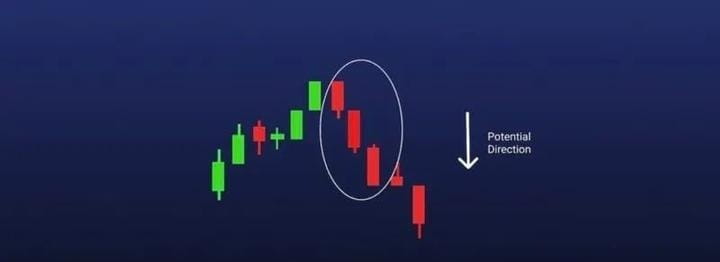
10. Evening Star
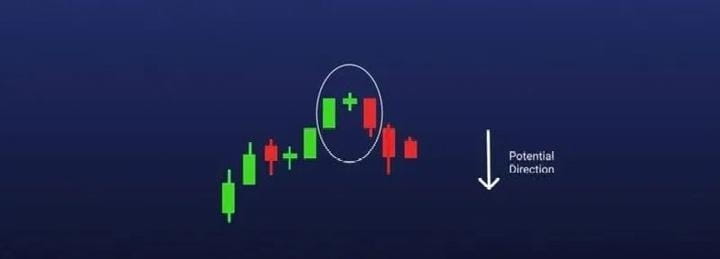
Evening Star represents a specific three K-line pattern. It is composed of a short-bodied K-line in the middle, with longer green K-lines on the left and a larger red K-line on the right, and the closing price of the third K-line is below the midpoint of the first green K-line. This pattern typically appears at the top of an uptrend, indicating a potential reversal.
11. Three Black Crows
The Three Black Crows pattern is composed of three long red K-lines with short or almost non-existent shadows. The opening price of each new K-line is essentially the same as the previous K-line, but each closing price significantly declines. This is a strong bearish signal.
12. Dark Cloud Cover
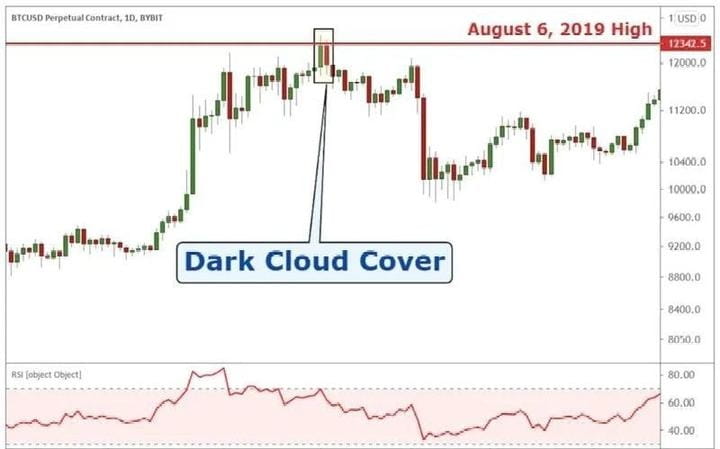
The Dark Cloud Cover pattern is similar to the Piercing Line but is the opposite. This pattern indicates a bearish reversal and consists of two K-lines, where the opening price of the red K-line is higher than the previous green K-line's body, and the closing price is below the midpoint. This pattern suggests that sellers have taken control of the market, driving prices down. If the K-line's shadows are very short, traders can expect a strong downtrend.
In addition to predicting trend reversals with bullish and bearish patterns, there are neutral patterns or K-line patterns that indicate the continuation of bullish or bearish trends.
Including:
Doji Star
Spinning Top
Descending Three Methods
Rising Three Methods
13. Doji Star
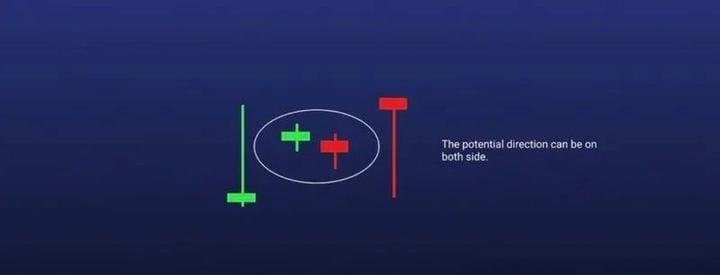
The body of a Doji Star K-line is very small, with long shadows. This pattern is typically seen as a continuation pattern, but traders should also be cautious as it may indicate a reversal. To avoid confusion, wait for several K-lines to appear after the Doji Star before opening a position when the situation is clear.
14. Spinning Top

Similar to the Doji Star, the Spinning Top is also a K-line with a shorter body. However, this pattern has shadows of equal length on both ends of the body. This pattern also indicates a sideways movement and may suggest that prices are consolidating or correcting after a significant rise or fall.
15. Descending Three Methods
The Descending Three Methods is a pattern made up of five K-lines arranged in a specific manner, indicating the continuation of a downtrend. This pattern consists of two longer red bodies at both ends and three smaller green bodies in the middle. The bodies of the green K-lines are completely covered by bearish red bodies, indicating that buyers do not have enough strength to reverse the downtrend.
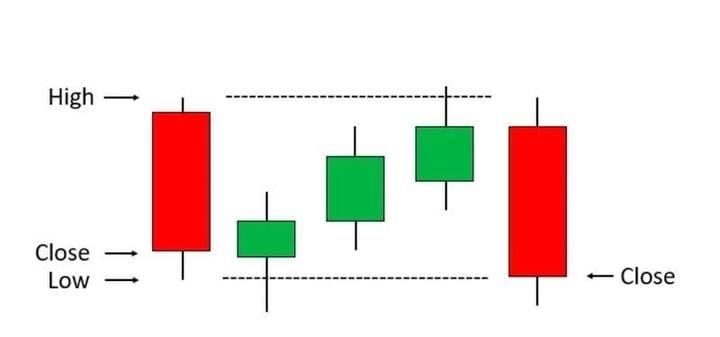
16. Rising Three Methods
The Rising Three Methods pattern is the opposite of the previous pattern, typically appearing in an uptrend. This pattern consists of two longer green bodies at both ends and three smaller red bodies in the middle.
How to Read K-line Charts
K-line charts contain a wealth of historical data and information, making them easy to read when combined with practice. In addition to the K-line patterns discussed above, there are many K-line charts formed by specific arrangements, such as double tops and double bottoms, flags, and triangle flags.
Even novice or seasoned traders can read K-line charts by visually observing the overall trend. These visual materials often provide ample insights to help traders recognize specific patterns in K-lines and their components, especially at resistance and support levels.
Common Terms in K-line Charts
The following terms related to K-line charts are provided for your reference during trading:
Forming Patterns - K-line patterns that are not yet fully formed but have initial shapes
Formed Patterns - Patterns that have fully developed and can be viewed as bullish or bearish signals
Opening Price - The opening price of the K-line
Closing Price - The closing price of the K-line
Highest Price - The highest price covered by the K-line during the period
Lowest Price - The lowest price covered by the K-line during the period
Advantages of Using K-line Patterns
K-line patterns help cryptocurrency traders better understand potential future trends. In other words, K-line patterns serve as signals to help traders decide when to open long or short positions and when to enter or exit the market. For example, swing traders view K-line charts as indicators to determine reversal and continuation trading patterns.
K-line charts and their patterns help traders determine trends, understand momentum, and closely monitor current market sentiment.
Mnemonic Methods for K-line Patterns
If you want to quickly identify K-line patterns, traders need to familiarize themselves with K-lines by observing charts and using small amounts of capital for trading. A good way to start is to focus on learning single K-line patterns and carefully analyze patterns formed by two K-lines.
It is best to start with one pattern until you are confident in easily identifying that pattern during price fluctuations.
If you have been trading cryptocurrencies for over a year without making 1 million, after reading these 10 tips, you may understand why!
If you have been struggling in the crypto space for over a year but your account balance hasn't reached the expected 1 million, then this article might provide you with some insights.
1. Small Capital, Capture Main Uptrends
If your capital is not large (e.g., under 100,000), capturing one main uptrend each year is sufficient. Don’t always be fully invested; keep enough cash to cope with sudden situations. The market always has opportunities, but once the capital is lost, the opportunity is no longer yours.
2. Recognition Determines Wealth
A person can never earn money beyond their cognition. A demo account is a good tool for practicing mindset and strategy, but it cannot fully simulate the emotional fluctuations of the real market. In live trading, each failure can bring enormous psychological pressure, even causing you to exit the market entirely. Therefore, start with a small amount of capital and gradually improve your cognition and capabilities.
3. Good News Realization, Act Decisively to Sell
When encountering significant good news, if there is no selling on that day, be decisive to sell on the next day's high open. The market often experiences selling pressure after good news is realized, which is a hard rule for short-term operations. Don’t be greedy; take the profit.
4. Reduce Positions During Holidays to Avoid Risks
When encountering major holidays, reduce positions or go flat a week in advance. Historical data shows that market liquidity decreases during holidays, leading to significant volatility or declines. Avoiding uncertainty is a wise choice.
5. Medium to Long-term Investment, Rolling Operations
The core of medium to long-term investment is to keep enough cash, gradually unloading during market rises, and buying back in batches during declines. Rolling operations can reduce holding costs while maintaining flexibility.
6. Short-term Trading, Choose Active Coins
The key to short-term trading is to choose active cryptocurrencies; those with increased volume and volatile prices are more likely to provide trading opportunities. Avoid inactive coins as poor liquidity can lead to difficulties in buying and selling, or even getting stuck.
7. Understanding Market Rhythm
Slow declines are usually accompanied by slow rebounds, while rapid declines trigger rapid rebounds. Understanding this can better grasp the timing for bottom-fishing and peak-escaping.
8. Stop Loss is the Foundation of Survival
Admit when you buy wrong and stop loss in time. The market always has opportunities; preserving capital is the premise for long-term profits.
9. Focus on the 15-minute K-line chart
Short-term traders must pay attention to the 15-minute K-line chart, using KDJ indicators to find buy and sell points. Signals in the overbought and oversold regions of the KDJ indicator are particularly important, but should be combined with other indicators (such as MACD, RSI).
10. Master a Few Techniques, Don’t Be Greedy
There are countless techniques and methods for trading cryptocurrencies, but you only need to master a few. Don’t be greedy; focus on the techniques and strategies you are familiar with to navigate the market with ease.
The cryptocurrency market is a place full of opportunities, but it is also a market that requires wisdom and patience. I hope these 10 valuable tips can help you find your own path to wealth in the crypto space.
I am Ah Peng, having gone through multiple rounds of bull and bear markets with rich market experience in various financial fields. Here, penetrating the fog of information, discover the real market. Seize more wealth password opportunities, find truly valuable opportunities, and don’t miss out and regret!
Ah Peng only does real trading; the team has positions to enter at speed #加密市场回调 $BTC$ETH


