It only takes a month! Made 1 million from a 10,000 small account!
My cryptocurrency trading method is very simple! Let me share a feasible plan. If you can stick to it, making 1 million from 10,000 is achievable.
Recommended optimal strategy: Rolling positions!
1. Five stable strategies for contract rolling positions
- Phased rolling positions: Adjust positions in stages (e.g., close 25% of the position each time and open new positions simultaneously), reducing the impact of a single operation on the market, suitable for highly volatile markets.
- Pyramid-style position building: Divide funds into bottom positions (30%), middle positions (20%), and top positions (10%). The higher the price, the smaller the position building ratio, ensuring that the holding cost is lower than the market price.
- Hedging roll-over: Open reverse contracts to hedge risks during the roll-over period, and lift the hedge after the original position is closed, which can effectively avoid price fluctuations during roll-overs.
- Dynamic leverage adjustment: Initially use low leverage (like 3-5 times) to establish a base position, and gradually reduce leverage (like from 10 times to 2 times) as the trend is confirmed to avoid liquidation risks.
- Perpetual contract substitution: Convert regular contracts to perpetual contracts to maintain long positions by paying funding rates, suitable for medium to long-term trend trading.
2. Classic model of spot rolling
- 30% position rolling method: Use 30% of funds as a base position for long-term holding, with the remaining 70% for high-selling low-buying. For example, add positions during a 10% pullback, and sell the added positions after a rebound to gradually dilute costs.
- Grid trading strategy: Set price ranges and staggered orders to automatically complete low buying and high selling in volatile markets, requiring adjustment of grid density according to trend direction.
Risk control and capital management
1. Risk boundary setting
- Stop loss rules: Single losses should not exceed 2% of total capital; for example, under 10x leverage, the stop loss point must be controlled within a 0.2% price fluctuation range.
- Position limit: The funds in the futures account should not exceed 10% of the spot position, and the leverage ratio should be controlled within 3 times; in extreme market conditions, it can be reduced to 0.5 times.
- Profit locking: After each wave of profits, extract 20%-30% as reserves to avoid capital loss due to subsequent operational mistakes.
2. Capital allocation principles
- Small capital strategy: For funds below $50,000, focus on medium to long-term trends, seeking 3-5 times returns per trade, rather than short-term high-frequency trading.
- Large funds strategy: For funds above 1 million, they should be diversified into spot, futures, and hedging tools, using spot earnings to cover futures risks, forming a 'safety cushion' effect.
Practical case and warning of pitfalls
1. Successful case dissection
Taking the 2024 Bitcoin bull market as an example:
- Initial operation: Build a position of $10,000, using 10% of the position (5,000 capital out of 50,000) to open 3x leverage, with a stop loss point set at 2% ($9,800).
- Position addition point: After breaking the resistance of $11,000, add 10% of the total funds (at this time, the total funds have increased to $55,000, adding $5,500).
- Result estimation: If the price rises to $15,000, accumulated profits can exceed $200,000, with a yield of over 400%.
2. Common misconceptions
- Excessive leverage: Using more than 20 times leverage and fully invested leads to liquidation with slight fluctuations.
- Counter-trend rolling: Frequent operations in a volatile market can erode profits due to transaction fees.
- Emotional position addition: No clear stop profit or stop loss points set, leading to strategy discipline being disrupted by 'fear of heights' or 'bottom fishing mentality.'
The essence of rolling positions is to convert probabilistic advantages into compound growth through position management, relying on three points for success:
1. Opportunity screening: You only need to seize 2-3 high-certainty trend markets throughout the year to achieve a wealth leap;
2. Dynamic balance: Position increases and decreases, along with leverage adjustments, need to flexibly change with market conditions rather than mechanically executed;
3. Psychological training: Accept the norm of 'missing out' and 'stop loss', and avoid letting short-term fluctuations affect long-term strategies.
For ordinary investors, it is recommended to start with spot rolling positions, and after familiarizing with the market rhythm, try contract strategies while always following the principle of 'risking profits and defending capital.'
How I make money:
You only need three hundredfolds to earn $10 million.
Let’s start with a fundamental theorem: In one’s life, one only needs to continuously gamble on three hundredfold coins to achieve financial freedom.
The first step is to prepare $10,000.
10,000 - 100,000
100,000 - 1,000,000
1,000,000 - 10,000,000
Break down $10 million into three hundredfold opportunities, looking for corresponding opportunities in the first, second, and third hundredfolds, repeating profitable operations 100 times in each hundredfold, and $10 million can basically be achieved.
Of course, this also applies to earning 1 million, or even 100 million; the underlying methodology is the same.
Thus, your next task is to find three hundredfold coins!
My method of screening for hundredfold coins:
1. Low market cap selection: The circulating market cap and total market cap should be low, especially for public chains and dapp protocols. Low market cap means greater upside potential, avoiding early profits taken by project parties.
2. High potential in the track: The selected track should have a high ceiling and valuation potential. Refer to successful projects, such as public chains looking at ETH, SOL, and dapps looking at UNI, AAVE.
3. New narratives and value: Preference for projects with new narratives that solve real problems. Long-term value discovery is superior to short-term speculation, focusing on hot topics like AI GPU computing power and secure public chains.
4. The concealment of dark horse coins: hundredfold dark horse coins often hide in areas that have not received public attention. Avoid coins that are widely known for high opening or normal valuations.
5. Challenges of liquidity for early coins: Early hundredfold coins often have poor liquidity, mostly found in small exchanges or on-chain. Overcoming these thresholds is a necessary path to discovering value.
6. Launch time and market cycle: The best time for a token to launch is preferably at the end of a bull market or the beginning of a bear market, with a launch and washout time of 6-12 months being ideal and a high circulation rate.
7. Affordable unit price: A low unit price with many zeros after the decimal point is more likely to attract investors, especially in a bull market, lower-priced coins are more favored by beginners.
8. Prioritize public chains and leading protocols: Public chains and leading protocols on public chains have the greatest potential for profit due to their long lifecycle and continuous ecological development.
9. Team and institutional endorsement: The founder, team background, investment institutions, and financing amounts should be reliable. Participation from well-known teams and institutions increases the project's credibility.
10. Avoid value investment traps: Do not participate in projects that violate value investment logic, such as deflation tokens, as these projects tend to carry high risks.
11. Old coins with new narratives can be considered: If an old coin has a strong new narrative that aligns with current market hot spots, it can be considered for participation, such as old coins related to AI, the metaverse, and other fields.
12. Prioritize leading projects in selected tracks: Prioritize leading projects in selected tracks, as they usually have stronger ecological influence and value potential.
Remember, the above iron rules are guidelines for screening new coins, but investment always carries risks, and every investment decision should be treated with caution.
In the crypto space, achieving financial freedom and class leaps, I have summarized 9 trading tips; understanding one of them can lead to stable profits, worthy of repeated learning:
1. When the market crashes, if your coin only drops slightly, it indicates that there are market makers protecting the price, preventing it from falling. Such coins can be confidently held, and there will surely be gains in the future.
2. A simple and direct method for beginners to buy and sell coins: For short-term, observe the 5-day line; as long as the coin price is above the 5-day line, hold; if it falls below, sell. For medium-term, observe the 20-day line; if the coin price is above the 20-day line, hold; if it falls below, exit. The method that suits you is the best, and the key is to persist in execution.
3. If the main upward wave of the coin has already formed, and there is no significant volume increase, then decisively buy. Continue to hold when the price rises with volume, and also hold when it decreases in volume but the trend is not broken; if the price falls with volume and breaks the trend, then quickly reduce the position.
4. After buying short-term, if the coin price does not move within three days, sell if possible. If the coin price drops after purchase, a loss of 5% means unconditional stop loss.
5. If a coin has dropped 50% from its high and has fallen for 8 consecutive days, it indicates that it has entered an oversold state, and a rebound may occur at any time, which can be considered for follow-up.
6. When trading coins, choose leading coins because they rise the most when they go up and are the most resistant to falling when they drop. Do not buy just because the coin price has dropped significantly, and do not hesitate to buy just because it has risen significantly. When trading leading coins, the most important thing is to buy at a high position and sell at an even higher position.
7. Trade in line with the trend; the buying price is not necessarily the lower the better, but the more appropriate the better. Do not easily call a bottom during a decline; let go of underperforming coins. The trend is the most important.
8. Do not get carried away by momentary profits; understand that sustained profits are the hardest to achieve. Review seriously to see whether your profits are due to luck or skill. Establishing a stable trading system that suits you is key to sustained profitability.
9. Do not force trades without sufficient confidence. Staying out of the market is also a strategy; learning to stay out is important. The first consideration in trading should be to protect capital, not to profit. The competition in trading is not based on frequency, but on success rate.
Playing in the crypto space is essentially a contest between retail investors and market makers; if you do not have exceptionally strong professional skills, you can only be cut! If you want to layout together, and harvest the market makers, you can come (WeChat public account: Trend Prediction) to welcome like-minded crypto enthusiasts to discuss together~
Mean reversion trading strategy, I have repeatedly verified a win rate of over 80%! Today I share the method summary, which is worth learning repeatedly!
Mean Reversion is a phenomenon that describes prices returning to an average value. This average can be a moving average, volume weighted average price (VWAP), or other forms of averages such as value lines within a channel. When prices extend too far in either direction, mean reversion often occurs.
Mean reversion trading strategy is a relatively profitable trading method, especially when combined with other technical indicators, chart patterns, or candlestick patterns. Through the resonance of multiple confirmation chart patterns, mean reversion trading often signals trend reversals and brings short-term pullback opportunities.
How to create a mean reversion trading strategy?
The best way to create a mean reversion trading strategy is to study trends. When the prices of stocks and other varieties are in a trend, they usually form a series of higher highs (HH), higher lows (LH), or lower highs (HL), lower lows (LL), depending on the direction of the trend. Keen traders can often find inflection points of oversold or overbought by studying the price charts of these varieties.
When prices enter this overextended area, they may become potential candidates for returning to the mean (average). To create a mean reversion trading strategy, you need the following:
1. Hundreds of price charts annotated with mean reversion examples.
2. Definable features to identify the best entry points for mean reversion trading.
3. Multiple confirmation signals, such as reversal candlestick patterns, top or bottom signals, trend overbought/oversold, and other indicators.
4. The 'mean' or average price to which stocks or other assets may revert as a target price.
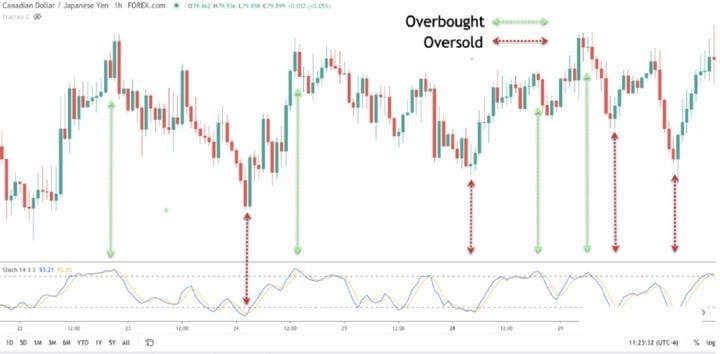
Look at the example of the stochastic indicator below. The upper dashed line within the stochastic indicator represents overbought levels, while the lower dashed line represents oversold levels. Note how price returns to its mean after oversold or overbought values.
Fundamental indicators - If you often pay attention to financial/economic calendars, you will be aware of the many different types of economic data released each month. Some important economic indicators to watch in the forex, futures, and stock markets include central bank interest rate decisions, gross domestic product (GDP), consumer price index (CPI), ISM manufacturing, and the U.S. non-farm payroll report (NFP). For individual stocks, some important fundamental indicators include price-to-earnings ratio, price-to-book ratio, debt-to-equity ratio, and price-to-earnings growth ratio.
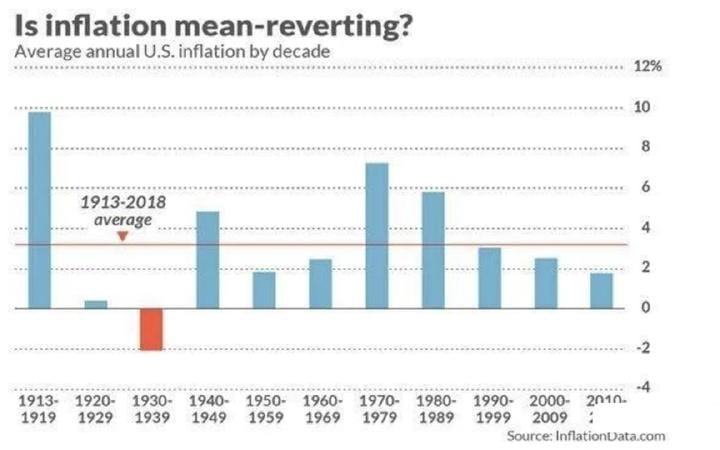
All of the above basic data points can be used in the mean reversion trading model. For example, counter-trend traders can compare the current CPI data with the long-term trends of commodity prices and use that data in their mean reversion models to predict future inflation rates.
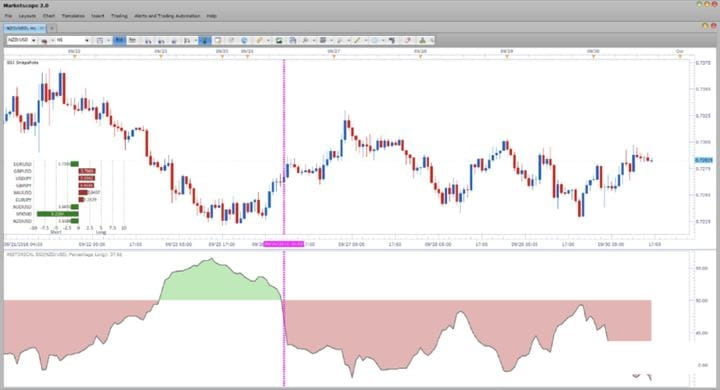
Sentiment indicators - Sentiment indicators can take many forms, but the basic premise of using sentiment indicators is generally the same. That is to say, mean reversion traders typically view extreme values of sentiment indices as a way to gauge the overall sentiment in the market.
Typically, we find extreme ranges of sentiment values, whether bullish or bearish, will lead to price reversals in the market. The underlying concept is that if everyone is bullish, no one will push the price higher, which will cause the price to drop. Similarly, when everyone is bearish, there’s no one left to push the price down, leading to a price increase.
Another popular sentiment indicator frequently used in the futures market is the Commitments of Traders (COT) report, which requires settlement members and futures brokers at futures exchanges to submit futures position reports daily. Typically, we find that when there is an extreme difference between positions of commercial traders (essentially hedgers) and large speculators (primarily speculative funds), prices may be close to a reversal point.
The following weekly copper futures price chart illustrates this phenomenon.
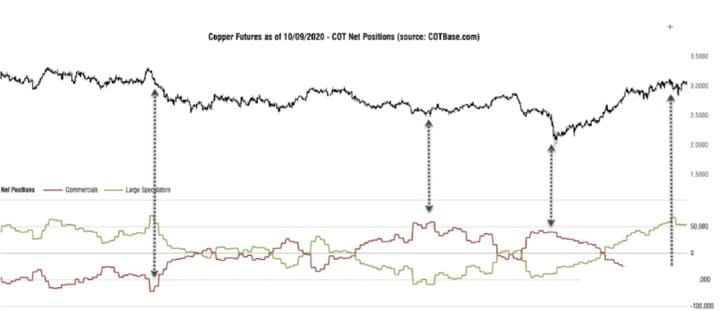
Please note that whenever there is an extreme divergence between commercial traders' positions (red line) and large speculators' positions (light green line), prices tend to follow the commercial traders' positions. Also, pay attention to how the lines start to converge again as prices begin to revert to the mean.
Bollinger Bands mean reversion trading strategy
Now let’s illustrate a practical mean reversion strategy that can be used in the market. In this strategy, we use Bollinger Bands as a signal for volatility mean reversion setup. The strategy we introduce was first proposed by seasoned trader Joe Ross, and is called the Gimmee bar trading strategy.
Essentially, the Gimmee bar trading strategy is used to seek short opportunities at the top of consolidation ranges or long opportunities at the bottom of consolidation ranges. This strategy tends to perform well when prices are in relatively small fluctuation ranges and rarely break through channels.
Long trading signal rules:
Prices should fluctuate within the range and be relatively far from the upper track of the Bollinger Bands;
Prices must touch the lower track of the Bollinger Bands;
Wait for the first bullish candlestick to touch the lower track of the Bollinger Bands. The next bullish candlestick is called a Gimmee bar;
Enter trades above the Gimmee bar;
Set stop losses below the Gimmee bar;
Exit trades when the price approaches or touches the upper track of the Bollinger Bands.
Short trading signal rules:
Prices should fluctuate within the range and be relatively far from the upper track of the Bollinger Bands;
Prices must touch the upper track of the Bollinger Bands;
Wait for the first candlestick to touch the upper track of the Bollinger Bands, and the next bearish candlestick is called a Gimmee bar;
Enter trades below the Gimmee bar;
Set stop losses above the Gimmee bar;
Exit trades when the price approaches or touches the lower track of the Bollinger Bands.
Long trading mean reversion strategy setting
Now let’s look at the setup for the long mean reversion trading strategy. The following diagram is the AUD/USD 4-hour chart:
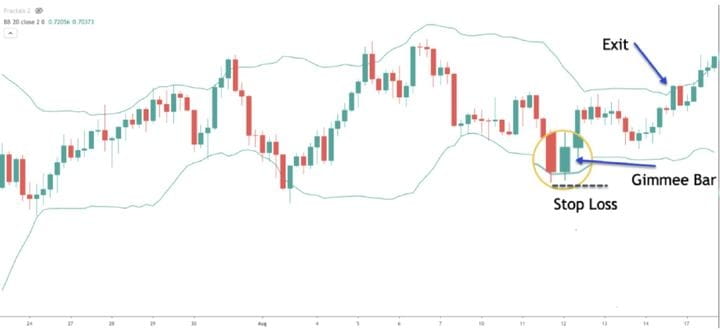
We can see from the above chart that the Bollinger Bands technical indicator (in green), then the price fluctuates within a range, and the distance between the upper and lower tracks of the Bollinger Bands is relatively large. As the price fluctuates, we see characteristics on the chart, and we can consider potential mean reversion trading.
We can see on the chart a larger-bodied bearish candlestick penetrating the lower track of the Bollinger Bands, followed by a bullish candlestick. Therefore, in this case, the second candlestick is considered a bullish Gimmee bar. Under these conditions, a bullish trading signal can be confirmed.
Thus, we enter a long position above the Gimmee bar. Subsequently, we can see that the candlestick following the Gimmee bar ultimately breaks above the high of the Gimmee bar, confirming the bullish pattern. The stop loss is set below the Gimmee bar, as indicated by the dashed line in the diagram. As for taking profits, we need to closely monitor price movements; once it touches the upper track of the Bollinger Bands, we will exit immediately.
Short trading mean reversion strategy setting
The following diagram is the USD/NOK daily chart:
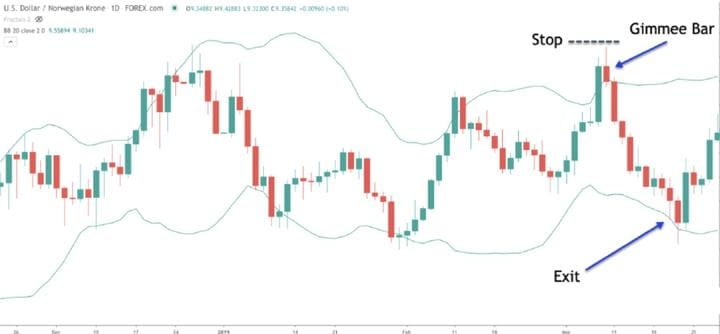
Similarly, the green lines of the Bollinger Bands represent the upper and lower tracks. We can see that prices fluctuate within a range, and the distance between the upper and lower tracks of the Bollinger Bands is relatively large, indicating that the market has not found a clear direction. Once this market environment is confirmed, we can use mean reversion trading strategies.
We can see in the chart above that a strong bullish candlestick penetrates the upper track of the Bollinger Bands. Based on this, we want to wait for a bearish candlestick to confirm a short setup. Following this bullish candlestick, we see a bearish candlestick, which is the bearish Gimmee bar.
Thus, we can establish a short position below the Gimmee bar. The stop loss is set above the high of the Gimmee bar, as shown by the dashed line in the diagram. Finally, when the price touches or falls below the lower track of the Bollinger Bands, exit for profit immediately.
Which moving average is best suited for mean reversion?
Generally, the 10SMA (Simple Moving Average), 20EMA (Exponential Moving Average), and 50SMA are the most commonly used moving averages in mean reversion trading. However, to use moving averages for mean reversion trading, you need to experiment with some more common simple moving averages and exponential moving averages. Different time period charts often have different moving averages that are more suitable for that time period. Therefore, try as many as possible until you find the right moving average combination.
In the example of this article, we used 10SMA, 20EMA, 50SMA, and 200SMA. In our trading practice, we found that these moving averages usually indicate short-term, medium-term, and long-term trends well. Therefore, these moving averages often become targets for mean reversion trading in stocks during their upward or downward paths. In other words, these moving averages are typically the best targets for mean reversion trading.
Example of mean reversion trading using moving averages
In the example of GOOGL, we are in a robust upward trend environment. The macro backdrop is a strong bull market. In a strong bull market, one should clearly look for long opportunities, as this is the direction for obtaining 'easy profits.'
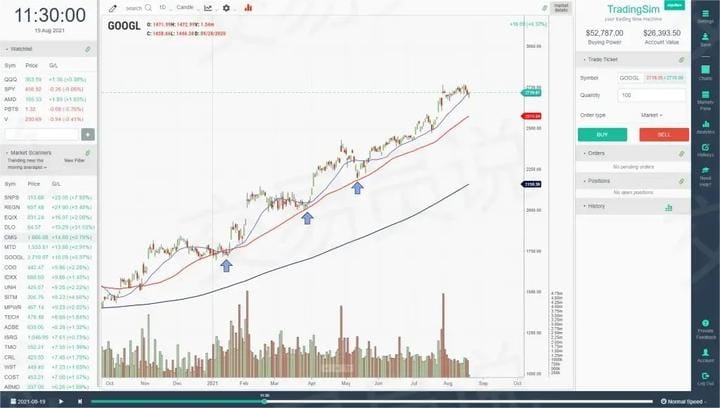
In this example, we used the blue 20EMA (Exponential Moving Average), the red 50SMA (Simple Moving Average), and the black 200SMA. Try to imagine these three moving averages and their interrelationships in your mind. Note that when the distance between the 20EMA and 50SMA widens, it often indicates that the price will pull back to the 50SMA for 'confirmation.'
In a healthy trend, prices may exhibit a stepwise rise until reaching a climax trend turning point, which is usually a signal for the end of the trend. For this mean reversion trading strategy, the entry conditions are very simple. As indicated by the blue arrows, you need to confirm support near the 50SMA, then enter long when the price rebounds and crosses the short-term moving average while increasing in trading volume, entering at the 'Pocket Pivot.'
Mean reversion trading based on channels
If you do not like using moving averages, then channels can be a great tool for determining trend support and resistance, whether vertical or horizontal trends. Channels not only help you visually identify support positions at low points but also indicate resistance positions at high points.
The best way to draw the mean reversion channel is to connect the two ends of the two points when a new trend forms. After drawing this line, copy it to the other side of the trend channel. The more channels you study, the better you can judge support and resistance positions in the early stages of the trend.
After drawing the channel line, trading becomes a predictive behavior, aiming to find the mean reversion point within the channel - that is, the value line at the upper and lower ends of the channel or in the middle of the channel.
Mean reversion trading example based on channels
Next, let’s continue using the previously mentioned GOOGL chart, but this time using channels instead of moving averages. Pay close attention to how GOOGL occasionally breaks through the upper limit of the channel. This is a very important observation point.
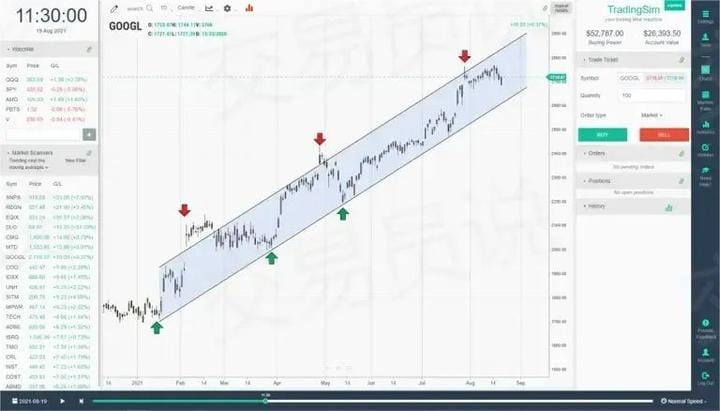
Breakthroughs of the channel often mean acceleration of price movement. You need to pay close attention to these events, as they often indicate price reversals. These breakthroughs are very similar to 'springs' and 'upper spikes' in horizontal channels. When the price accelerates and then falls back into the channel, this provides a clear entry signal with a defined risk area, which is usually located above or below the breakout price area.
If you hold a long position, this is also a good method to determine when to partially take profits during peak price actions. As shown by the green arrow in the channel above, the support area provides a high risk-reward ratio for adding positions. We call this method 'phased operations' on stocks: taking some profits along the way, and then adding positions again in the support area.
Application of mean reversion trading in a downward trend
For mean reversion trading of stocks in a downward trend, the pattern is no different from mean reversion trading of stocks in an upward trend, it’s merely a mirror image. In this case, you need to look for sustained weakness in the stock, in other words, rebounds often encounter resistance near the mean reversion of the channel.
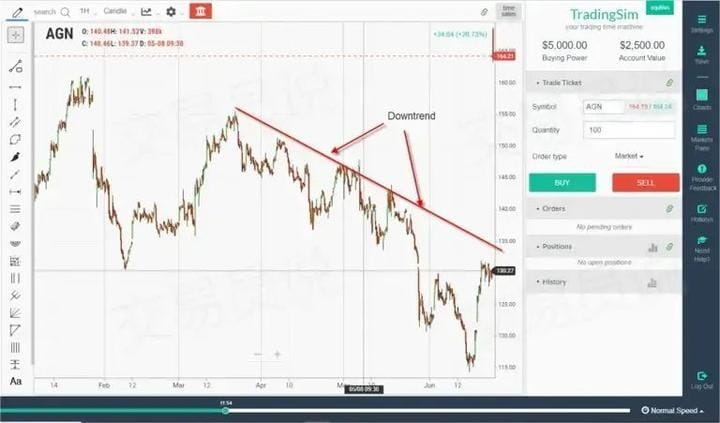
When asset prices approach the mean, your goal is to assess the strength of the pullback and the broader context of the stock or overall market. In any case, these resistance areas usually provide very good risk-reward ratios for short trading.
However, you need to be aware that, as shown in the above chart, stocks may ultimately become extremely oversold. Observe how it breaks below the channel's lower limit and enters a free-fall state. This provides you with another opportunity to utilize mean reversion trading, known as the parabolic reversal strategy.
Mean reversion in parabolic stocks
When a stock exhibits a parabolic trend, it often becomes a target for many traders who hope to profit from mean reversion trading. Although the momentum of the stock's rise or fall may be more sustained than many traders expect, it cannot rise or fall indefinitely. Eventually, supply and demand will reverse the trend.
But how do you correctly grasp the timing? First, let’s compare the differences between parabolic stocks and healthy trend stocks through the following two images:
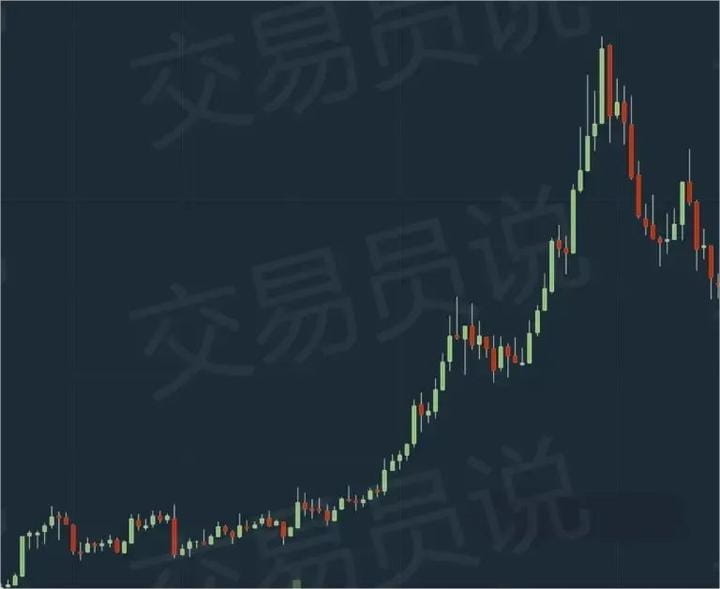
Please note that the first image with a white background shows that the price runs in a steady upward trend.
The second image with a black background shows a parabolic trend.
The difference between the two lies in the steepness of the slope. In parabolic stocks, traders' fear of missing out (FOMO) emotions often reach unsustainable peaks.
The higher it rises, the more severely it falls. But to seize mean reversion trading opportunities, you need to pay attention to the following points:
1. Bearish candlestick patterns
2. Potential resistance areas on longer-term cycles
3. If the latter does not exist, you need to combine multiple time period charts or the extension of moving averages to make judgments.
Mean reversion examples in parabolic stocks
Let’s dive into analyzing the aforementioned parabolic stocks and discuss how to utilize the bearish engulfing pattern to seize entry timing in trend acceleration. The following is a practical case, stock code $EYES:
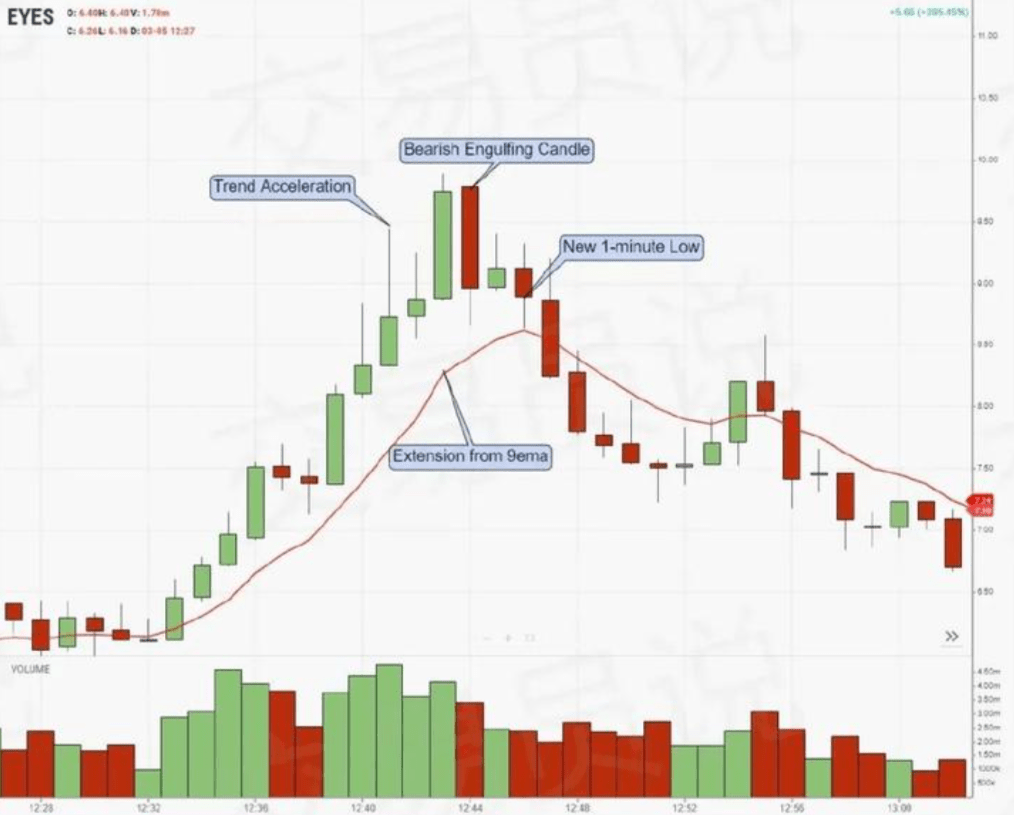
When the trend accelerates, you will notice that the stock has pulled away significantly from the 9-EMA on the 1-minute chart. Then, it breaks through and squeezes the initial two hammer candlesticks, followed by forming a large red bearish engulfing line, ending the upward momentum and leading to two lower highs in the latter half of the trade.
The elements confirming this trade include:
◎ Overextension of multiple time frames (such as 1-minute and 5-minute charts)
◎ Price acceleration
◎ Increased trading volume
◎ Stay away from moving averages
◎ Confirmation of bearish candlestick patterns
◎ Lower highs
In summary, these factors combined create a great opportunity to short stocks and revert to the mean. So, where should the target level be?
Finding targets for mean reversion trading
One of the best ways to find targets for mean reversion trading is to combine moving averages and VWAP (Volume Weighted Average Price). VWAP is an indicator calculated based on the volume-weighted average price of stocks during the day. For day traders, it is a good tool for locating targets for price reversion to the mean.
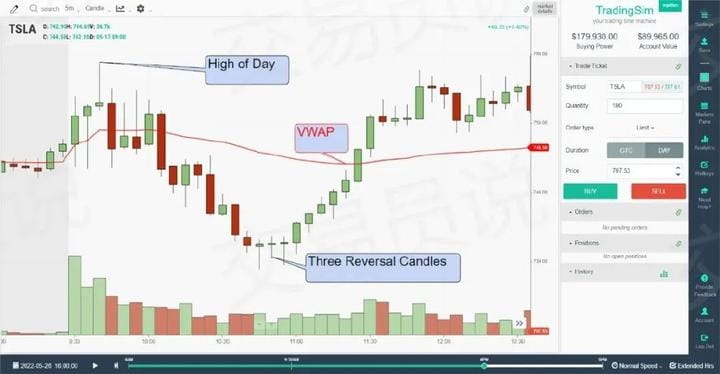
In this example using TSLA, we observed an unsustainable sharp drop during the morning trading session. After confirming three bullish reversal candlesticks and a gravestone doji pattern, TSLA's price quickly rebounded to the red VWAP line.
If you execute this trade based on the concept of mean reversion, you will have two target levels. The first target level is the VWAP line, and then by using trading management techniques, you can set a stop loss below the candlestick that breaks the VWAP, leaving room to pursue higher prices. As the price continues to rise, you only need to adjust the stop loss to below each new high candlestick.
If you adopt this trading management rule, you can lock in half of your profits at VWAP, and then hold your position while waiting for the price to rush towards the day's high point as a second target. In this case, you might be stopped out around the $753 area, which is $9 above VWAP!
How to practice mean reversion trading strategies?
The best way to practice mean reversion trading strategies is to operate in simulated trading. When learning mean reversion strategies, it is essential to engage in simulated trading and statistically analyze your trading data on the built-in analysis page. As your success rate improves, you will gain confidence in applying mean reversion strategies in real market environments.
Summary
Mean reversion trading strategies provide a method for identifying high-probability trades during extreme market volatility. This strategy focuses on short-term, precise aggressive trading. Since the strategy is based on volatility, it is unaffected by the overall trend of the market at that time.
One very important point when using mean reversion trading strategies is to be cautious, as a significant drop may indicate a change in fundamental factors and may not revert to the 'mean.' Therefore, this strategy is suitable for traders with a higher tolerance for risk, as trades are often conducted during periods of high market volatility. The frequency of trading is also often concentrated during these market fluctuations; mean reversion is a system in which you can truly call yourself a 'trader.'
As a mean reversion trader, your goal is to precisely grasp the timing to enter the market, allowing you to profit during the process of rising stock prices, a rise driven by reverting investors.
Let’s look at a simple example:
Use 200MA as a trend filter (above the moving average indicates an upward trend);
When the 2-day cumulative RSI value is less than 33, enter a long position at the opening of the second day;
Exit when the 2-day RSI is above 20 (at the opening of the second day).
Taking the S&P 500 Index as an example, using this very simple strategy will yield very satisfactory results. You can think of this strategy as a combination of trend trading and mean reversion trading. The entry point selection must be above the long-term average level, which is a signal of an upward trend. However, we buy when the market has an aggressive downward movement trend. This is to take advantage of mean reversion in the trend. This is the equity curve of this special strategy:
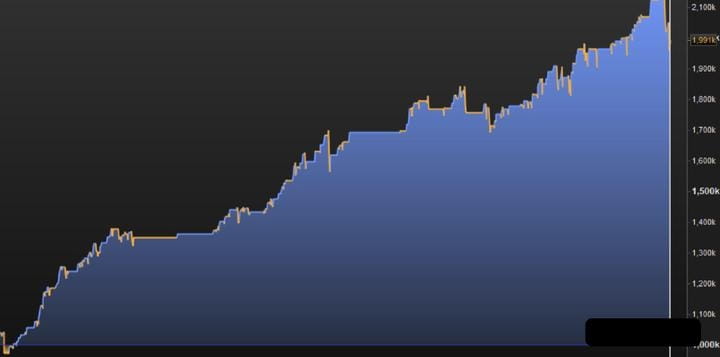
It is reported that this strategy's win rate can reach about 80%. Of course, this is just an example, illustrating that trends and mean reversion can be simultaneously used to create trading strategies.
From the above, we can see that the two trading styles each have their own characteristics. If you find yourself standing on one side of the argument, then finding a way to combine both is a real solution.
When formulating strategies, avoid dogmatic ideas like 'the trend is your friend'; maintaining flexibility is always beneficial for your trading.
I am Ah Peng, having experienced multiple rounds of bull and bear markets, with rich market experience in various financial fields. Here, I penetrate through the fog of information to discover the true market. Seize more wealth opportunity codes, discover truly valuable opportunities, and don't miss out and regret!
Ah Peng only conducts real trading; the team still has positions available, hurry to join #加密市场回调 $BTC$ETH
