First, let's have a quick experience! Only through personal experience can one gain insights.
Let's experience the complete process once from deposit → trading (profit or loss) → withdrawal. The aim is to understand initially how to deposit, what trading methods are available, how money is made or lost, and then how to withdraw. Once we have this preliminary understanding, we can consider the purpose of entering the cryptocurrency market. It is recommended to try with (100-200U).
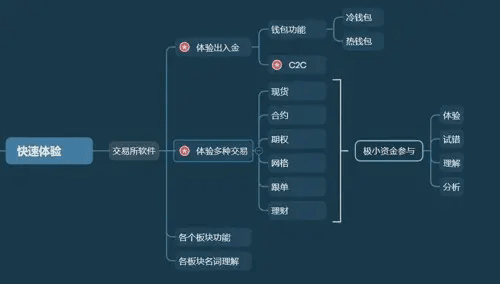
Step 1: Download the registration of the exchange
Only recommend Binance exchange, other exchanges are not recommended, protecting the principal is very important!
Software download: You can open the invitation link given to you by someone in the circle using a browser to register and download (no VPN needed) or download it yourself (Apple needs an overseas ID, and Android can download from the Google Play Store, which also requires a VPN).
Having been in the circle for 10 years, I have seen too many exchanges go bust and large profits that cannot be withdrawn! So choosing a reliable exchange is extremely important!
After downloading, follow the process to register and authenticate your account.
Wallet: Used to store coins, but it is also possible to keep coins in the exchange without using a wallet.
Step 2: Buy U (USDT).
What is U? U is the circulating currency in virtual currencies, also known as fiat currency! You can understand U as the US dollar! Because in the virtual currency circle, U (which is fiat currency) is used as the unit of capital; trading stocks is in yuan, while trading cryptocurrencies is in U.
1 USDT is currently about 7.2 yuan (subject to slight fluctuations with exchange rates).
There are dedicated merchants within the exchange to buy and sell USDT; just input the quantity you want to purchase.
When buying U, you can choose Alipay, WeChat, or bank card. According to the platform instructions, first pay the merchant, and once the merchant confirms receipt of payment, they will deposit U into your account!
Merchants here are guaranteed by the platform; trading USDT is only recommended within the platform. Do not conduct offline transactions, as the chances of being scammed are very high!
Do not trust strangers claiming low exchange rates here; this is the easiest way to get scammed!
The way their merchants make profits is by buying low and selling high! These platform merchants won't run away, so you can trade with confidence, as they have paid substantial collateral to the platform!
Step 3: Deposit and withdrawal and transfer.
After years of development, the functionality of exchanges has become very complete, meeting the needs of most people. The concerns many have are addressed in the following response, which I hope can provide you with a clear answer.
1. Deposit and withdrawal tutorial.
1.1 Preparation before deposit and withdrawal.
Several foundational concepts that need to be understood first:
CNY refers to the Chinese yuan. The yuan cannot be traded directly with cryptocurrencies, so it is necessary to first convert yuan to USDT, which involves the process of deposits and withdrawals.
Deposit: Convert CNY to USDT.
Withdrawal: Convert USDT to CNY.
USDT: A cryptocurrency pegged to the US dollar at a 1:1 ratio, issued by the US company Tether; it can be understood as US dollars.
1.2 Precautions for deposits and withdrawals.
Only deposit and withdraw from Binance; these two have strict screening for merchants, and merchants need to collateralize funds at the exchange, so if something goes wrong, the exchange can help you.
When selecting merchants, click on the merchant's avatar to see detailed information. As a rule of thumb, the more collateral they provide and the longer they have been registered, the more reliable they are. Try to choose merchants with collateral of over 100,000 USD and registered for over a year.
Do not deposit and withdraw funds frequently, as doing so too often can lead to problems. Also, do not choose unreliable merchants just for a small discount. Some merchants may offer significant discounts to quickly dispose of dirty money. In the cryptocurrency circle, do not pay attention to a one or two percent difference; there will be places for you to make money later.
Different merchants have different upper and lower limits for trading, and the supported payment methods also vary. Choose one based on your needs. After entering the amount of USDT you want to buy, ask the merchant for their payment information.
The first-time seller will need you to provide recent trading records.
Screenshot it for them, mainly to prevent receiving dirty money. Once the seller sees that your trading records are fine, they will give you their payment account. After you pay them, you can receive USDT. I have personally tried this many times, and it is fine. However, if it is your first time, to prevent errors, first conduct a small deposit to go through the process and avoid losses.
2. Spot trading tutorial.
2.1 Preparations before spot trading.
Understanding what spot trading is, using Bitcoin as an example:
Buy spot: Use USDT to buy Bitcoin.
Sell spot: Sell Bitcoin to obtain USDT.
After the deposit is received, USDT will be in the [Fund Account]; coins in this account cannot be traded yet. You must transfer the coins to the [Trading Account] to trade them.
Step 4: Choose a trading category.
The first type is spot trading (coin-to-coin), similar to stocks and funds. You can only profit if the coin rises! You cannot short!
The second type is perpetual contracts (commonly referred to as futures), which allow for short selling, going long, and leveraging!
There are two major trading methods in the cryptocurrency space: spot and futures, with trading available 24/7. It is similar to trading stocks and futures.
The difference is that the spot can only go long, while futures can go both long and short, and futures can be leveraged up to hundreds of times.
Regarding the risks and returns of these two, objectively speaking, spot trading of altcoins may go to zero or increase a thousandfold; futures also have leverage and can increase a thousandfold with rolling contracts and liquidation. Overall, benefits and risks coexist; if you pursue high returns, you will face high risks.
Simply put, spot trading means buying specific coins. After purchasing, you can keep the coins in an exchange or a wallet (hot wallet or cold wallet). Sell when the price rises to realize profits; conversely, you incur losses.
Perpetual contracts are anchored to spot prices but have no delivery date. In simple terms, they predict price trends; if you expect prices to rise, you go long, and if you expect them to fall, you go short, with the option to close positions anytime.
I believe there is no difference between these two trading methods; spot trading won't liquidate, while futures can short in bear markets. Both have their pros and cons, but the most important factor is the trader's mindset and self-control.
However, most people have average self-control, so many strongly advise not to trade futures, suggesting to hold onto coins and wait for a bull market to sell. The reality is that most people cannot hold onto their profits and end up selling at a loss. Most people tend to want to exit after small profits, but are reluctant to cut losses and wish to quickly recover their losses, which is human nature. However, futures leverage can fully expose your true nature, and only after suffering significant losses might one wake up.
Everyone understands the reasoning, but others will also tread on a few pits to feel comfortable. I just want to remind everyone that there is a pit in a certain place, so be cautious when stepping.
Remember not to invest in debt or high leverage.
High-frequency trading.
My cryptocurrency trading method is very simple and practical. I reached an eight-digit figure in just one year, only entering the market when I see an opportunity, and I do not trade without a clear setup. Over five years, I have maintained a win rate of over 90%!
In forex, futures, and other trades, an ideal 15-minute trading strategy involves applying technical indicators such as moving averages, Bollinger Bands, and Relative Strength Index (RSI), combined with robust risk management techniques. Effectively using these tools helps us find accurate entry and exit points, which is especially critical for short-term trading styles.
The key to this strategy is to execute strict stop-loss orders and adjust position sizes based on current market volatility.
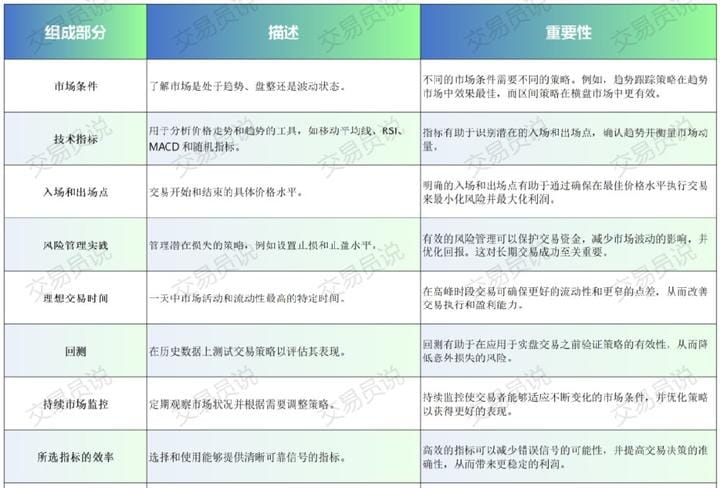
Key components of 15-minute trading strategies.
Successful 15-minute trading strategies depend on several key factors, including market conditions, precise technical indicators, clear entry and exit points, strict risk management measures, ideal trading timing, rigorous backtesting, ongoing market monitoring, and the efficiency of the selected indicators.
Using relatively tight stop-loss levels and tailored take-profit levels is very important. For example, a typical suggestion might be to set a stop-loss at 10 points with a take-profit at 20 points, effectively protecting traders from significant capital losses while locking in potential profits.
Adjusting position sizes based on volatility and current market conditions can strengthen this protective framework, ensuring that each trade is proportionate to the assessed risk (a 2:1 reward-to-risk ratio).
Effective technical indicators for 15-minute trading.
Due to their responsiveness and accuracy, several tools stand out in assessing the effectiveness of technical indicators in 15-minute trading cycles. Moving averages and Bollinger Bands provide detailed insights into market trends and volatility, making them extremely useful in short-term trading analysis.
The Relative Strength Index (RSI), Parabolic SAR, and Average Directional Index (ADX) help identify potential reversal points and maintain market momentum, enhancing your trading decisions.
Moving Averages.
Using moving averages, especially the 5-day and 10-day moving averages, can simplify trend analysis and help determine market fluctuations in the 15-minute trading chart. These short-term moving averages are often used when executing momentum trading strategies, focusing on capturing rapid market changes caused by volatility in currency pairs.
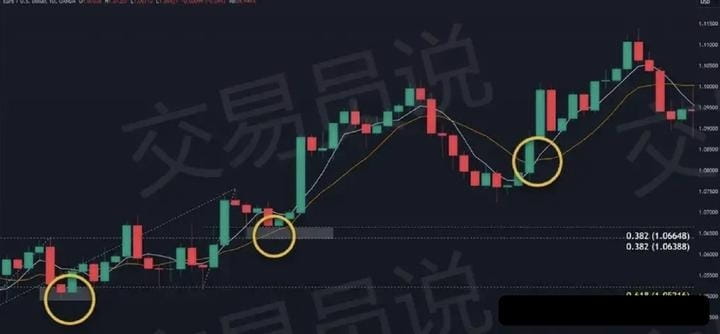
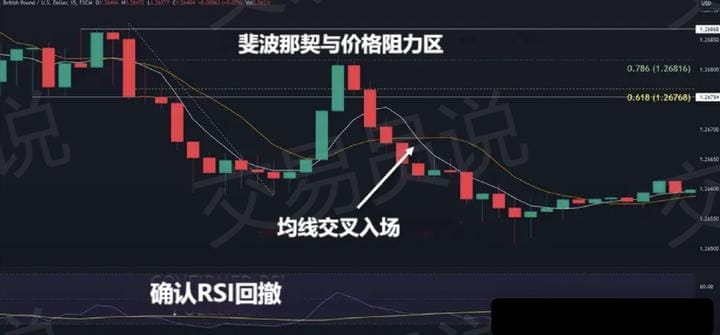
The moving average crossover technique is a major aspect of this method. When the 5-day moving average crosses above the 10-day moving average, it indicates a potential buying opportunity; conversely, it signals a sell when the opposite occurs.
These moving averages also help traders identify support and resistance levels, which are crucial for trend-following strategies within this compressed timeframe. By understanding the position of these levels, traders can better predict potential reversals or trend continuations, thereby improving decision accuracy.
Combining Fibonacci retracement with moving averages provides another framework for price action analysis. Through this combination, traders can identify important price points and adjust their strategies to ensure alignment with the micro fluctuations and overall trends displayed in the 15-minute chart.
Relative Strength Index (RSI).
The Relative Strength Index (RSI) is used to identify overbought and oversold conditions in 15-minute trading strategies. This momentum oscillator measures the speed and change of price movements, with values ranging from 0 to 100.
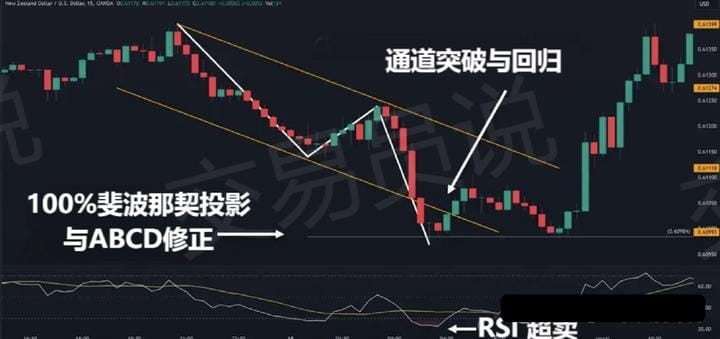
Typically, an RSI (Relative Strength Index) below 30 indicates an oversold state, suggesting a potential buying opportunity, while above 70 indicates an overbought state, signaling a possible sell-off. Traders commonly use these thresholds to predict reversals when the market reassesses prices.
RSI also provides signals for trend confirmation. When the RSI is consistent with the current price trend, it confirms the current momentum, allowing traders to strengthen their positions accordingly. For example, in a bull market, an RSI above 50 supports the continuation of an uptrend. In a bear market or during price declines, an RSI below 50 can confirm a downtrend.
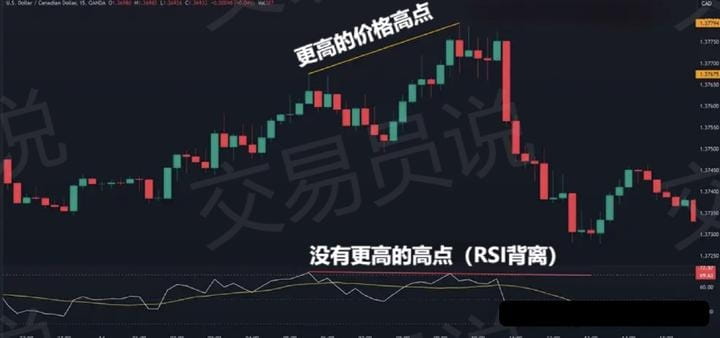
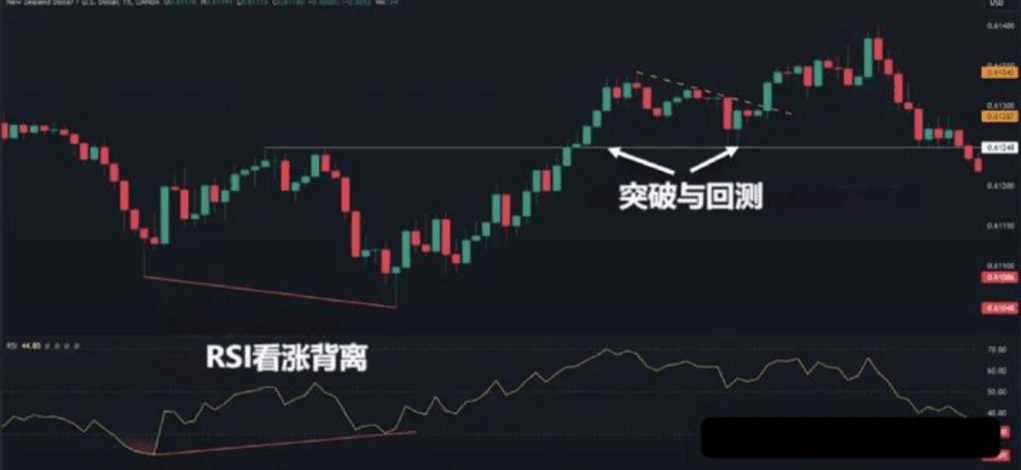
RSI divergence plays an important role in identifying changes in market dynamics. When the RSI diverges from the corresponding price trend—i.e., the price makes a new high or low, but the RSI does not—it usually indicates a weakening trend and may suggest a reversal.
This inconsistency between price and RSI can be a powerful signal to re-evaluate positions, thereby enhancing the effectiveness of short-term trading strategies.
Bollinger Bands.
Bollinger Bands can help traders assess market volatility and identify potential breakout points in 15-minute trading strategies. By placing price movements within dynamic 'envelopes', these indicators adjust according to recent price fluctuations, making them particularly suitable for the fast decision-making required in the 15-minute timeframe.
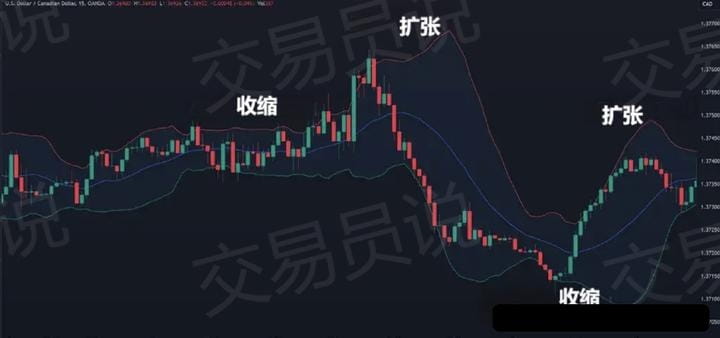
◎ Bollinger Band Squeeze (Contraction): When Bollinger Bands tighten around the price, it indicates reduced volatility, often signaling significant price movements. Traders watch for breakouts after squeezes as entry signals.
◎ Breakouts and Reversals: Price breakouts can signal impending reversals or trend continuations, which are crucial for rapid profit-taking in 15-minute charts.
◎ Bollinger Band Width: This indicator helps quantify market volatility. A narrowing width indicates potential compression, while a widening width indicates increased volatility.
◎ Touch Points: Prices touching the lower or upper bands can serve as key trading signals, indicating overbought or oversold conditions.
Each of the above aspects ensures that Bollinger Bands become an integral part of effective trading within short time frames (especially during squeezes), providing insights into market dynamics (especially during consolidation).
Parabolic SAR.
Another effective technical indicator applicable to 15-minute trading strategies is the Parabolic SAR, which performs excellently in setting trailing stop-loss and exit timing. This indicator is renowned for its ability to provide clear exit signals, enhancing risk management techniques for short-term traders.
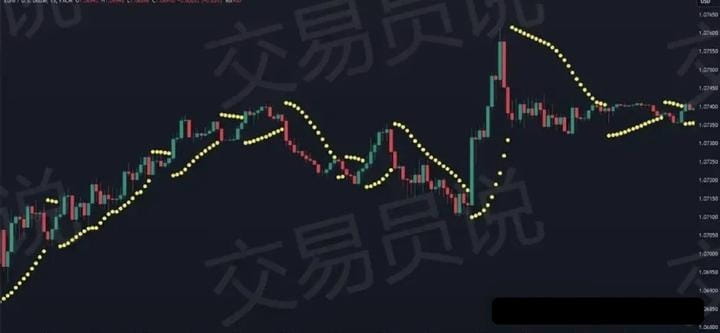
In analyzing the Parabolic SAR strategy, backtest results show that this indicator performs well in trending markets. Traders often use it to determine stop-loss levels, effectively protecting profits or preventing significant losses. By adjusting the acceleration factor, traders can fine-tune the indicator's sensitivity to align with their trading strategies.
When comparing the Parabolic SAR with other indicators, its effectiveness is highlighted by its simplicity and direct visual presentation on charts. Unlike more complex indicators, the Parabolic SAR provides direct, actionable information without extensive explanation, which is crucial in the fast-paced 15-minute trading window.
Average Directional Index (ADX).
The Average Directional Index (ADX) is crucial for quantifying trend strength and identifying current market trends. Traders rely on ADX to show the strength of trends. Understanding ADX is important under various market conditions, as it provides a clear perspective on whether trends are strengthening or weakening.
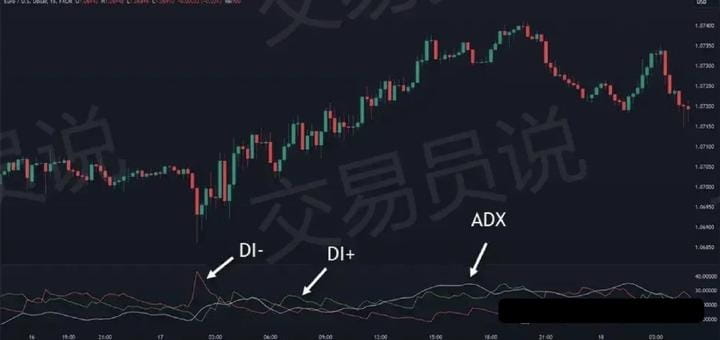
When trading within a 15-minute timeframe, ADX provides important information:
◎ Trend Confirmation: An ADX value above 25 indicates a strong trend, laying a reliable foundation for trend-following strategies. This level of trend strength is crucial for confirming potential entry signals.
◎ Detecting Trend Weakness: A decline in the ADX value indicates a weakening trend and alerts traders that market conditions may change or that caution is warranted.
◎ ADX Cross: When +DI (Positive Directional Indicator) and -DI (Negative Directional Indicator) cross, it may indicate a trend reversal, guiding traders on when to potentially exit or enter opposite positions.
◎ Filtering Market Noise: By distinguishing trending markets from ranging markets, ADX helps filter out trading setups with lower profit potential, focusing on those with a higher probability of success.
Stochastic Oscillator.
Based on the Average Directional Index, the Stochastic Oscillator can also serve as a tool for identifying overbought and oversold conditions in 15-minute trading. This indicator is particularly suitable for short-term traders looking to capitalize on rapid market fluctuations.
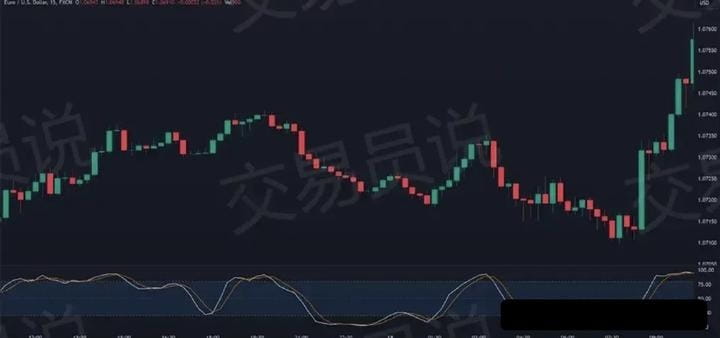
The Stochastic Oscillator involves two lines: %K, which measures the current price relative to the highest and lowest prices over a specified period; and %D, which is the moving average of %K. When %K breaks above %D in the oversold zone (below 20), it usually indicates a potential buying opportunity. Conversely, when %K breaks below %D in the overbought zone (above 80), it typically signals a sell.
The settings for the Stochastic Oscillator can be adjusted; however, on a 15-minute chart, traders typically use a 14-period %K and a 3-period %D. These settings help smooth the output of the indicator, making signals clearer, especially in short-term trading, where frequent price fluctuations can easily disrupt signals.
Recognizing divergences in the Stochastic Oscillator can enhance trading accuracy. When prices form new highs or lows without corresponding changes in the Stochastic Oscillator, a divergence occurs, suggesting that price may reverse. Divergences can serve as clues indicating possible strength changes in price movements that may not be evident in pure price action.
SuperTrend.
In 15-minute trading, another important indicator is SuperTrend, which effectively identifies trend direction and sets ideal stop-loss levels. The advantage of SuperTrend lies in its simplicity and clarity, enabling it to accurately signal bullish or bearish market sentiments.
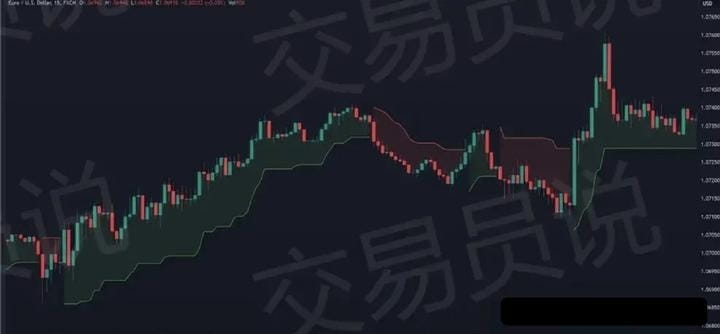
SuperTrend combines price volatility and Average True Range (ATR) factors to determine the position of trend lines. This helps traders make informed decisions quickly based on current market conditions, especially suitable for short-term trading like in the 15-minute chart.
When configuring SuperTrend settings, traders typically adjust the ATR multiplier and period to suit the volatility and price dynamics of the trading asset. Adjusting these settings is crucial for enhancing the indicator's sensitivity to price fluctuations, thereby improving the accuracy of trend predictions and the effectiveness of stop-loss orders.
Identify entry and exit points.
Identifying precise entry and exit points on a 15-minute forex chart requires the use of technical indicators and chart patterns to quickly capture short-term price fluctuations. Traders must analyze multiple trading indicators and patterns to make informed decisions rapidly.
The following are important tools and concepts for determining entry and exit points:
◎ Candlestick Patterns: Use common 15-minute candlestick patterns, such as engulfing patterns, hammer lines, or shooting stars. These patterns can indicate potential reversals or trend continuations, providing clear signals for entry or exit.
◎ Fibonacci Retracement: Apply Fibonacci retracement levels to identify potential reversal points in the short term. These retracement levels often serve as support or resistance, where prices may pause or reverse, making them very important in fast trading.
◎ Support and Resistance Levels: Strong support and resistance levels are crucial in 15-minute trading. They provide areas where prices may pause or reverse. Identifying these levels helps develop entry plans for breakout or rebound trades, as well as setting precise stop-loss or take-profit points.
◎ RSI and Moving Averages: Combine RSI with moving averages (such as the crossover of 5EMA and 20EMA) to confirm entry signals. RSI helps identify overbought or oversold conditions, while moving averages are used to determine trend direction and momentum, assisting with timely execution of trades.
Three common 15-minute forex trading strategies.
Due to their effectiveness and adaptability, several strategies are widely used.
The opening range breakout strategy utilizes early market volatility to establish profitable positions.
In contrast, breakout backtesting strategies and trading bull flags provide methods to identify and capitalize on patterns for potential gains within this short timeframe.
Forex pairs opening range breakout strategy.
The opening range breakout strategy utilizes the volatility of the first 15-minute candle after the London session opens by placing trades at its high and low points to profit. This method takes advantage of the initial price fluctuations that occur at the opening of the most popular forex session.
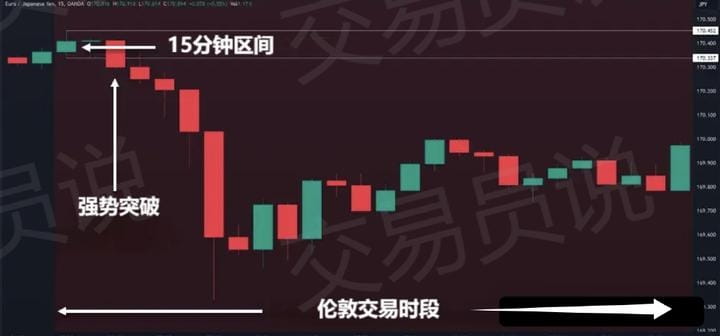
By focusing on price behavior during this time period, traders can see potential directional trends based on the strength of the market after the opening.
◎ Visualizing Candlestick Charts: The first 15-minute candlestick is crucial; its upper and lower shadows represent potential breakout points.
◎ Market Entry: Traders set buy orders above the high of that candlestick and sell orders below its low, aiming to capture rapid fluctuations.
◎ Volatility Analysis: Assessing the size and shape of the opening candlestick can provide insights into early market sentiment and potential volatility.
◎ Trend Identification: Successful breakouts may confirm or establish trend direction, guiding subsequent trading decisions.
The opening range breakout forex strategy utilizes candlestick patterns to identify trading opportunities by observing price behavior and market volatility, ensuring that traders remain aligned with the market's initial momentum.
Breakout Backtest Strategy.
While the opening range breakout strategy takes advantage of early market volatility, the breakout and backtest strategy focuses on capturing price movements after retesting key support or resistance levels. This currency trading method is based on the principle that once key levels are broken, the price is likely to retest that level before continuing the trend.
Traders using this method will observe breakout patterns on higher time frames (such as 1-hour or 4-hour charts) to determine relevant support or resistance levels for currency pairs.
Once these levels are determined, the strategy will shift to a 15-minute chart, focusing on pullback rebounds. The core of this strategy is to enter trades during these rebounds, taking advantage of the frequent small fluctuations that occur when prices retest previously broken levels. This method not only aids in trend identification but also enhances the accuracy of entry and exit points when trading major currency pairs.
The execution method for the breakout backtest strategy is as follows: Identify breakouts, wait for backtesting, then execute trades based on confirmation of trend continuation on the 15-minute chart. This method aims to maximize profits from short-term fluctuations in currency, making it an effective strategy for day traders to exploit rapid rebounds in a structured manner.
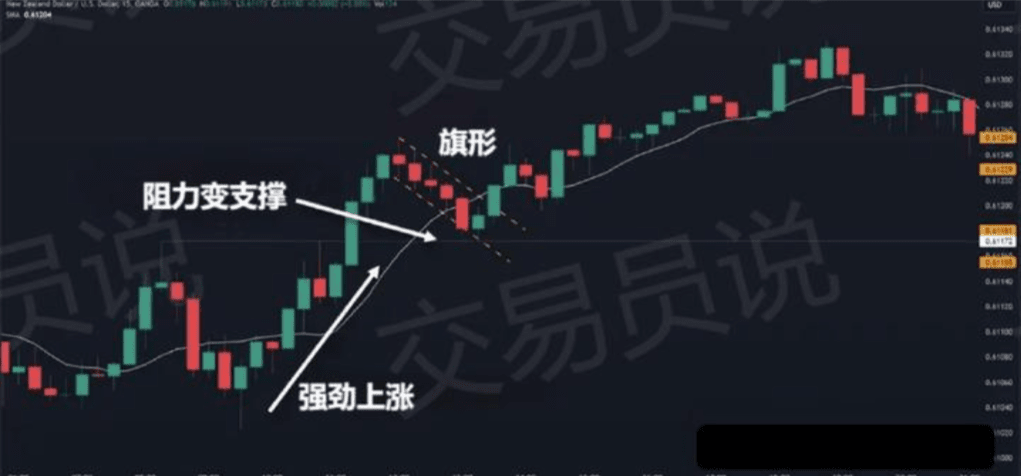
Trading Bull Flags.
Among various 15-minute trading strategies, trading bull flags stands out for its efficiency in utilizing price uptrends after consolidation periods. This method takes advantage of the formation of the 'bull flag' pattern, characterized by a sharp price increase followed by a brief period of consolidation or downward correction, resembling a flag on a flagpole.
To effectively use bull flags within a 15-minute trading window, traders should focus on several key factors:
◎ Flag Pattern Analysis: Carefully examining the flag structure is crucial. A true bull flag typically exhibits a sharp rise of the flagpole, followed by a rectangular flag shape that consolidates downward or sideways with no significant changes in volume.
◎ Volume Confirmation: Successfully trading bull flags requires validation through volume analysis. Ideally, breakouts should be accompanied by increased volume, confirming the strength of the pattern and the likelihood of trend continuation.
◎ Pattern Reliability: Historical data should be assessed to understand the reliability of flag patterns under similar market conditions.
◎ Entry and Exit Points: Precisely identifying entry points during flag breakouts and strategizing exit points to maximize profits is crucial.
Risk management in 15-minute trading.
In 15-minute trading, effective risk management depends on implementing precise stop-loss and take-profit orders to protect capital and maximize profits. Employing a disciplined position sizing management approach is also important.
By following the 1% rule (especially as a beginner), traders ensure that the risk of a single trade does not exceed 1% of their total trading capital, maintaining a controllable risk exposure amidst market fluctuations.
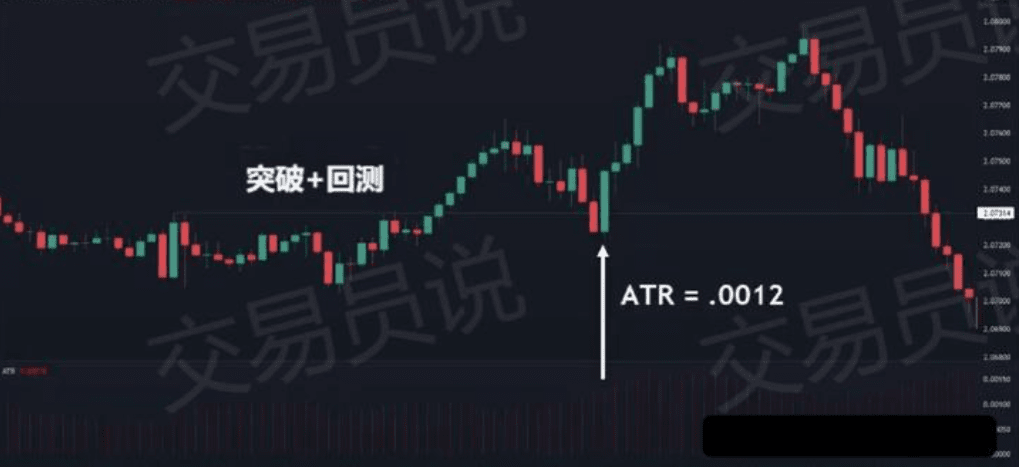
Technical indicators like Average True Range (ATR) can be used to align stop-loss orders with current market volatility. This approach helps adapt to normal price fluctuations without exiting the position too early.
Setting stop-loss orders outside key support and resistance levels can provide enough space for trading while still preventing significant losses.
Trading psychology should not be overlooked. Maintaining emotional discipline by adhering to pre-set stop-loss and take-profit levels helps mitigate the impact of emotional trading decisions, which are often significant in short-term trading scenarios.
Regularly reviewing and adjusting these orders according to changing market conditions is crucial for effectively responding to market fluctuations and protecting trades from sudden shifts in market sentiment.
Backtesting and optimizing trading strategies.
Backtesting 15-minute trading strategies requires a method to verify their effectiveness and adaptability under different market conditions. Analyzing historical data, assessing risks, and performance analysis are crucial for optimizing strategies and enhancing their potential profitability.
Below are best practice guidelines for backtesting and optimizing such strategies.
● Use sufficient historical data: Ensure that the data covers various market conditions, including trends, volatility, and consolidation periods. This diversity tests the robustness and adaptability of the strategy.
● Incorporate real trading conditions: Consider slippage, commissions, spreads, and execution delays to simulate real market conditions. This step is crucial for accurate performance analysis.
● Conduct advanced statistical analysis: Use techniques like measuring standard error to understand the uncertainty and risks related to strategies. Additionally, calculate the expected value of strategies to predict potential profitability.
● Conduct forward-looking analysis and continuous optimization: After initial backtesting, apply the strategy to new, unseen data segments to check for consistency. Continually optimize and adjust parameters to avoid overfitting and adapt to changing market dynamics.
These practices ensure that the strategy can withstand historical testing and has potential in real-time trading scenarios.
Conclusion.
An effective 15-minute trading strategy requires the use of technical indicators, identification of entry and exit points, and strict risk management.
Common strategies designed for this timeframe should be backtested to improve their efficiency and accuracy. You need to be well-acquainted with your strategy.
Adhering to these principles can enhance the potential for success in the fast-paced 15-minute trading environment, optimizing the decision-making process and improving the trading outcomes of your positions.
Ten trading tips learned only after experiencing two bull markets (very accurate).
1. When the market breaks down, sell quickly; if it drops sharply, reduce positions. Do not trade when the market is falling; this is a rule to remember.
2. A large cake with a gap rises sharply; if it retraces to the gap, it continues to rise. If the gap holds, it will continue to surge.
3. The market rises slowly in the morning and must surge in the afternoon; the third wave should earn more.
4. The red flower has a bit of green; hurry to buy some, do not hesitate. Do not panic during pullbacks; leave quickly when there is price without volume.
5. When the weekly line stabilizes, a bear market is about to come; when the weekly line rises, buy during pullbacks and do not miss opportunities.
6. Experts seek hot sectors, intermediates pick good coins, while beginners look at indicators; those who guess randomly are just gamblers.
7. High-level consolidation before hitting the top; hurry to act without hesitation; low-level consolidation creates new lows; buy in fully and do not miss out.
8. Buy on the rise, not on the fall; sell on the fall, not on the rise. Follow the trend to be a true hero.
9. Slow declines will have slow rebounds; fast declines will have fast rebounds. Timing is the most important.
10. After a big rise, a correction will occur, drawing a triangle with candlesticks; look for support points when rising and resistance points when falling.
Providing some practical and useful advice for those just entering the cryptocurrency circle!
1. Each time you buy or sell in the market, your loss should not exceed one-tenth of your funds. This way, even if you are wrong each time, you still have 10 chances to play.
2. Always set stop-loss levels to reduce potential losses when buying and selling incorrectly.
3. Never trade excessively. The trading frequency must be low, ideally reduced to once or twice a week. Newcomers wishing to train can use simulated funds or very small amounts to accumulate experience, but under normal circumstances, one must wait for opportunities. Trading opportunities are actually quite rare.
4. Never let a profitable position turn into a loss. Many people regret when a profitable trade becomes a loss. How to handle profitable trades to avoid turning them into losses? It’s simple: set a break-even stop-loss when profits reach a certain percentage. For example, if you buy at 10 and it rises to 13, you can set the stop-loss at 10 or 11, so even if the market reverses, you can protect your capital from loss.
5. Never go against the market. When the market trend is unclear, it is better to stay on the sidelines. Do not go against the trend; instead, go with the trend. This 'going with the trend' varies by individual, depending on the trading cycle and reference indicators; some may use the 20-day moving average on the daily chart, while others may use the 60 moving average on hourly charts. It varies from person to person. Only enter trades when the direction is clear, as mistakes will be significantly reduced.
6. If in doubt, close your position. Be decisive when entering the market, and do not enter when hesitant. This is something you must comprehend on your own. Whether you can hold a position is crucially dependent on confidence and trading psychology. If you cannot sleep holding a position, it is better not to trade.
7. Only trade in active markets. It is not advisable to trade during periods of low trading volume.
8. Never set target price levels for entry and exit; avoid limit orders, and only obey market trends.
9. Without appropriate reasons, do not close your positions. You can use stop-profit levels to secure your profits.
8. Do not guess tops. Take profits in batches; exit with profits using an inverted pyramid strategy.
10. After the market has been on a winning streak, consider withdrawing some profits for emergencies.
13. Do not enter the market out of impatience, nor close positions out of impatience. Avoid emotional trading.
15. The stop-loss set when entering the market should not be randomly canceled.
17. Be flexible in going long or short; do not only take one side. This old bull often cannot do this because he is a die-hard bull, so he suffers losses during corrections. Do not hold onto obsessions; respect the market. Reality is the most important.
19. Never hedge. If one trade is losing, stop loss! Do not lock in positions; this is a big taboo.
20. Try to avoid pyramid scaling at inappropriate times. Without a deep understanding, pyramid scaling is best left until the trend is clear; it is not advisable to add positions during market fluctuations.
21. Without appropriate reasons, avoid arbitrarily changing trading strategies. What counts as an appropriate reason is unknown! Trading strategies must be established beforehand, such as entry signals, stop-losses, position sizes, exit signals, etc. Once established, do not easily change them due to extreme market fluctuations.
I am Ah Peng, having experienced multiple bull and bear markets with rich market experience across various financial domains. Here, I pierce through the fog of information to discover the real market. Seize more opportunities for wealth creation, and find truly valuable opportunities; do not miss out and regret later!
Ah Peng only does real trading; the team has spots available for you to get in quickly #特朗普媒体科技集团比特币财库 $BTC$ETH

