🚨 ENA/USDT 4H Technical Analysis – Pump or Dump Incoming? 🚨
Traders, eyes here 👀 — ENA/USDT is sitting at a critical decision zone where price action is preparing for its next big move. Let’s break it down step by step in a technical style you can’t miss:
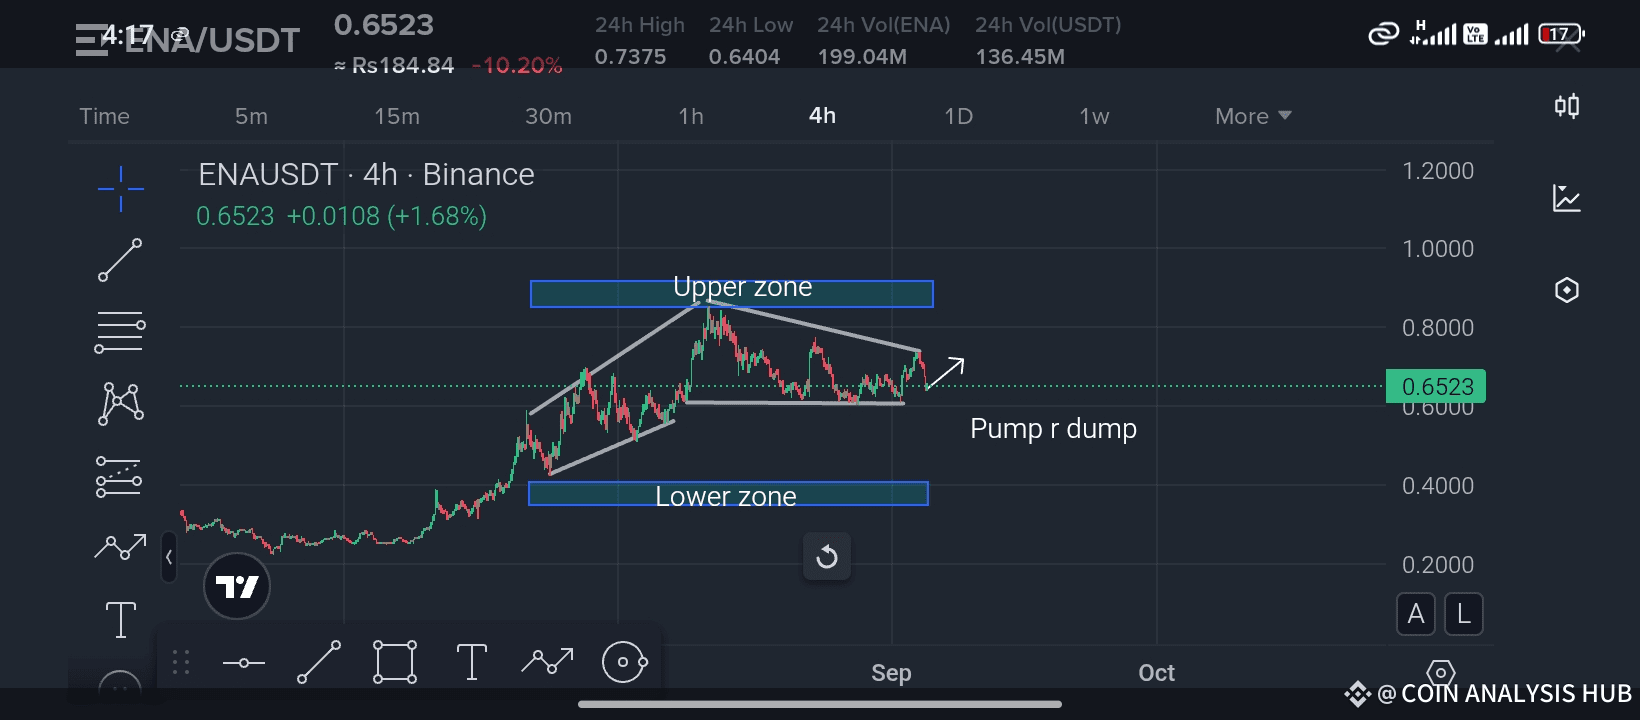
📊 Current Price: 0.6523 (+1.68%)
📈 Timeframe: 4H Chart (Binance)
---
🔎 Chart Analysis
1️⃣ Upper Zone (Resistance): Price has repeatedly failed to break higher in the marked upper region, showing strong sellers sitting there.
2️⃣ Lower Zone (Support): Buyers have stepped in multiple times to defend this region, preventing further downside.
3️⃣ Triangle Formation: Market structure is tightening with lower highs and higher lows — a squeeze pattern forming, which usually leads to a sharp breakout.
4️⃣ Pump or Dump Zone: Price is currently hugging the trendline resistance. If it breaks above with volume, we could see a pump toward $0.75–$0.80+ levels.
On the other hand, failure to break out could trigger a dump back to $0.58–$0.60 support.
---
📌 Trader’s Insight
This is a classic breakout scenario.
Bullish Confirmation: Break above resistance with volume → enter long positions.
Bearish Confirmation: Rejection & breakdown of support → short or wait for re-entry lower.
Always remember, the market rewards patience. Don’t chase the move — wait for confirmation. ✅
---
🔥 Pro Tip for My Traders:
If you find this analysis useful, don’t forget to LIKE, COMMENT, and SHARE my post — it helps more traders see these setups and join our growing community. And of course, FOLLOW for daily market insights and eye-catching chart breakdowns. 🚀
---
⚠️ Disclaimer: This is not financial advice. Always DYOR (Do Your Own Research) and manage your risk properly.
---##ListedCompaniesAltcoinTreasury
Best of luck 🤞 🍀 🤞