🚨 Trader’s Eye Technical Analysis Update (SOMI/USDT 1H Chart) 🚨
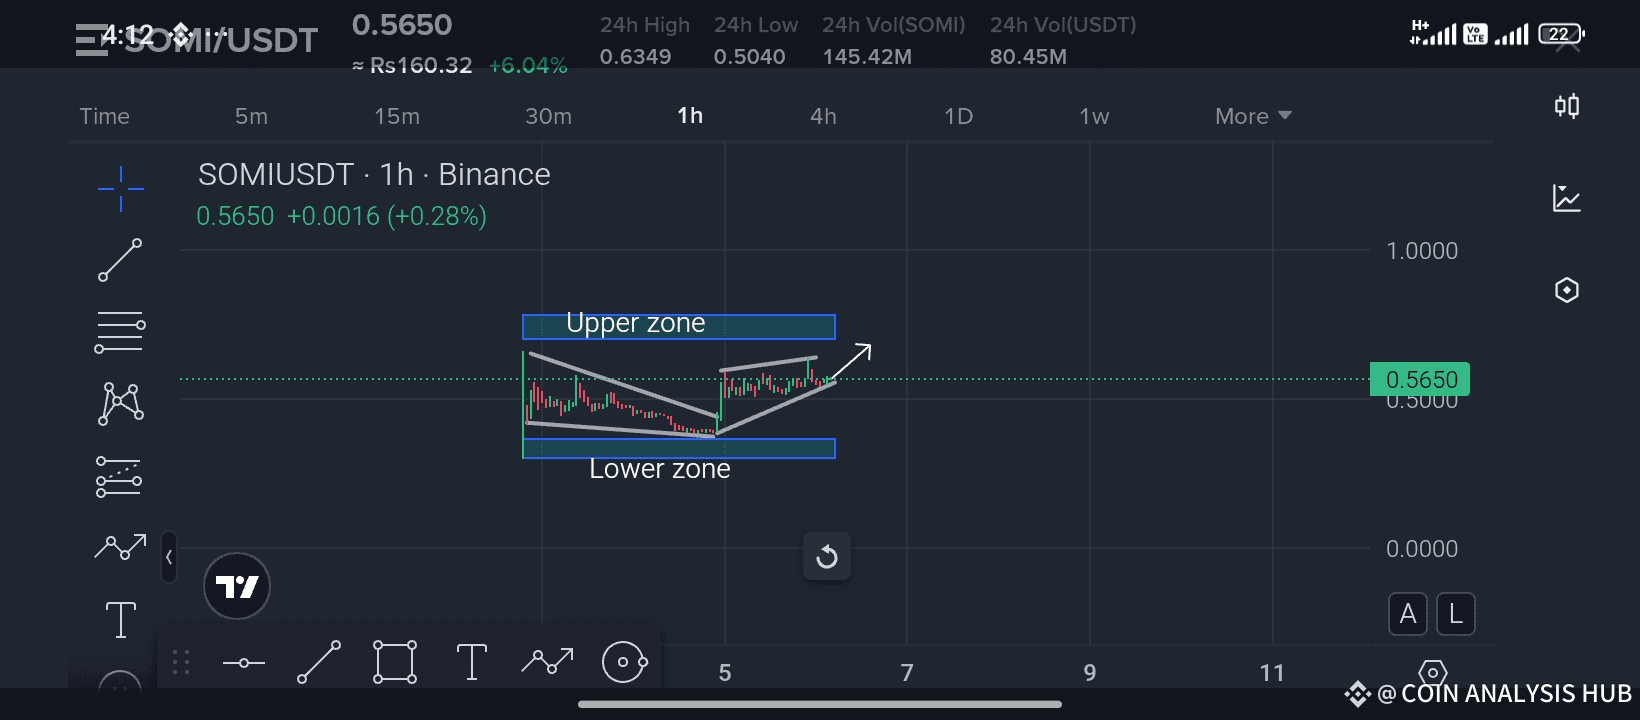
Currently, SOMI/USDT is trading around 0.5650 USDT with a slight positive momentum (+0.28%). On the 1-hour timeframe, we can clearly spot a very interesting structure forming that is worth keeping an eye on.
📊 Technical Outlook:
The price has been moving inside a channel between the Upper Zone and Lower Zone, creating a wedge-like formation.
Recently, the price successfully held above the Lower Zone support, showing strength from buyers and rejection of deeper downside pressure.
Now, SOMI/USDT is gradually climbing towards the Upper Zone, which could act as the next area of resistance.
The current candlestick structure is showing a potential breakout scenario if the price continues to hold higher lows and push above the wedge.
⚡ Key Levels to Watch:
Upper Zone Resistance: If broken with strong volume, we could see continuation to the upside.
Lower Zone Support: As long as this area holds, the bullish bias remains valid. A breakdown here would invalidate the bullish setup.
📈 Trader’s Eye View:
The chart suggests a possible breakout towards the upside in the coming hours if momentum sustains. Conservative traders may wait for a clear confirmation above the upper resistance zone, while aggressive traders might already be looking at entry signals around current levels with proper risk management.
💡 Pro Tip:
Always keep an eye on volume confirmation when trading breakouts. A breakout without volume often leads to fake moves.
❤️ If you like this analysis, don’t forget to like, share, and follow my channel for more real-time trader’s eye catching updates. Your support helps me bring more detailed analysis and trading insights every day!
#ListedCompaniesAltcoinTreasury
Best of luck 🤞 🍀 🤞