---
🚨 IDOL/USDT Technical Analysis (4H Chart) – Trader’s Eye View 🚨
The chart is showing some very interesting price action right now, and it’s something every sharp-eyed trader should keep a close watch on. Let’s break it down step by step 👇
🔹 Price Movement:
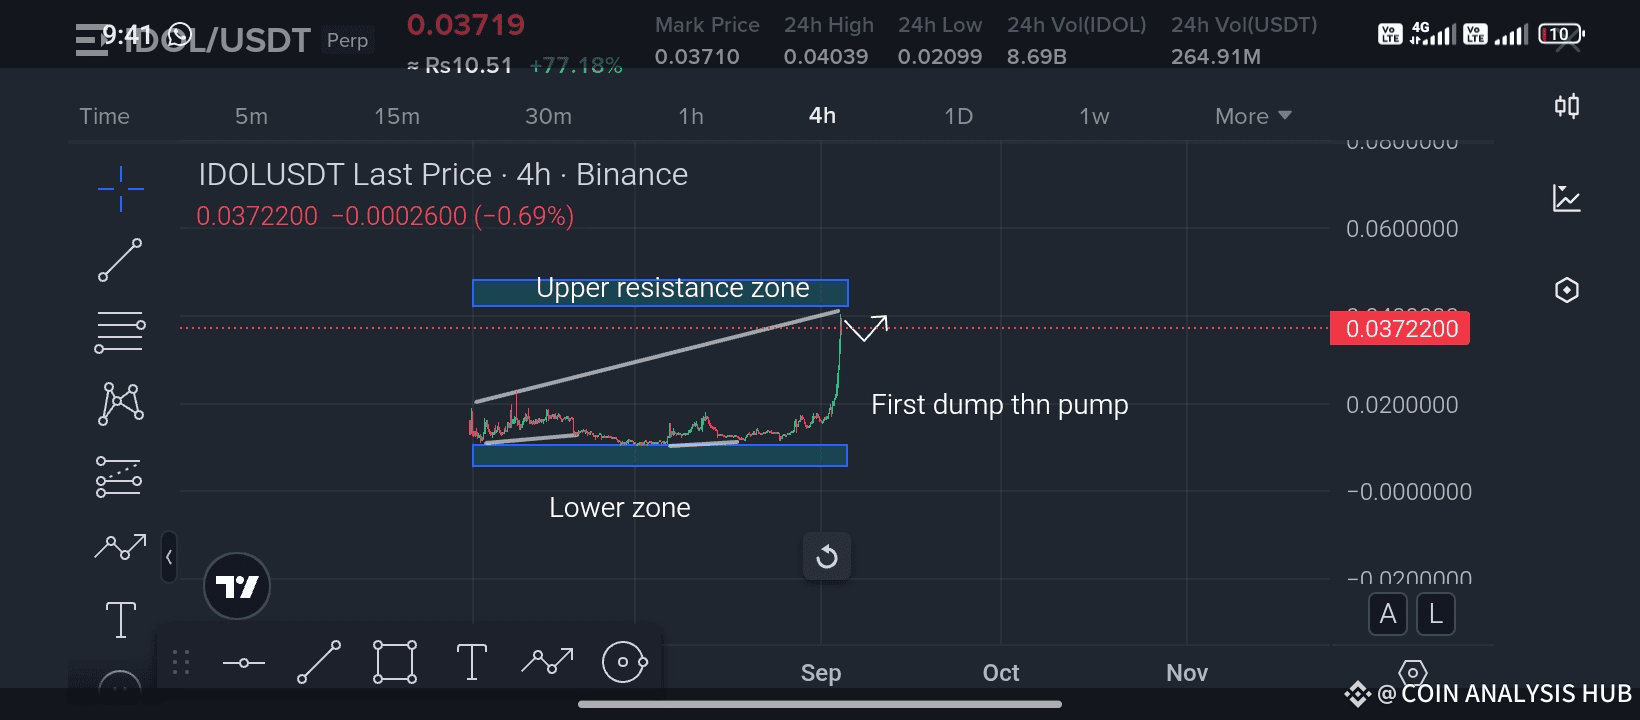
We’ve just witnessed a massive vertical pump from the lower zone consolidation range. This breakout has pushed the price straight up into the upper resistance zone, where sellers are likely waiting to take profit.
🔹 Resistance & Zones:
Lower Zone: Acted as a strong accumulation area where buyers kept absorbing the supply.
Upper Resistance Zone: Price has now entered this critical supply area. Historically, such zones are where the market tends to face heavy resistance.
🔹 Current Situation:
After such a sharp pump, the probability of a first dump (correction) is high before the market attempts another push upward. This is a typical “pump → retrace → continuation” pattern that many traders take advantage of.
🔹 What to Watch:
1. If the price holds above 0.037 and consolidates, we may see another leg up.
2. If it fails to hold and breaks back down, it could revisit the lower support zone before attempting another rally.
3. Watch closely for volume – declining volume on a pullback usually signals a potential bounce back.
💡 Trader’s Tip:
Never chase green candles after a huge pump! Patience is key – smart traders wait for the correction and retest before entering. This reduces risk and increases the probability of catching the next real move.
---
🔥 If you find my analysis helpful, don’t forget to LIKE ❤️, COMMENT 💬, and SHARE 🔄 this post. Your support helps me bring more in-depth updates and reach more traders like you. Also, hit the FOLLOW ➕ button so you never miss my next analysis! 🚀📈
##ListedCompaniesAltcoinTreasury
Best of luck 🤞 🍀 🤞