---
🚨 PENGU/USDT Technical Analysis – 4H Chart (Binance) 🚨
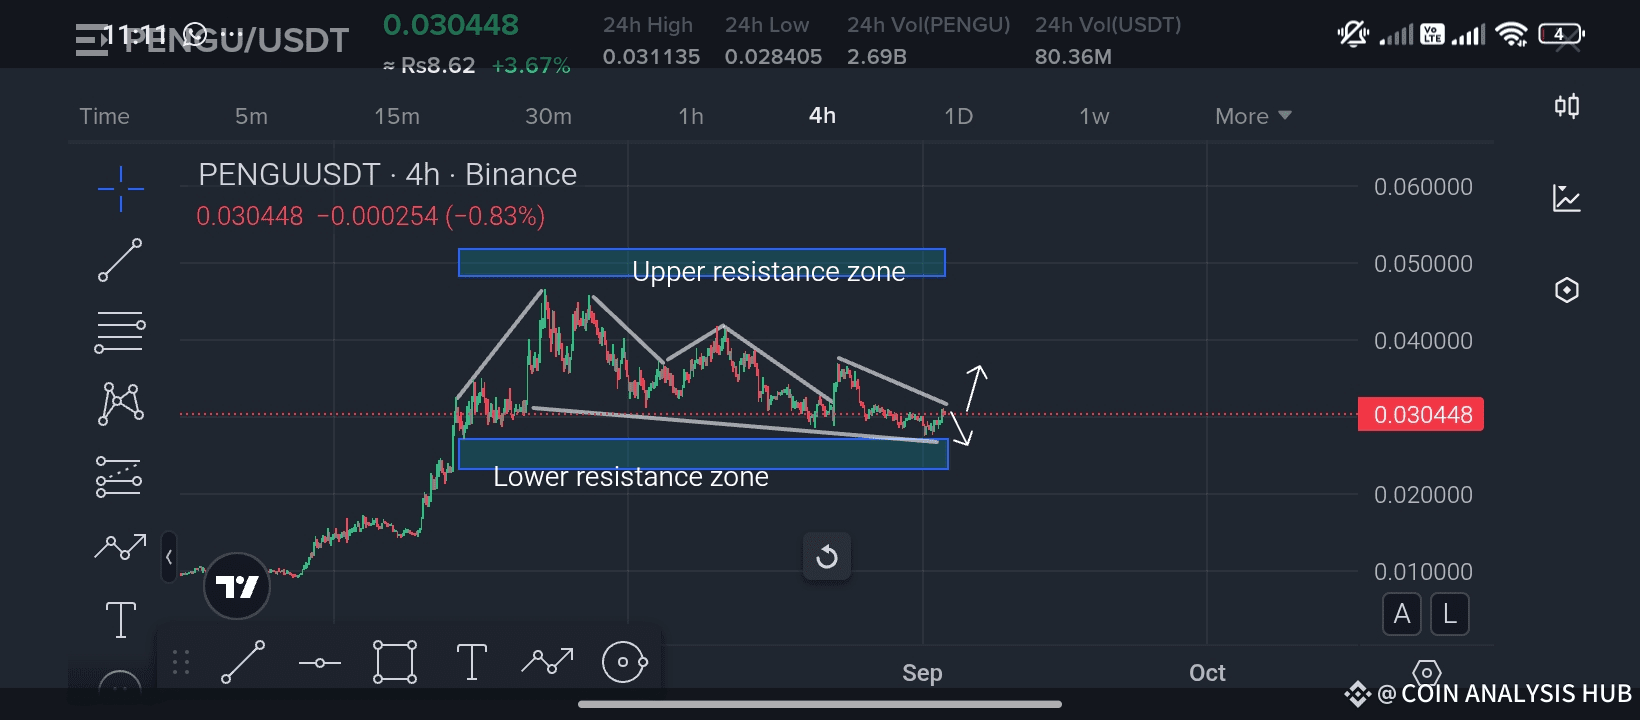
Currently, PENGU is trading around 0.030448 USDT, and the chart is showing an interesting structure that traders need to keep a close eye on. Let’s break it down step by step 👇
📊 Chart Structure Overview
Price action has been consolidating between two key zones:
🔹 Upper Resistance Zone → Near the 0.045 – 0.050 range
🔹 Lower Resistance/Support Zone → Near the 0.027 – 0.029 range
After a strong upward rally, the market entered into a descending channel, which has tested the lower support zone multiple times. Each retest is showing buying interest, indicating that bulls are still defending this area.
📉 Bearish Perspective:
If the price fails to break above the descending resistance trendline, we may see a rejection and retest of the lower support zone (0.028 – 0.029). A breakdown below this area could trigger further selling pressure.
📈 Bullish Perspective:
If PENGU manages to break out of the descending resistance line with strong volume, we could see momentum driving it toward the upper resistance zone again. The first target would be around 0.038 – 0.040, and a successful close above that may open doors to 0.045+.
⚖️ Trader’s Tip:
Watch closely for a confirmed breakout (with volume) before entering long positions.
Manage risk wisely – always set stop losses below major support levels.
Range traders can still benefit from buying dips near support and selling near resistance until a decisive breakout occurs.
✨ Final Words
PENGU is at a make-or-break point on the 4H chart. Both bulls and bears are fighting for control. Traders should stay alert because the upcoming move could set the next short-term trend direction.
💡 If you find this analysis useful, don’t forget to LIKE ❤️, COMMENT 💬, and SHARE 🔁 this post. Also, hit FOLLOW ✅ for more real-time technical breakdowns and trading
##ListedCompaniesAltcoinTreasury
Best of luck 🤞 🍀 🤞