Most people think trading is only for experts… but that’s not true!
With 5-minute candlestick charts, even beginners can learn quick trading patterns and aim for $40/day with small, consistent wins. 🚀
🕒 What’s a 5-Minute Candlestick Chart?
Each candle shows 5 minutes of price action:
➤ 🟢 Green Candle = Price went UP
➤ 🔴 Red Candle = Price went DOWN
By reading these candles, you can quickly spot market trends and trade smartly. 🎯
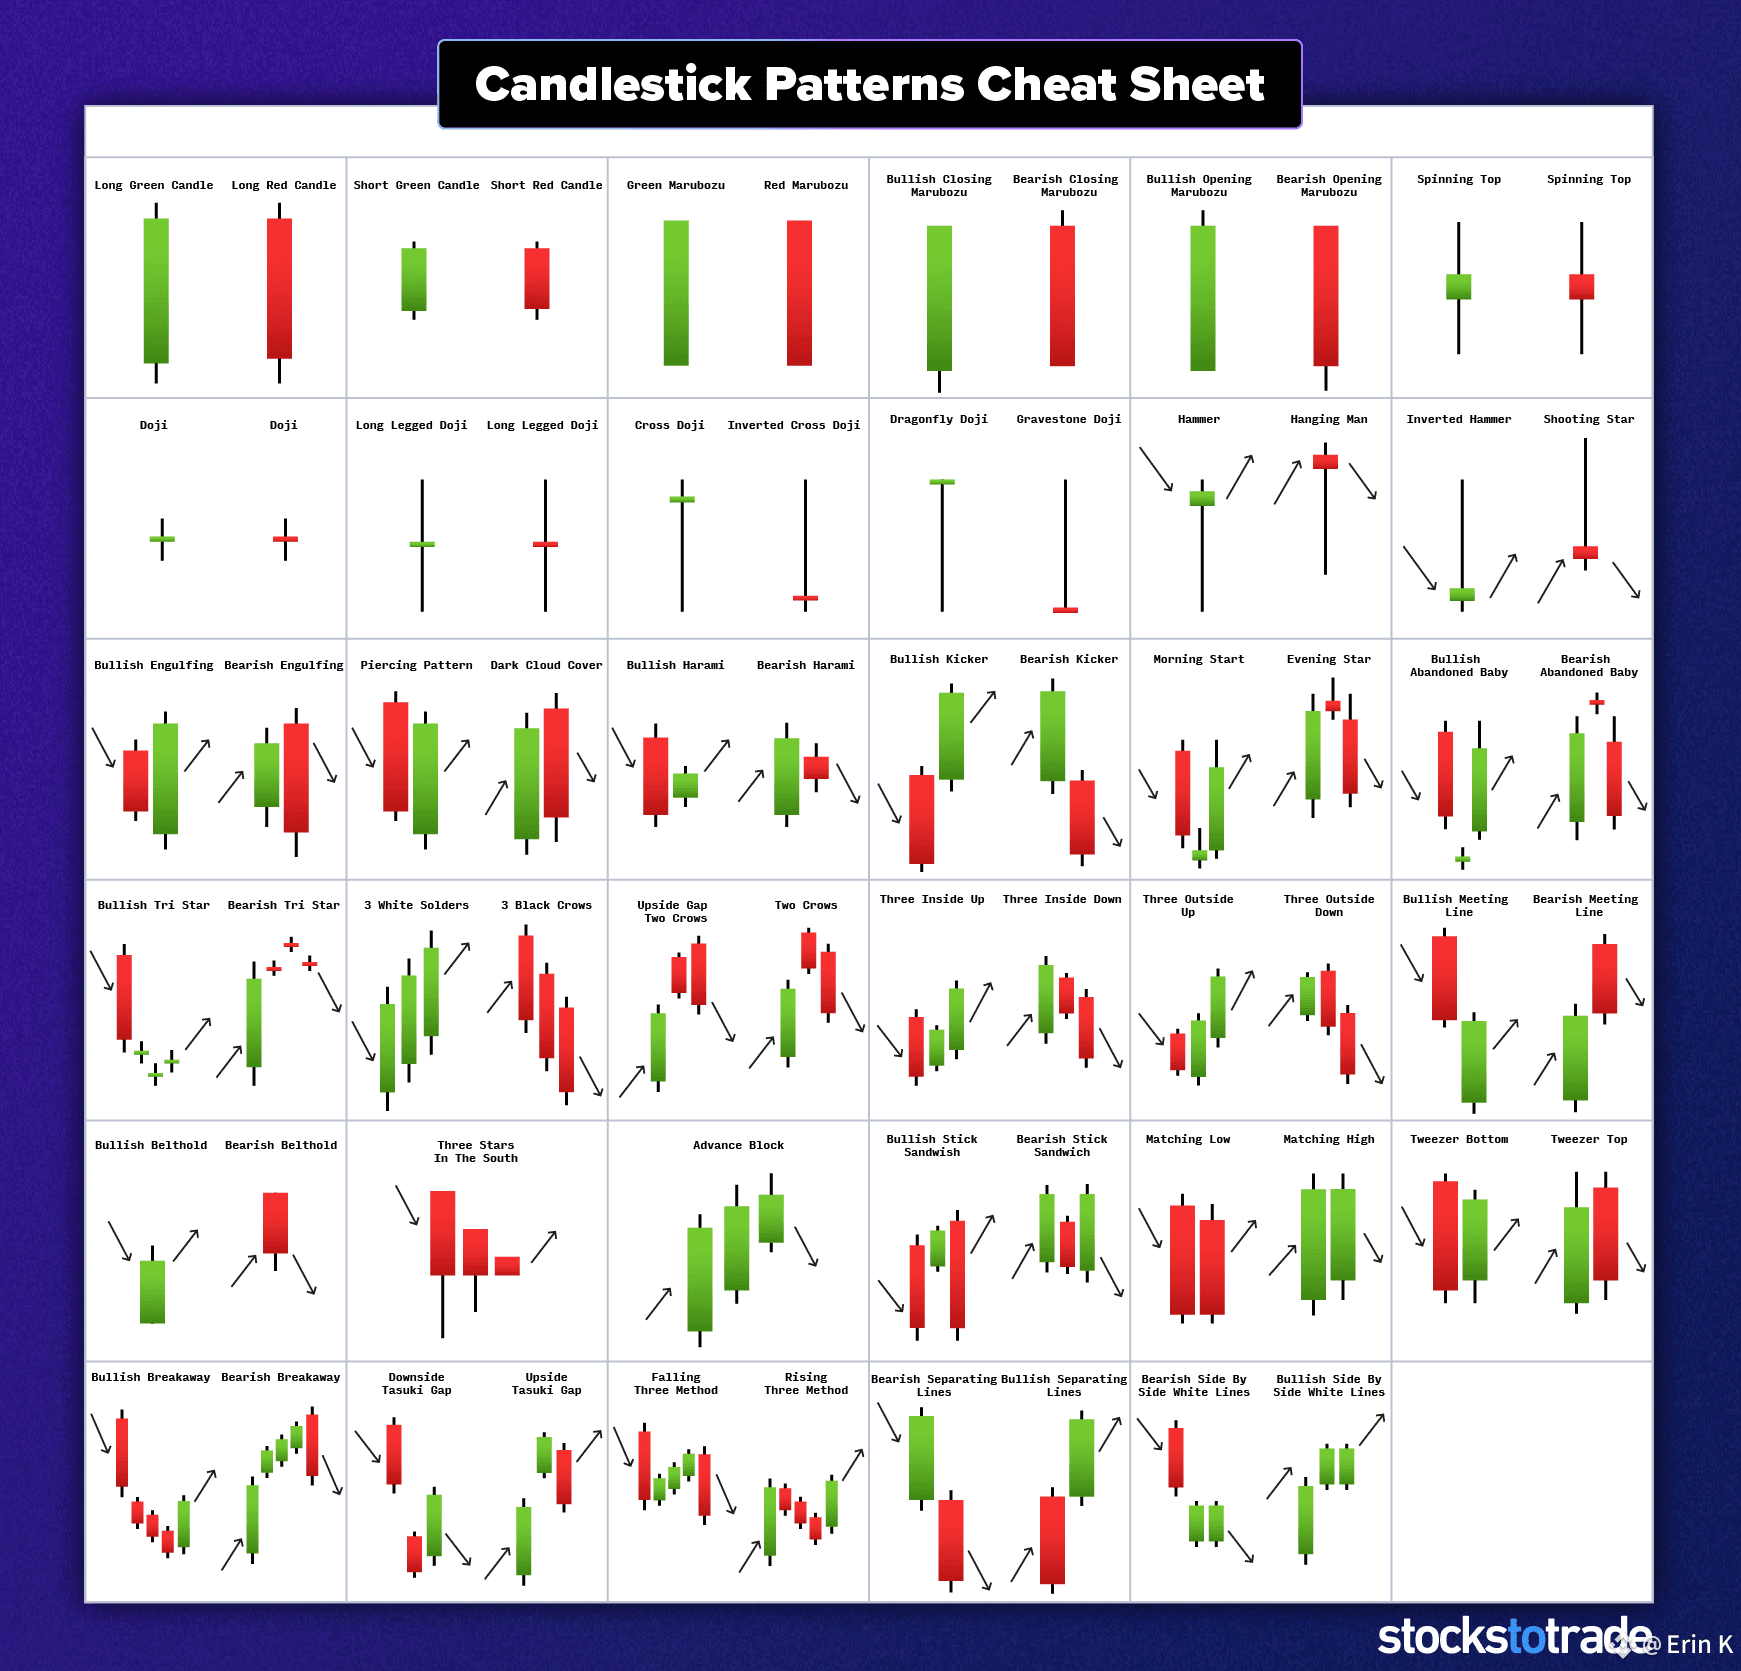
📊 3 Easy Patterns for Beginners
1️⃣ Doji → The “Indecision” Candle
➤ Looks like a ➕ sign
➤ Shows buyers & sellers are balanced
➤ Often signals trend reversal
2️⃣ Engulfing Pattern → The “Takeover” Candle
🟢 Bullish Engulfing: Small 🔴 candle → Big 🟢 candle → Price may rise
🔴 Bearish Engulfing: Small 🟢 candle → Big 🔴 candle → Price may fall
3️⃣ Hammer → The “Rebound” Candle
➤ Small body at the top + long lower wick
➤ Sellers pushed price down, buyers fought back
➤ Signals possible upward move
🛠️ How to Trade These Patterns
➤ Step 1: Pick a popular stock or crypto pair
➤ Step 2: Watch the chart during active hours (Morning/Afternoon)
➤ Step 3: Spot a strong pattern (e.g., Bullish Engulfing after a decline)
➤ Step 4: Enter the trade → Buy if price likely rises, Sell if it likely falls
➤ Step 5: Exit early → Secure small profits fast
💰 Example Trade Scenarios
➤ Bullish Engulfing → Buy → Price ↑ → Sell → Profit $10
➤ Bearish Engulfing → Sell → Price ↓ → Re-buy → Profit $8
Do this 4–5 times a day = $40 goal achieved 💸
🏆 Why This Works for Beginners
⚡ Simple patterns, easy to understand
⚡ Quick trades = Fast results
⚡ Low risk with small profits
---
📌 Pro Tips for Success
✔ Start small → Risk control is key
✔ Stay consistent → Trading = Practice + Patience
✔ Read candles carefully → They tell the market story
With 5-minute candlestick charts, steady profits and trading confidence are well within reach. 🚀📈