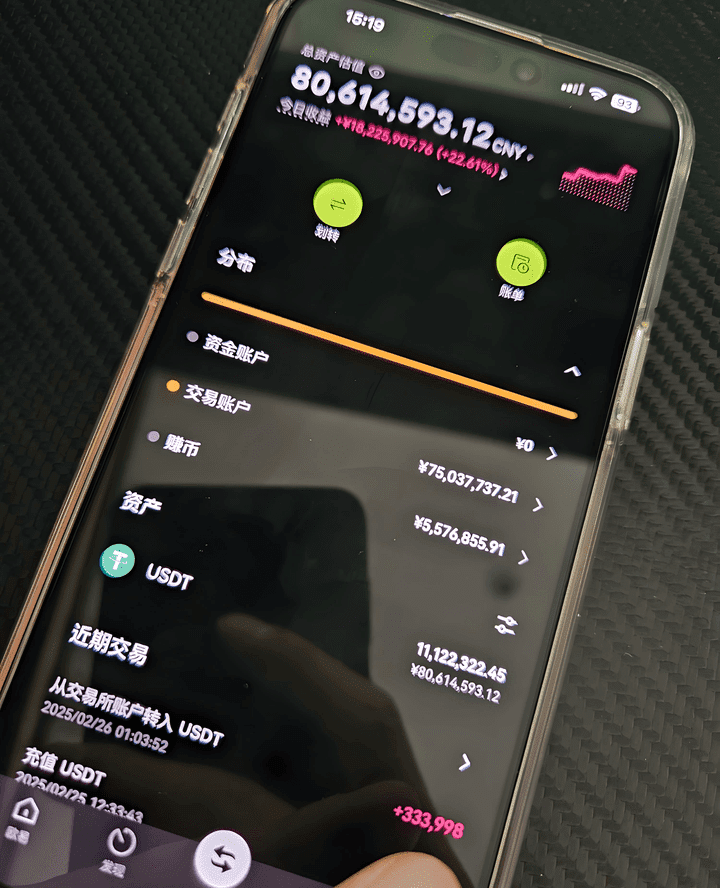
I entered the cryptocurrency world in 2014 as a fresh graduate, diving in with 200,000 yuan of startup funds from my parents. Now, after 8 years of navigating this space, I have experienced 3 liquidations, and at my worst, I lost so much that I couldn't even pay rent. However, during the bull market in 2021, I accurately positioned myself, turning 500,000 yuan into 80 million.
Trading cryptocurrencies is a simple matter; don't complicate it!
In the world of financial speculation, losses are like an invisible ghost that follows every trader. For the two outcomes of trading, profit and loss, profits always bring joy. However, how to properly address losses often determines whether a trader's final outcome is profitable or not.
A common phenomenon is that when traders face paper losses, many choose to stubbornly hold on and not stop loss. This may not necessarily be wrong for a single trade because many times it can recover and even turn from a loss to a profit. However, when looking at the overall trading results over a certain period, this is indeed the main reason for ordinary traders' capital losses.
Overestimating human nature is the root of losses in trading. The financial speculation market easily creates an illusion, leading people to overestimate their ability to control their mindset and execution. A simple example: on an empty highway, how many people can consistently maintain a speed of 100 mph? Most will start speeding up unconsciously, often without realizing it, because the feeling is that they are going slower and their foot will involuntarily press the gas pedal. This is a kind of self-affirmation illusion.
The paper loss puts invisible pressure on traders. The reason for choosing not to stop loss is that it is psychologically difficult to accept actual losses. After all, paper losses still have room for reversal. Once you stop loss, it will result in actual losses, and there will be no room for recovery. However, as losses grow larger and pressure increases, traders often become more irrational.
In fact, the struggle between long and short in trading is a psychological game. From the perspective of economically rational individuals, no one would lose in trading. However, losses occur constantly because pressure makes traders irrational. The simplest reasoning is that the probability of making mistakes tends to increase because mistakes often occur in moments of inattention. This is human nature.
For trading, whether you pursue win rates or probabilities, you should understand one thing: human nature is the key to trading. When faced with repeated gains and losses, the fluctuating mindset of wanting to win and fearing to lose is something every trader needs to constantly reflect on. To learn trading, you must first learn to be a person. The deep principles of life do not relate here; it is simply that overcoming the negative aspects of human nature is a prerequisite for successful trading.
What I want to share today is: 'The essence of trading is to follow the big and counter the small.'
I hope you engrave this sentence in your mind.
1. What is a complex pullback?
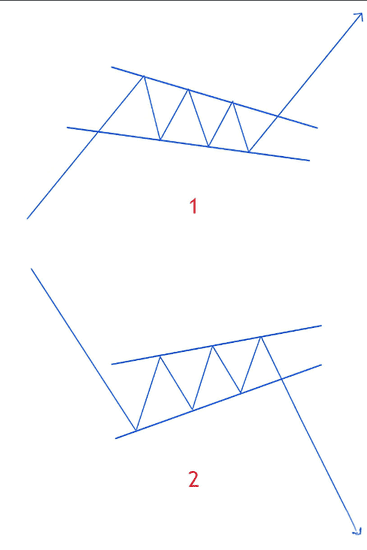
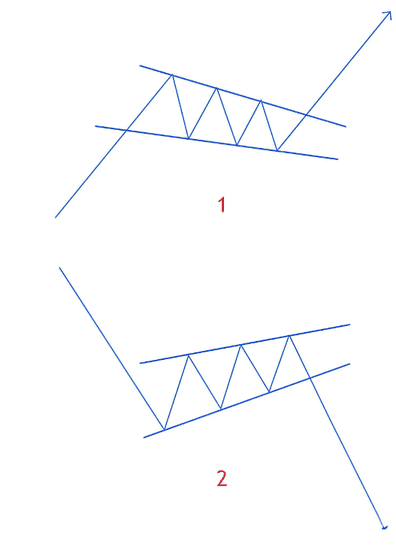
What is a complex pullback? Simply put, as long as a pullback has formed a certain pattern, we collectively refer to this pullback as a complex pullback. For example, let's look at the diagram below. If a descending wedge appears in a rising trend (as shown in Figure 1), we call this a complex pullback in the rising trend. It doesn't matter if you don't know what a wedge is; we will discuss it later. Now let's look at a second example, where an ascending flag appears in a falling trend, and we say this ascending flag is a complex pullback in the downtrend. (As shown in Figure 2)
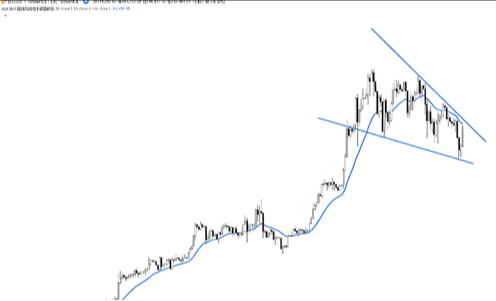
(Figure 1: Descending wedge)
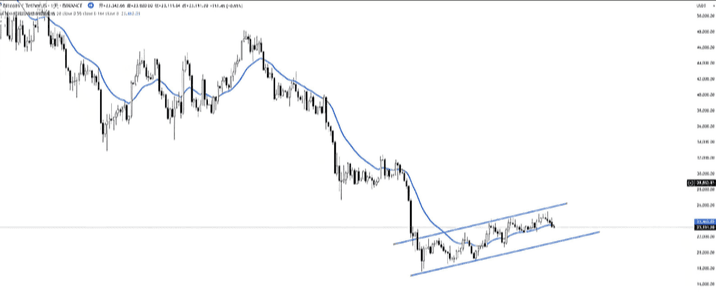
(Figure 2: Ascending flag)
Now please look at this chart again. Can I consider this as a complex pullback? Yes or no? Please answer me, 3, 2, 1 (as shown in Figure 3). The answer is yes, because it has formed a rectangle during the downward process. You might say, 'Hey, coach, how can this ugly irregular shape be called a rectangle?' That's fine; we can say that the entire irregular shape is called the complex pullback of this downward trend. This is what we often refer to in systematic classes as 'vaguely correct.' So you see, learning technical analysis is not that difficult.
Finally, to summarize: anything that forms a pattern, anything that forms a certain pattern, even if the pattern is something you don't understand or is irregular, we can still say it is a complex pullback of the most recent trend on the left. Of course, we have discussed more common patterns in our live classes, such as wedges, rectangles, flags, and triangles. Due to time constraints, we will discuss wedges in detail next, while we will talk about rectangles, flags, and triangles later.
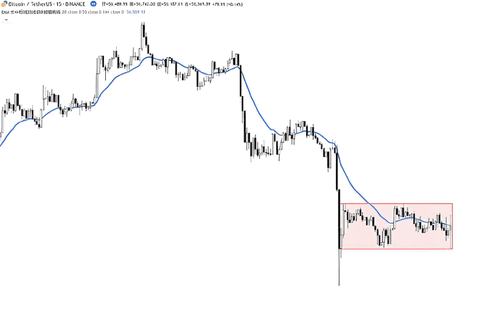
(Figure 3: Ugly irregular shape)
2. How to buy during complex pullbacks?
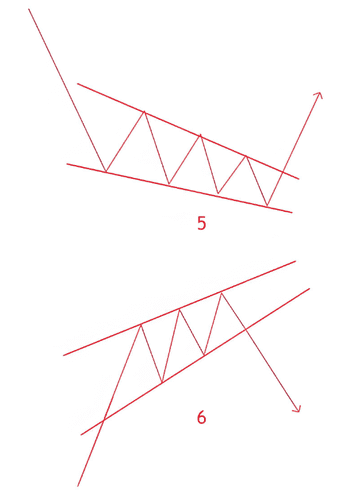
Since we are talking about wedges, let's first understand what a wedge is. Please note that this character is pronounced 'wedge' and not 'contract.' So what is a wedge? We actually learned this in our middle school physics class. (As shown in Figure 4) It has convergence and symmetry. After understanding the wedge, let's take a look at these 6 common wedges in the market. (As shown in Figure 5).
(Figure 4)
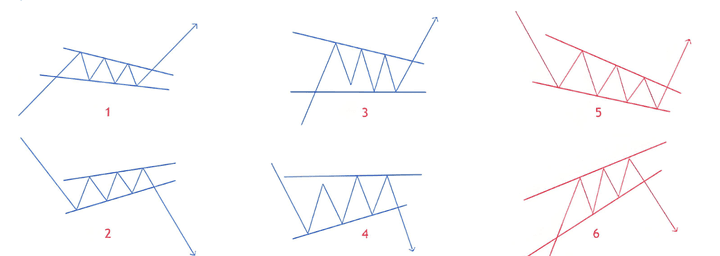
(Figure 5)
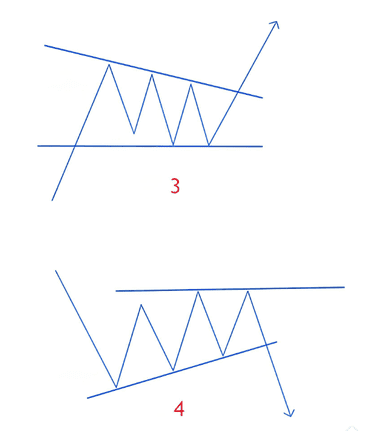
Let's first discuss the first and second types (as shown in Figure 6). Let's look at Diagram 1: a descending wedge appears in a rising trend, so we follow this rising trend to reverse this descending wedge.
So how do we reverse a descending wedge? Essentially, we need to look at whether this wedge has completed. In other words, we need to see if this wedge has reached the end.
So how do we determine if it has completed or reached the end? Our method is to count the pushes of this wedge and judge whether there has been divergence based on the push strength.
For example, let's take Diagram 1 as an example: this is the first push, second push, third push. In the process of counting pushes, we can clearly see that although each push creates lower highs and lower lows, the distance of each push is getting shorter. At this point, we can say this wedge shows divergence. As long as these conditions are met, it is very likely a sign of power exhaustion, and we can say this wedge has reached its end. If your style leans towards the left, as soon as you see a high 1, you can enter and go long. Set T1 take profit at the starting point of the wedge and T2 take profit at the equal distance of the left trend.
(Figure 6)
To better understand, let's open the chart and look at a case. (As shown in Figure 7) This is the daily chart of ice sugar orange, where a descending wedge appears in a clear rising trend. Now we count the pushes of this descending wedge: one push, two pushes, three pushes. Does this descending wedge show divergence? Does each push become weaker than the previous one? The answer is yes. At this point, a high 1 appears, which is a deformed bullish engulfing pattern formed by 3 candlesticks. So we directly enter the market here to go long. Set the T1 take profit at the starting point of the descending wedge and T2 take profit at the equal distance of the left trend. However, as we often say in live classes, 'When the water is full, it overflows; when the moon is full, it wanes.' So we set our take profit around this position, and the subsequent market indeed smoothly reached our take profit level. This is the first common reversal of a descending wedge.
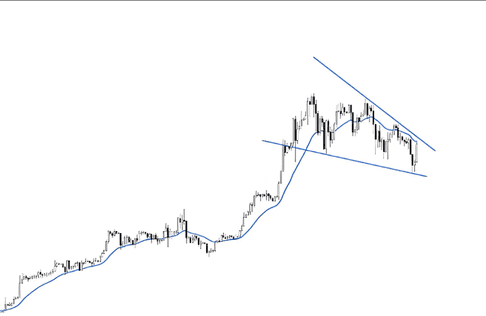
(Figure 7)
In a declining process, encountering an ascending wedge follows the same logic. Let's look at Diagram 2: an ascending wedge appears in a downward trend, so we follow this downward trend to reverse this ascending wedge. It is simply changing from going long to going short; I won't elaborate on this, as these are the two most common wedges. (As shown in Figure 8)
(Figure 8)
Next, let's look at a special type of wedge. First, let's look at Diagram 3. (As shown in Figure 9)
(Figure 9)
A descending wedge appears in a rising trend, but the last push of this wedge does not create a lower low but forms an SB structure with the second push.
Similarly, let's open the chart and look at a case (as shown in Figure 10). This is the 5-minute chart of spot gold, where a descending wedge appears in a clear upward trend. One push, two pushes, three pushes. Similarly, the third push shows divergence, and the only difference is that the last push does not create a lower low but forms an SB structure with the second push. At this point, we first look for high 1, which is the bullish engulfing pattern formed by these two candlesticks, and then look for high 2, which is this candlestick. Now we can directly enter the market to go long.
Never forget what we just talked about: 'When the water is full, it overflows; when the moon is full, it wanes.' Set T1 take profit slightly below the starting point of the descending wedge, and the subsequent market indeed smoothly reached our take profit level. This is a relatively special reversal of a descending wedge.
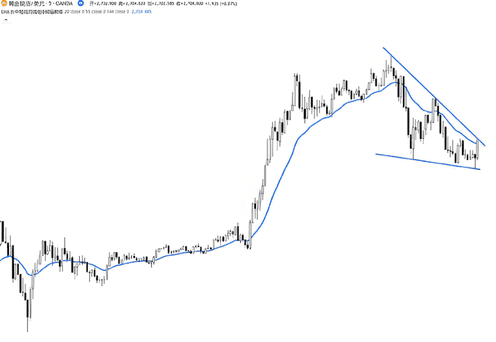
(Figure 10)
The same logic applies when encountering an ascending wedge during a decline; it is just that we switch from going long to going short. I won't elaborate on this, as this is a relatively special wedge.
To summarize the four types of wedges we discussed above, they share a common feature: they should follow the larger trend on the left and counter the smaller trend of this wedge. Following the large trend and countering the small trend. Therefore, it is best to count pushes during a pullback, not in the main trend. I hope you develop this habit and avoid making the mistakes mentioned below. (Figure 11)
(Figure 11)
So why don't we allow counting pushes in the main trend, meaning we don't look for ascending wedges in an upward trend or descending wedges in a downward trend? There are two main reasons:
The first reason is that if you count pushes in a main trend, you may be able to count out more than 3 pushes. If a market moves in a channel pattern, there could even be 4, 10, or 100 pushes (as shown in Figure 12). However, our purpose in counting pushes is not to count for counting's sake, but to see whether this entire wedge has divergence. This is the first reason.
The second reason, and also the most important reason, is that if you count pushes in the main trend, you will inevitably try to reverse this segment of the main trend. We have emphasized many times: do not go against the trend, do not go against the trend, do not go against the trend. Therefore, do not count pushes in the main trend; do not count pushes in the main trend; do not count pushes in the main trend. This is very important, extremely important.
The essence of trading is to follow the big and counter the small. I hope you engrave this sentence in your mind.
(Figure 12)
To summarize, this is how I buy during complex pullbacks.
Step 1: Find the pattern. We mentioned that there are many kinds of patterns, such as flags, wedges, triangles, rectangles, and many others. Today, we will only take wedges as an example, looking for a descending wedge in a rising trend or an ascending wedge in a falling trend.
Step 2: Count the pushes. We look at whether this wedge has completed and whether there has been divergence.
Step 3: Find entry signals, which are high 1 or SB structure entries.
If you are also a technical enthusiast, take a look at the figure:

Finally, everyone must thoroughly understand these iron rules!
1. Rapid rise and slow decline indicate that the dealer is quietly accumulating. When a certain cryptocurrency shows a rapid upward trend, but declines slowly during pullbacks, this situation requires high vigilance. It is highly likely that the dealer is quietly accumulating chips, gathering a large amount of inventory to prepare for a strong upward push later. The internal logic is that the dealer attracts market attention through rapid price increases, prompting retail investors to follow suit, and the subsequent slow decline gradually absorbs the chips sold off by retail investors at low prices to achieve their control goals, accumulating energy for the next significant rise. #Bitcoin ancient whales continue to clear out.
2. A rapid decline and a slow rise indicate that the dealer is unloading early. Conversely, if the currency price suddenly drops sharply without warning and then recovers slowly, like a snail crawling, it is likely that the dealer is systematically unloading. The dealer sells a large amount of chips at high positions, causing the currency price to plummet sharply, and the subsequent slow recovery is merely to confuse retail investors, leading them to mistakenly believe it is a good opportunity to buy the dip. At this point, the overall market trend may have quietly turned downward, and investors must respond cautiously and not be blindly optimistic. #Domestic concept coins collectively explode.
3. When trading volume is massive at the top, there is still play; if volume is low, run fast and do not hesitate. When the currency price rises to historic highs, if trading volume remains high and very active, this indicates that the bullish forces in the market are still strong, and there is potential and space for further increases. A large volume of transactions means many investors are actively participating in trading, keeping market enthusiasm alive, with funds continuously flowing in to push the currency price upward. However, if trading volume in the top area significantly shrinks and becomes very sparse, this is undoubtedly a dangerous signal, suggesting that the momentum to push the currency price up is insufficient, and the subsequent rise is weak. Investors should decisively exit the market to avoid potential significant downturn risks. #Trump dismisses Federal Reserve director Cook.
4. When massive volume appears at the bottom, it is best to observe and not rush in. When the currency price drops to its lowest point and trading volume suddenly increases sharply, do not act impulsively and buy immediately. This could just be a brief technical rebound in a downward trend, not a true bottom reversal signal. In such cases, the market often needs time to solidify the bottom and confirm the reversal trend. Investors should remain calm, patiently observe, and wait for the situation to become clearer.
5. When volume continues to increase at the bottom, it is the right time to enter. If the currency price is at a relatively low level and trading volume can maintain a high level while showing a stable increasing trend, it indicates that funds are continuously flowing into the market, and bullish forces are gradually accumulating and gaining an advantage. At this point, investors can closely monitor market dynamics, combine other technical indicators and fundamental analysis, and decisively buy at the right moment to ride the wave of rising currency prices and gain investment returns.
Finally, keep in mind:
The cryptocurrency market is a marathon; stability is far superior to quick wins. Gains made by luck will eventually be lost due to lack of skill. Only by integrating position management into instinct can one survive in a brutal market.
Remember: as long as you are alive, you have the right to wait for the next round of a comeback.
Even the most diligent fisherman will not go out to sea during a storm but will carefully guard their boat. This season will pass, and a sunny day will come! Follow Lao Chen, learn to fish and also fishing techniques. The door to the cryptocurrency world is always open. Only by going with the flow can you have a smooth life. Save this and keep it in mind!
$ETH $BTC #加密市场回调
