I want to tell a story. When I suffered the biggest losses, I had a contract that blew up with 2 million in 3 days, deeply in debt, almost losing my family, almost taking my own life. But the cryptocurrency world is so magical, by chance, I received guidance from an expert. On a stormy night, I realized that I had to start from scratch and fully commit to trading, becoming a professional cryptocurrency trader, diligently studying the technology, spending thousands of days and nights researching and learning!
The journey in the cryptocurrency world is long. I hope everyone can take fewer detours and experience fewer tragedies! Having achieved financial freedom, I have continued to create on Zhihu. Many people don't understand why, after achieving financial freedom and reaching a few small goals, I still want to do these things. I have asked myself the same question. In the process of rediscovering my original intention, one aspect is for my dream of being a hero. I dedicate everything to trading, mastering extraordinary skills, and I don’t want to be unknown and unrecognized! On the other hand, I want to provide a path for those who are eager to learn. What I gain in the market is also a process of giving back to the market. The way of nature reminds me of the issues I faced with leverage, struggling for more than half a year. There was no path to refer to for learning; I could only analyze the K-line over and over again, countless days and nights, stumbling to where I am now, deeply understanding the difficulties of small retail investors in the cryptocurrency world, and being able to empathize more!
In addition to solid techniques! Remember this twelve-character mantra: Cut losses when wrong, hold on tight when right, small losses, big gains. How to play specifically?
1. Look at the big picture
Only go long when the 5-day line is up, and only go short when it is down. Don't go against the trend; it will end badly.
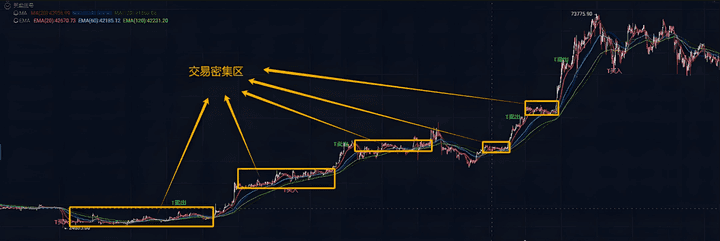
2. Testing the waters
Look for positions where the stop loss is only $1, but the profit can multiply by 10 times. Usually, this is at the bottom when the market just starts; even if wrong, the loss is just the cost of a meal.
3. Cut losses quickly
If a key level breaks, cut losses immediately; don't get emotionally attached to your trades. If you cut losses and the market comes back, then just re-enter; it's better than blowing up your account.
4. Adding positions is the way to go
After making a profit on the first wave, wait for a pullback to the support level before adding positions. Remember: adding positions should be as cautious as the first trade.
5. Trailing stop
With each added position, raise the stop loss. This way, in the end, you only have profits running, allowing you to sleep well.
6. Let profits fly
Don't act like you've never seen money before; running away after making 10% is not wise. The real meat is further ahead; wait for a clear topping signal before dumping everything at once.
These 6 points look simple, but 90% of people fail in execution. If you can control yourself, making money is just a matter of time. When I realized this, my account balance started to soar like a rocket. Now it's your turn.
In this article, we will discuss a highly practical "15-minute forex trading strategy" that will help you precisely capture opportunities in day-to-day market movements and steadily improve your win rate.
1. Why choose a 15-minute timeframe?
1. Trading frequency is moderate, avoiding "overtrading"
Many beginners like to focus on 1-minute or 5-minute charts. Although there are many signals, they are easily disturbed by noise, leading to frequent entries and exits, causing constant whipsaws. The 15-minute chart is just at the golden mean between short-term and mid-term:
The number of signals per day is moderate, and the operating rhythm is neither rushed nor slow;
Can filter out some "false moves," making signals more reliable.
The 15-minute timeframe achieves an excellent balance in trading frequency, avoiding the "chaos" of lower timeframes while not missing trading opportunities like longer timeframes. For traders who want to improve their win rate without being led by the market, this is a very trustworthy rhythm.
2. Ideal timeframe for day traders
For day traders who are unwilling to hold positions overnight and hope for quick feedback, the 15-minute chart is the balance point of efficiency and safety:
Sensitive enough to react to market changes;
But not so chaotic as the 1-minute chart;
Common currency pairs like EUR/USD and GBP/USD exhibit ample volatility and good rhythm in this timeframe.
It can provide frequent trading opportunities without getting caught in the pitfalls of high frequency. It creates a "controllable battlefield" for day traders, allowing for both offense and retreat, making it a cost-effective operating rhythm.
3. Technical indicators are more readable
MACD, EMA, MA, RSI, and other indicators perform more stably on the 15-minute chart, neither causing chaotic signals nor showing significant lag, making them very suitable for combining momentum, trend, and strength analysis.
Two, core framework of the strategy: three-dimensional resonance confirmation signals
This strategy does not blindly rely on any single indicator; instead, it emphasizes "multidimensional resonance." Only when the directions of trend, momentum, and price behavior are consistent do we consider taking action. #GalaxyDigital sells Bitcoin
Technical indicator pairing:
In actual trading, we recommend using a combination of EMA and MA to judge the strength of the trend's bullishness and bearishness, balancing sensitivity while enhancing stability in trend judgment.
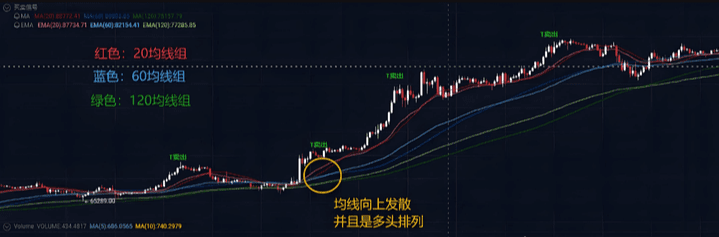
EMA20, EMA60, EMA120: Three exponential moving averages representing short-term trend, main trend, and long-term trend reference.
MA20, MA60, MA120: Can serve as auxiliary indicators to judge the smoothness of trends, in conjunction with EMA to observe the interweaving of trends.
MACD (12,26,9): To judge momentum changes and confirm whether the market is "strong enough".
15-minute candlestick chart: Serves as the basic trading vehicle to judge breakouts and patterns.
Through the combination of EMA's quick response and MA's stable buffer, traders can more clearly identify the current market state, reducing misjudgments and hesitations. EMA20, EMA60, EMA120: three exponential moving averages representing short-term trends, current main trends, and long-term references.
Entry logic (bullish example):
When EMA20 crosses above EMA60, and the distance between the two gradually widens, forming a classic "bullish arrangement" structure, it usually indicates that the short-term trend is strongly moving upward. However, to enhance the stability of the judgment, we can introduce the logic of a double-line system: observe the crossover status of MA20 and EMA60. If MA20 also shows an upward trend and gradually moves away from EMA60, it indicates that the trend is not just a temporary fluctuation but has a sustained healthy upward structure. EMA provides sensitive signals, while MA offers a buffer confirmation. The resonance of the two lines further eliminates false breakouts and enhances signal credibility.
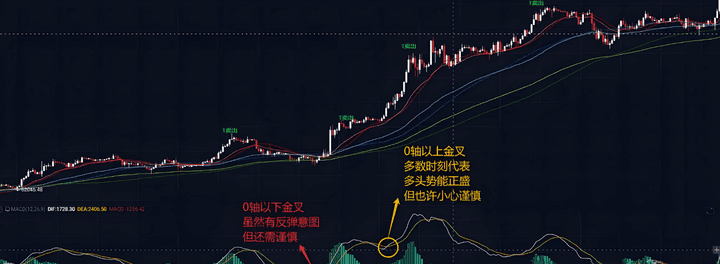
When MACD forms a golden cross, red bars continue to grow; if the golden cross occurs above the zero line, it usually indicates strong trend continuity and bullish momentum; if the golden cross occurs below the zero line, there may be a rebound intention, but trend signals need further confirmation.
At the same time, we need to pay close attention to the top-bottom divergence signals provided by MACD: when the price reaches a new high but MACD does not synchronize with a new high (i.e., top divergence), it may indicate that the upward momentum is fading. However, this signal's interpretation cannot be done in isolation and must be combined with the market phase.
If the current trend is in a strong upward trend, especially in a complete bullish structure with stable EMA and MA bullish arrangements, top divergence often indicates a "breather" during the normal upward process; recklessly shorting at this time is likely to be crushed by the trend.
Conversely, if the trend shows signs of fatigue or the market enters a consolidation range, the reference value of top divergence signals will significantly increase, becoming an important clue for advance warning. #Binance Alpha new launch
Moreover, the frequency and overlap of top-bottom divergences are also critical—if multiple top divergence signals appear consecutively in a certain area, especially when confirmed by MACD, candlesticks, RSI, etc., it often indicates that the market's potential reversal force is accumulating. The more divergences, the stronger the signal, and the probability of turning increases accordingly.
3. The current price stands above the previous platform or resistance area, confirming an effective breakout;
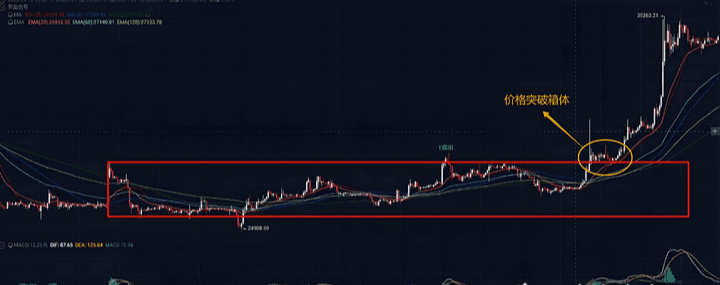
Summary: The core of the bullish entry logic lies in the confirmation of three-dimensional resonance—stability of trend structure, coordination of momentum indicators, and effective breakout of key positions. Only when all three elements come together can a higher probability entry situation be constructed. In this process, the sensitivity and stability of EMA and MA, along with MACD's momentum trend judgment and detailed recognition of support and resistance, together constitute the underlying support of this strategy.
Exit strategy:
Set reasonable take-profit points, such as previous highs/lows, 1.5~2 times the stop loss distance;
If MACD shows top divergence or the price breaks below the 20 moving average group (EMA20 and MA20), and the 20 moving average group shows a clear downward turn and crosses below the 60 moving average group (EMA60 and MA60), it can serve as a warning signal for market reversal or adjustment. At the same time, if the trading volume significantly increases and is accompanied by long shadows, it indicates that those who should buy have bought, and those who should sell have sold. If the market is at a relatively high/low level, it signals that the market may be releasing reverse momentum, and caution should be taken to consider reducing positions or exiting to avoid potential risks.
You may also adopt a combination of partial profit-taking + trailing stop to secure profits.
Three, key positions: technical structures determine victory or defeat
In this section, the focus is on the importance of the technical structure of "key positions" for trading success, emphasizing that even the best indicators cannot surpass the impact of support/resistance areas. Support and resistance areas are key zones for price reversals and breakouts, especially in short-term trading, where these areas often determine whether the market can continue or whether a reversal will occur.
Detailed summary:
1. The role of support/resistance areas: Support and resistance are not static; they are determined by historical market behavior. These areas represent concentrated price levels for market participants and are often the points where prices bounce or break through. By accurately judging support and resistance ranges, traders can control risk and make trading decisions at these key positions.
2. How to identify key positions: Highs and lows during the Asian and European sessions: These time periods' highs and lows often become reference points for support and resistance, especially after the market's initial reaction.
Previous consolidation range: The upper and lower bounds of historical consolidation ranges often serve as key price levels for subsequent trading, reflecting potential price reversal pressures.
Round numbers: such as 1.0900, 1.1000, etc., are price ranges widely monitored in the market, where prices often meet significant reactions.
3. Strengthen the confirmation of technical structures: Judging key positions should rely not only on price behavior but also combine other technical analysis tools (like candlestick patterns, Bollinger Bands, etc.) to confirm whether there is effective breakthrough or reversal. For example, if a strong reversal pattern (like a hammer or engulfing pattern) is seen in the support zone, consider making decisions based on this signal.
By accurately judging key positions in technical structures, combined with patterns, historical prices, and other technical indicators, traders can make more precise entry and exit decisions at critical moments. These "technical structures" determine short-term market direction, and successful trades often occur at these key positions with precise operations.
Four, risk management: strategies can generate profits, but discipline can save lives.
The essence of trading is not prediction but probability and control. Even the most precise strategies cannot succeed 100%, so the following controls must be included in the system:
1. Setting stop losses
Generally set between 10 to 15 points, or adjust to a suitable volatility range based on the ATR indicator;
Stop loss points should avoid the edges of recent volatility ranges to prevent being "stopped out";
2. Position control
The maximum risk per trade should not exceed 2% of the account balance;
For example: account of $1000, if the stop loss is 15 points, the maximum value per point should not exceed $1.33, calculate the appropriate lot size;
3. Take-profit mechanism
Fixed profit-loss ratio: like 1:2, 1:2.5;
Dynamic take-profit: Exit early on MACD divergence or EMA structure changes;
Partial profit-taking: Lock in some profits while allowing part to follow the trend's extension.
Five, in conclusion: Hold the rhythm in your own hands
The 15-minute chart is the art of rhythm. It does not pursue high frequency or blindly believe in long-term, but achieves a balance in "efficiency, rhythm, and control."
The essence of this strategy lies not in a single winning move but in: "Waiting for triple confirmation + precise execution + strict risk control."
If you always regret "not entering" after the market moves or frequently chase highs and get stuck, try to slow down your trading.
True experts are not those who predict the future but those who can recognize the current situation and act at critical points.
Serious declaration:
1. All the above content comes from my sharing of trading technical experience and is not specifically targeted at any market (including but not limited to stocks, forex, futures, digital currencies, etc.).
2. "Don't be anxious about trading" I never encourage or advocate investing in digital currencies, forex, stocks, and other trading markets because any market carries huge trading risks and may lead your principal to zero. Working hard, loving life, and improving your ability to earn money outside the market should always be the priority!
3. The charts, candlestick patterns, and technical indicators mentioned in this article are only historical data reviews and do not constitute investment advice or guidance. Risk is borne by the investor. The content described in the article represents only the author's personal views and may be entirely wrong. It does not constitute investment advice and is for reference only! Investment has risks, and trading requires caution!
The above are trading insights from ten years of experience in cryptocurrency trading, having gone through many ups and downs. These are heartfelt words of realization that I hope will be useful to everyone. Chen's work is guaranteed to be of high quality. In the crypto world, there are exceptional people who are unique and independent, with a soulful path and skill in cryptocurrency!
Even the most diligent fisherman would not go out to fish in the stormy season but would carefully guard his fishing boat. This season will pass, and a sunny day will eventually come! Follow Chen, and I'll teach you both fishing and how to fish. The cryptocurrency world is always open, and only by going with the trend can you have a life that goes with the trend. Save this and remember it in your heart!
$ETH $BTC #现货黄金创历史新高

