Ten years of deep cultivation in the cryptocurrency world, experiencing ups and downs. I entered the market in 2015, turning 500,000 into over 7 million at its peak. At that moment, I thought I was a trading genius, focusing on trading coins, even borrowing money to invest. However, reality taught me a lesson. I encountered continuous problems, not only losing all my profits but also accumulating heavy debts, ultimately having to sell my car, house, and other assets.
2017 was my darkest moment. In just a few months, I went from the peak to the bottom. Later, through reflection and summarization, I was fortunate to have tea with several big shots in the cryptocurrency world, discussing the trends in the coin market. Their words deeply resonated with me and shook my soul.

In the cryptocurrency circle, many friends may not know how to read K-line trading strategies, and those who do understand are few. As the saying goes, 'Master one skill and you can eat all over the world.' It’s not difficult to master a technical skill that you can understand. The difficulty lies in the unwillingness to learn. Trading cryptocurrencies is not for others, but for yourself. If you are willing to put in the effort to learn and master it, trading cryptocurrencies won't be as hard as you imagine.
In addition to solid skills, I strictly follow these six iron rules:
The first point is to focus on strong coins. When trading cryptocurrencies, we should keep our eyes on those coins that are rising well. If you're unsure, look at the 60-day moving average. If the line is above, we enter or buy more; if below, we quickly withdraw. This trick is quite effective and works most of the time.
The second point is to never chase highs. If a coin suddenly rises by more than 50%, you must not rush to follow in. Entering at this time can make you anxious. On the contrary, buying at low prices is safer, with lower risk, and you'll have a greater chance of making a profit in the future. #Hong Kong Stablecoin Regulations
The third point is to learn to look for bullish signals. Before a big rise, prices often fluctuate back and forth within a small range, about 10% to 20%, and the trading volume is not large. At this time, you can try to buy slowly at low prices, and you might catch the fast train of the upward trend.
The fourth point is to closely follow new hotspots. When a new hotspot appears in the market, it is bound to be particularly popular in the first few days. At this time, following the big money bags usually leads to easy profits.
The fifth point is to remain calm when a bear market arrives. If a bear market comes, you must stay steady and preferably refrain from taking action for at least six months. During poor market conditions, minimize operations and take more breaks; this is the hallmark of a skilled cryptocurrency trader.
The sixth point is to regularly review and adjust strategies. Every week, take a look back at how you operated. Don't just focus on how much money you made; it's important to assess whether the strategy is correct. If it is, stick to it; if not, change it. After a few months, your trading strategy will surely become more reliable.
When trading, you must pay attention to K-lines, as they represent price changes and are the most basic elements of charts.
The study and use of K-lines are divided into two main parts: one is K-line combinations, and the other is K-line combination patterns.
K-line combinations include a single K-line, two K-lines, three K-lines, four K-lines, etc. Based on K-line combinations, today I present to you the K-line combination patterns.
It should be noted in advance:
1. The continuation effect of patterns after they form in different time cycles varies. The premise everyone needs to understand is that in trading, one cannot escape probability. Generally, the larger the time cycle, the higher the probability of success after the pattern appears, because the formation of patterns requires time, and the longer the brewing time, the greater the energy. The effects of daily chart patterns are certainly different from those of 5-minute chart patterns. #Breakout Trading Strategy
2. Regarding the profit-loss ratio of trading patterns, generally, if entering on a breakout, a 1:1 profit is easily realized. If the market moves more smoothly, cases exceeding 1:1 also occur. At this time, the pattern has become a temporary bottom for this segment of the market, and there may be greater upside potential.
Below, I have organized several common and practical trading patterns in the market, along with historical examples.
One, double top and double bottom pattern
The double top and double bottom patterns are also known as M-tops and W-bottoms. After these patterns are formed, they resemble the English letters M and W. The example here is based on the M-top, with the W-bottom being similar.
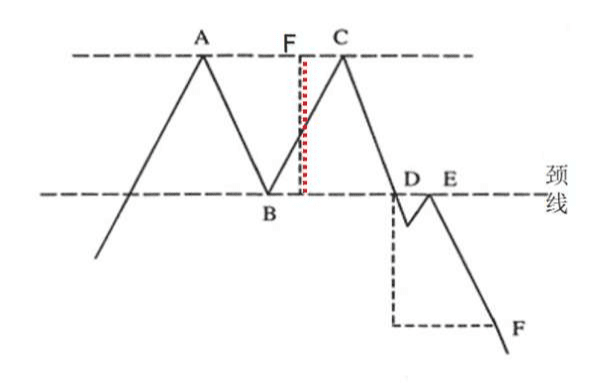
Trading methods: (Taking the pattern 1:1 as an example)
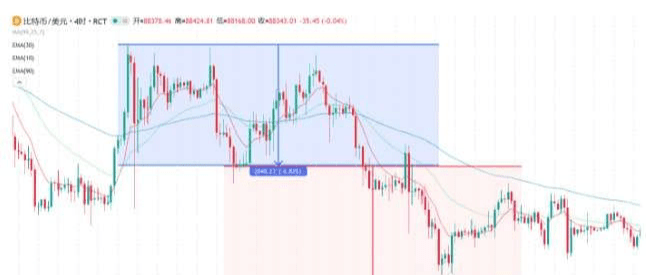
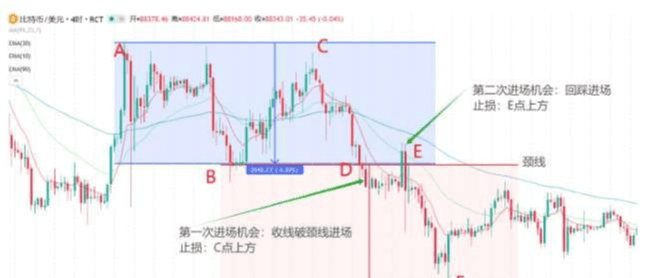
As shown in the figure, this is a segment of M-shaped market for Bitcoin. After entering a short position near the neckline, a quick profit of 1:1 was realized. The blue vertical distance in the figure represents the estimated target profit, and the red distance represents the actual target profit.
1
Enter on a break
Enter directly at the neckline break point in the market. You can either enter manually or use a pending order. After entering, directly set the stop-loss above point C, the right shoulder's high. The advantage of entering on the break is that you won't miss the market, but the downside is a larger stop-loss space. In this example, the profit-loss ratio is closer to 1:1.
2
Enter on a pullback
After the market breaks through the neckline, the pattern establishes a trend reversal. Wait for the market to pull back to the neckline and appear a reversing K-line before entering. Set the stop-loss above the reversing K-line, which is above point E in the figure. The advantage of entering on a pullback is a smaller stop-loss space and a larger profit-loss ratio. The downside is that if the market does not pull back, you might miss this trading opportunity.
Two, head and shoulders top, head and shoulders bottom
Taking the head and shoulders bottom as an example, it consists of three peaks, with the middle peak significantly lower than the peaks on the left and right. The illustration shows the standard head and shoulders bottom pattern. It's important to emphasize that in real-market conditions, the standard structure shown in the illustration may not always appear. More often, the patterns are variations of combinations. If every pattern appeared so perfectly, wouldn't everyone be able to make money? Therefore, we need to remember the key points of each pattern and compare and contrast them with historical markets. This way, when a similar pattern occurs in the next market, we can recognize its true nature at a glance!
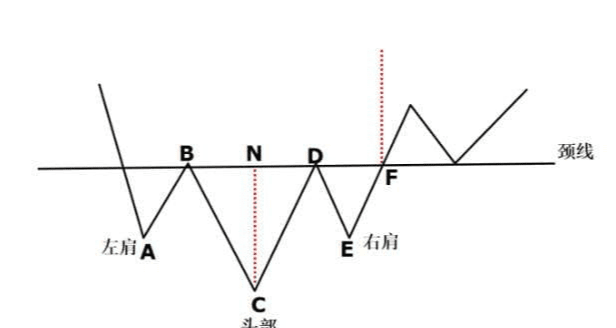
After a wave of downward trend, the two shoulders formed are roughly at the same level. When the market wants to continue to make lower lows, it does not exceed the previous low but only reaches the left shoulder's position. Subsequently, the market breaks through the neckline, closing above the neckline, establishing the head and shoulders bottom pattern. The head and shoulders top pattern is similar and is a mirror image of the head and shoulders bottom pattern. #SEC ETF Approval
The following figure is an example of a head and shoulders bottom for gold XAUUSD on a 4-hour chart:
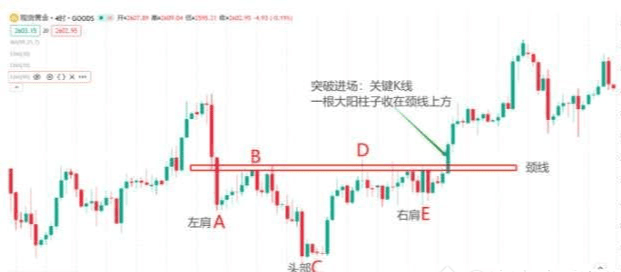
The figure shows a typical 'not so standard' head and shoulders bottom. The peaks of the shoulders on both sides are not that low, but the key condition has been met: the peak of the head is much lower than those on the left and right.
1
Enter on a break
Enter directly at the neckline break point in the market. You can either enter manually or use a pending order. After entering, directly set the stop-loss below point E of the right shoulder.
2
Enter on a pullback
After breaking through the neckline in the market, the pattern establishes a trend reversal. Wait for the market to pull back and stabilize at the neckline before entering. You can wait for a reversing K-line, and set the stop-loss at the low of the reversing K-line.
03
Three, flag pattern consolidation
Flag consolidation is more often used as a continuation pattern. A continuation pattern, as the name suggests, appears while the market is still ongoing, indicating the market is taking a brief break and does not mean the market has ended. The pullback magnitude of continuation patterns is generally small, indicating a strong original trend. After the market breaks through, the profits can be considerable. The standard structure of flag consolidation: Before forming the flag consolidation structure, there is usually a rapid upward or downward market, followed by a consolidation that tilts in the opposite direction of the original trend. After repeated fluctuations, the market again breaks through the flag consolidation channel line. As shown in the figure, viewing the chart directly is more intuitive.
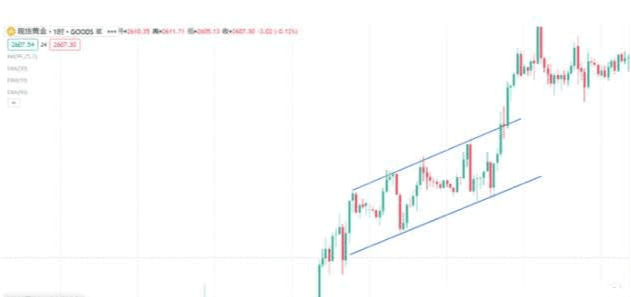
The figure shows the one-hour chart of gold XAUUSD, where the market begins a flag consolidation trend after a wave of upward movement. After accumulating strength, it breaks through the upper rising channel line of the flag, establishing the flag consolidation, and then the market rises significantly.
1
Enter on a break
Enter when the price breaks through the flag consolidation channel, and set the stop-loss at the high or low of the flag consolidation.
2
Enter on a pullback
After the market breaks through the flag channel, wait for the market to pull back to the channel line and form a reversing K-line. Set the stop-loss at the high or low of the reversing K-line.
03
Four, triangular consolidation
Triangular consolidation is the most frequently occurring continuation pattern. Pattern standard: Before the triangular consolidation, there is usually a rapid upward or downward market, followed by a consolidation that tilts in the opposite direction to the original trend. The entire structure resembles a triangle. After consolidation, the market breaks through the trend line of the triangular structure, establishing the triangular consolidation structure. Common triangular consolidations mainly include symmetrical triangles, ascending triangles, and descending triangles.
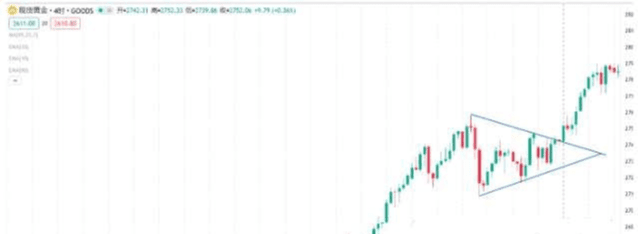
As shown in the figure, this is a symmetrical triangular consolidation. After an upward movement, a triangular consolidation is formed, with a converging trend structure inside the triangle. The consolidation space gradually compresses, and then it breaks out and develops into a bullish trend.
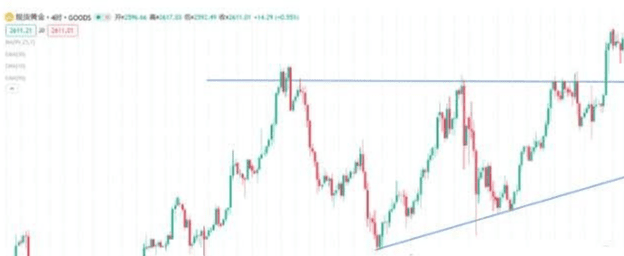
As shown in the figure, this is a rising triangle consolidation. After a relatively slow upward movement, a very wide consolidation unfolds. Internally, a converging trend of 123 waves is formed, and the market quickly rises after breaking the level.
1
Enter on a break
Enter when the price breaks through the triangular consolidation trend line, and set the stop-loss at the high or low of the triangular consolidation.
2
Enter on a pullback
After the market breaks through the triangular consolidation trend line, wait for the market to pull back to the trend line and form a reversing K-line before entering. Set the stop-loss at the high or low of the reversing K-line.
Regarding triangular consolidation, the following points should be noted:
1. Inside the triangular consolidation, a converging structure of '123' waves or '12345' waves is usually formed.
2. The breakout of a triangle usually occurs about 2/3 of the way through the entire triangular consolidation structure.
03
Five, rectangular consolidation
Pattern standard: A rectangular consolidation displayed on the chart is formed after a wave of upward or downward market. The upper and lower edges of the rectangle are two clearly defined horizontal support and resistance lines. Since rectangular consolidation is horizontal, it has the smallest pullback amplitude among consolidation patterns and is the strongest trend consolidation pattern. After consolidation, the market breaks through the upper or lower edge of the pattern, establishing the rectangular consolidation structure. As shown in the figure:
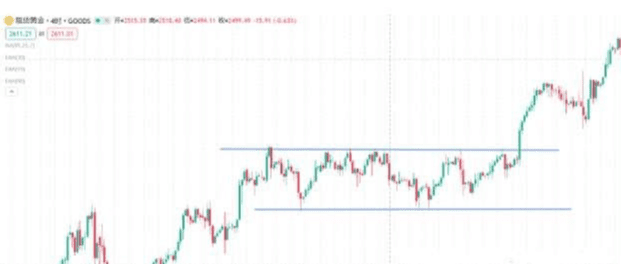
The chart shows the 4-hour chart of gold XAUUSD, where the market begins horizontal consolidation after a wave of upward movement. Subsequently, the market breaks through the upper edge of the consolidation, continuing the bullish trend.
1
Enter on a break
Enter when the price breaks through the upper or lower pressure line of the rectangular consolidation. The upper and lower edges of the rectangle basically remain horizontal, so setting the initial stop-loss is relatively straightforward. The difficulty with rectangles is that before breaking out, it's hard to predict whether it will be a box shape or a triple top (or bottom) pattern. Therefore, whether shorting at the upper edge or going long at the lower edge, the stop-loss should be kept 2 to 3 dollars away from both edges.
2
Enter on a pullback
After the market breaks through the upper or lower pressure line of the rectangular consolidation, wait for the market to pull back to the pressure line and form a reversing K-line before entering. Set the stop-loss at the high or low of the reversing K-line.
03
Finally
In fact, no matter how you enter the market, there are pros and cons. There is no perfect way in the world, only a way that suits you better. For some traders, missing the market is more painful than making a wrong trade, so breaking the level to enter is more suitable. For conservative traders, focusing on a higher profit-loss ratio is more suitable for entering on a pullback. If you want to balance both, you can enter the market in batches and adopt the strategy of adding positions on pullback reversals, which relates to position management. If you're interested in learning more, feel free to comment: position management.
The above are the most practically significant K-line combination patterns. These patterns can be used in different markets, different varieties, and different cycles, suitable for most traders to learn and use.
Even the most diligent fisherman wouldn't go out to sea during a stormy season, but would carefully guard his fishing boat. This season will pass, and a sunny day will eventually come! Follow Lao Chen, who teaches you to fish as well as fishing techniques. The cryptocurrency world is always open, and only by going with the trend can you lead a life in sync with the trend. Save this, and keep it in mind!
$ETH $BTC #现货黄金创历史新高


