Bitcoin is trading close to $111,000, testing the key support level of $107,000–$108,900. A rebound to $113,600 may face continued selling pressure, while deeper potential targets look towards $93,000–$95,000. Current losses remain shallow, spot demand is neutral, and perpetual contracts are leaning bearish but performing moderately.
Fill the gap
Market enters the second week of retreat from the historical high of $124,000.
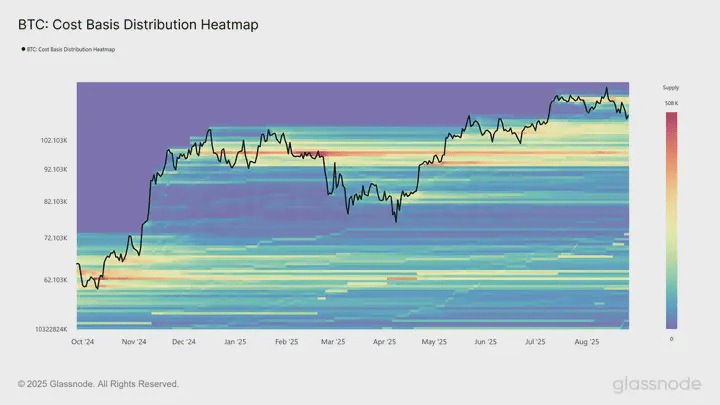
The CBD heatmap provides a visualization of the concentration of supply at different acquisition price levels, highlighting important parts of the tokens' last transfers. Each color band reflects dense areas of cost basis, which typically act as natural support or resistance zones.
Currently, Bitcoin is trading close to $111,000, hovering just above the lower edge of the 'price gap.' The latest retreat allows for the redistribution of supply at a discounted price, gradually filling the gap. Notably, since December 2024, a thick supply cluster has formed between $93,000 and $110,000, gradually becoming a potential bottom.
This accumulation helps explain the current resilience above $110,000, suggesting that further correction requires either significant short-term selling pressure or a longer-term demand deficiency sufficient to make these investors capitulate to sell.
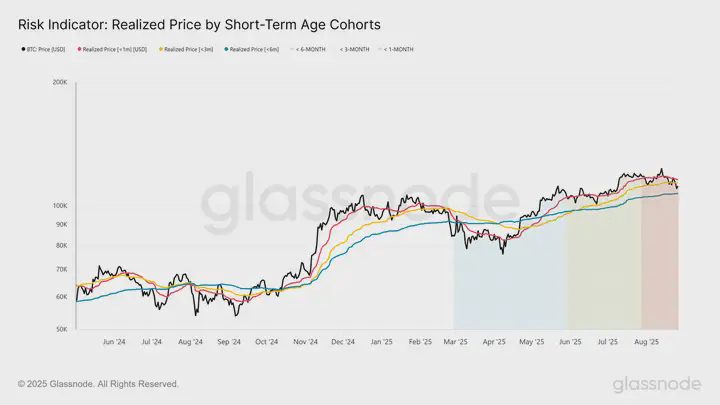
Currently, Bitcoin is trading below the cost basis of 1-month ($115,600) and 3-month ($113,600) holders, putting these investors under pressure. Thus, any relief rebound may encounter resistance as short-term holders seek to exit at breakeven.
More critically, the 6-month cost basis is around $107,000. Continuing to drop below this level may trigger fear, accelerating downward momentum towards the lower edge of the support supply cluster highlighted in the CBD heatmap.
Medium-term risk
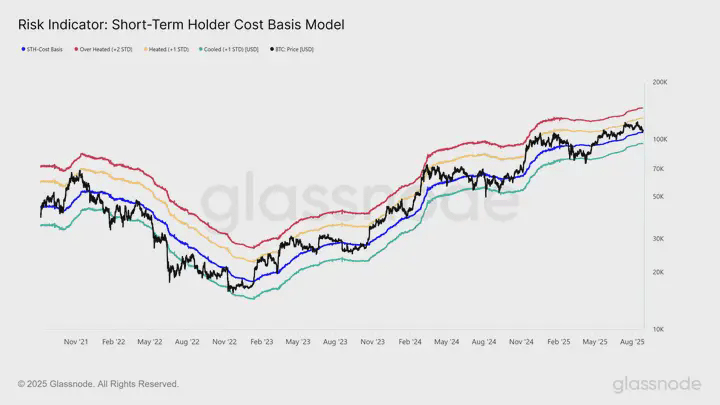
If the current weakness persists, trading continuously below the short-term holders' cost basis near $108,900, history suggests caution. In past cycles, such breakouts have often foreshadowed the start of several months of bearish phases, as new investors sell without realizing losses.
This risk is framed by 4-year statistics, where previous bearish retreats typically ended near one standard deviation below the cost basis of short-term holders. For the current cycle, this lower limit is estimated to be around $95,100. Therefore, if Bitcoin fails to regain a foothold above the $107,000–$108,900 threshold, the potential mid-term bottom may form in the $93,000–$95,000 area, consistent with the dense support cluster highlighted earlier in the CBD heatmap.
Perpetual contracts lean bearish
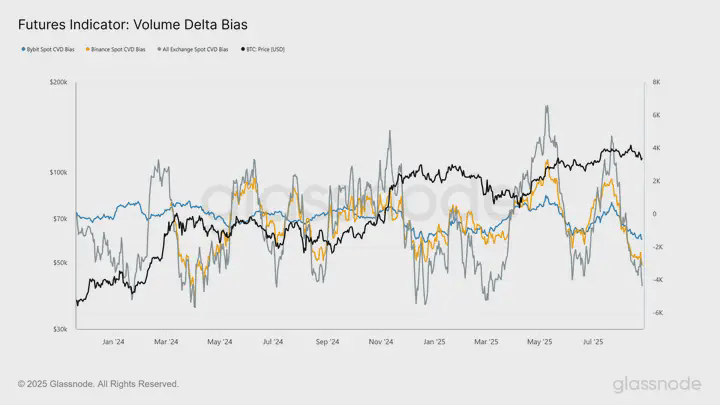
In contrast to the neutral tone of the spot market, the situation in perpetual futures has decisively turned bearish. Since July, the CVD of Binance, Bybit, and aggregated exchanges has shifted to the negative zone, indicating increasing selling pressure imbalance. This suggests that perpetual traders (typically the more speculative part of the market) tend to short during recent retreats.
That said, this indicator is highly volatile, often reaching extremes of buying and selling pressure in the short term. While the current bias highlights an increasingly bearish trend, it should be closely monitored to confirm whether this negativity is a sustained trend or proves to be a transient fluctuation in perpetual contracts.
Bitcoin's retreat to $111,000 puts the market to test a key range. The recent investors' cost basis of $107,000–$108,900 marks critical support; losing this will open the path to $93,000–$95,000, where a dense supply cluster may form a mid-term bottom. A rebound to $113,600 is possible but may face resistance as pressured short-term holders sell during strength. Before a clear positive signal appears, the market may lean towards consolidation rather than a sustained rapid rise. Let's see how the data looks in the next couple of days.

