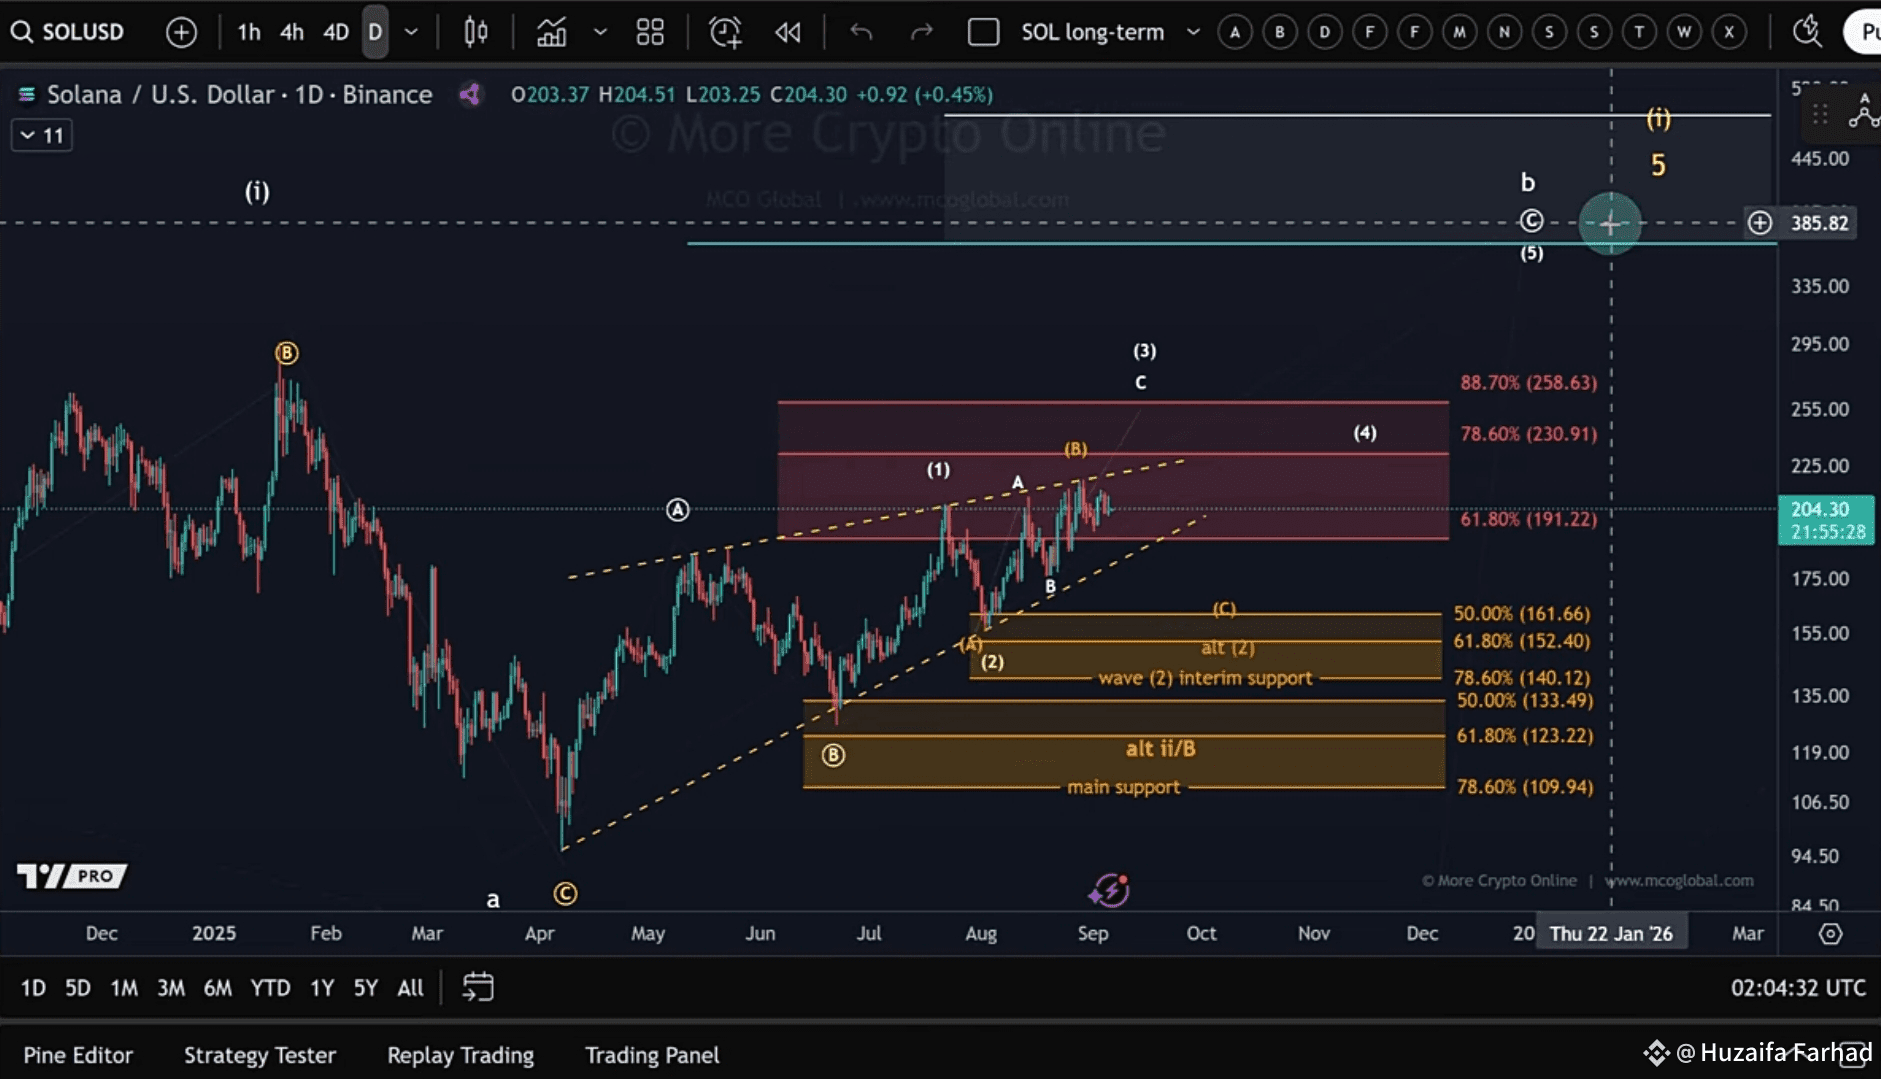
Solana ($SOL ) continues to trade inside an ascending wedge pattern on the daily chart. As we head into the weekend, the bullish Elliott Wave structure remains validbut only as long as price holds above key support areas.
🔑 Key Support and Resistance Levels
Daily Support Zone: $140 – $161
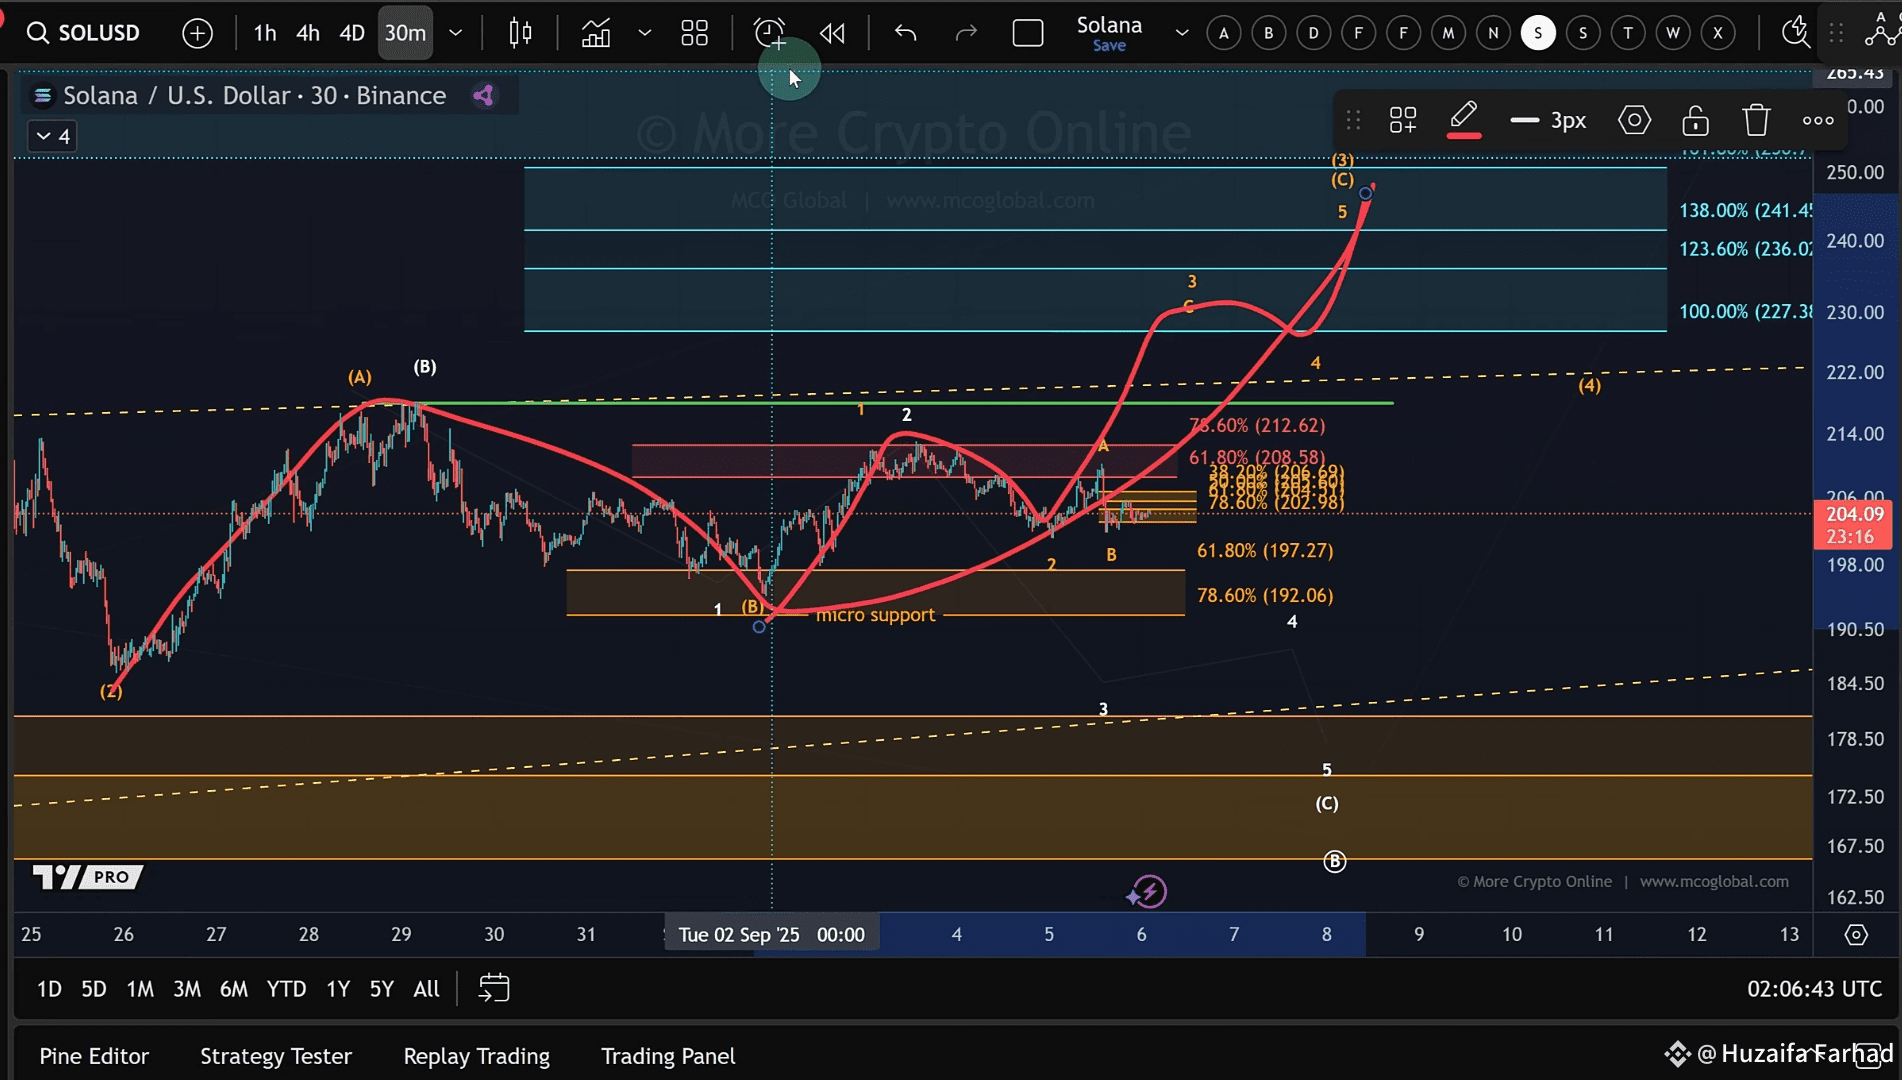
Short-Term Support: $192 – $197
Immediate Resistance: $208 – $212
Lower Support (if broken): $166 – $181
At the moment, SOL is stuck between $192 support and $212 resistance—a classic “no man’s land.” A break on either side of this range will likely decide the next move.
📊 Elliott Wave Perspective
From the April low, Solana may still be in a wave C to the upside, which ideally unfolds as a five-wave move. A possible wave 1–2 setup has formed, but the lack of upside momentum since Thursday’s low makes the structure questionable.
If $SOL breaks above $212, it could trigger a rally towards $360–$380.
If $SOL loses $192, price could revisit $166–$181, where the trendline support lies.
⚖️ Market Sentiment
At present, Solana’s price action reflects a balance of forces:
Bulls need a breakout above $212 to regain control.
Bears will aim for a breakdown below $192 to unlock lower supports.
Until then, we may see sideways consolidation or even the development of a triangle formation.
📝 Final Thoughts
Solana remains in a tight range, with $192–$197 as key weekend support and $208–$212 as critical resistance. A decisive break from this zone will shape the next leg of the trend.