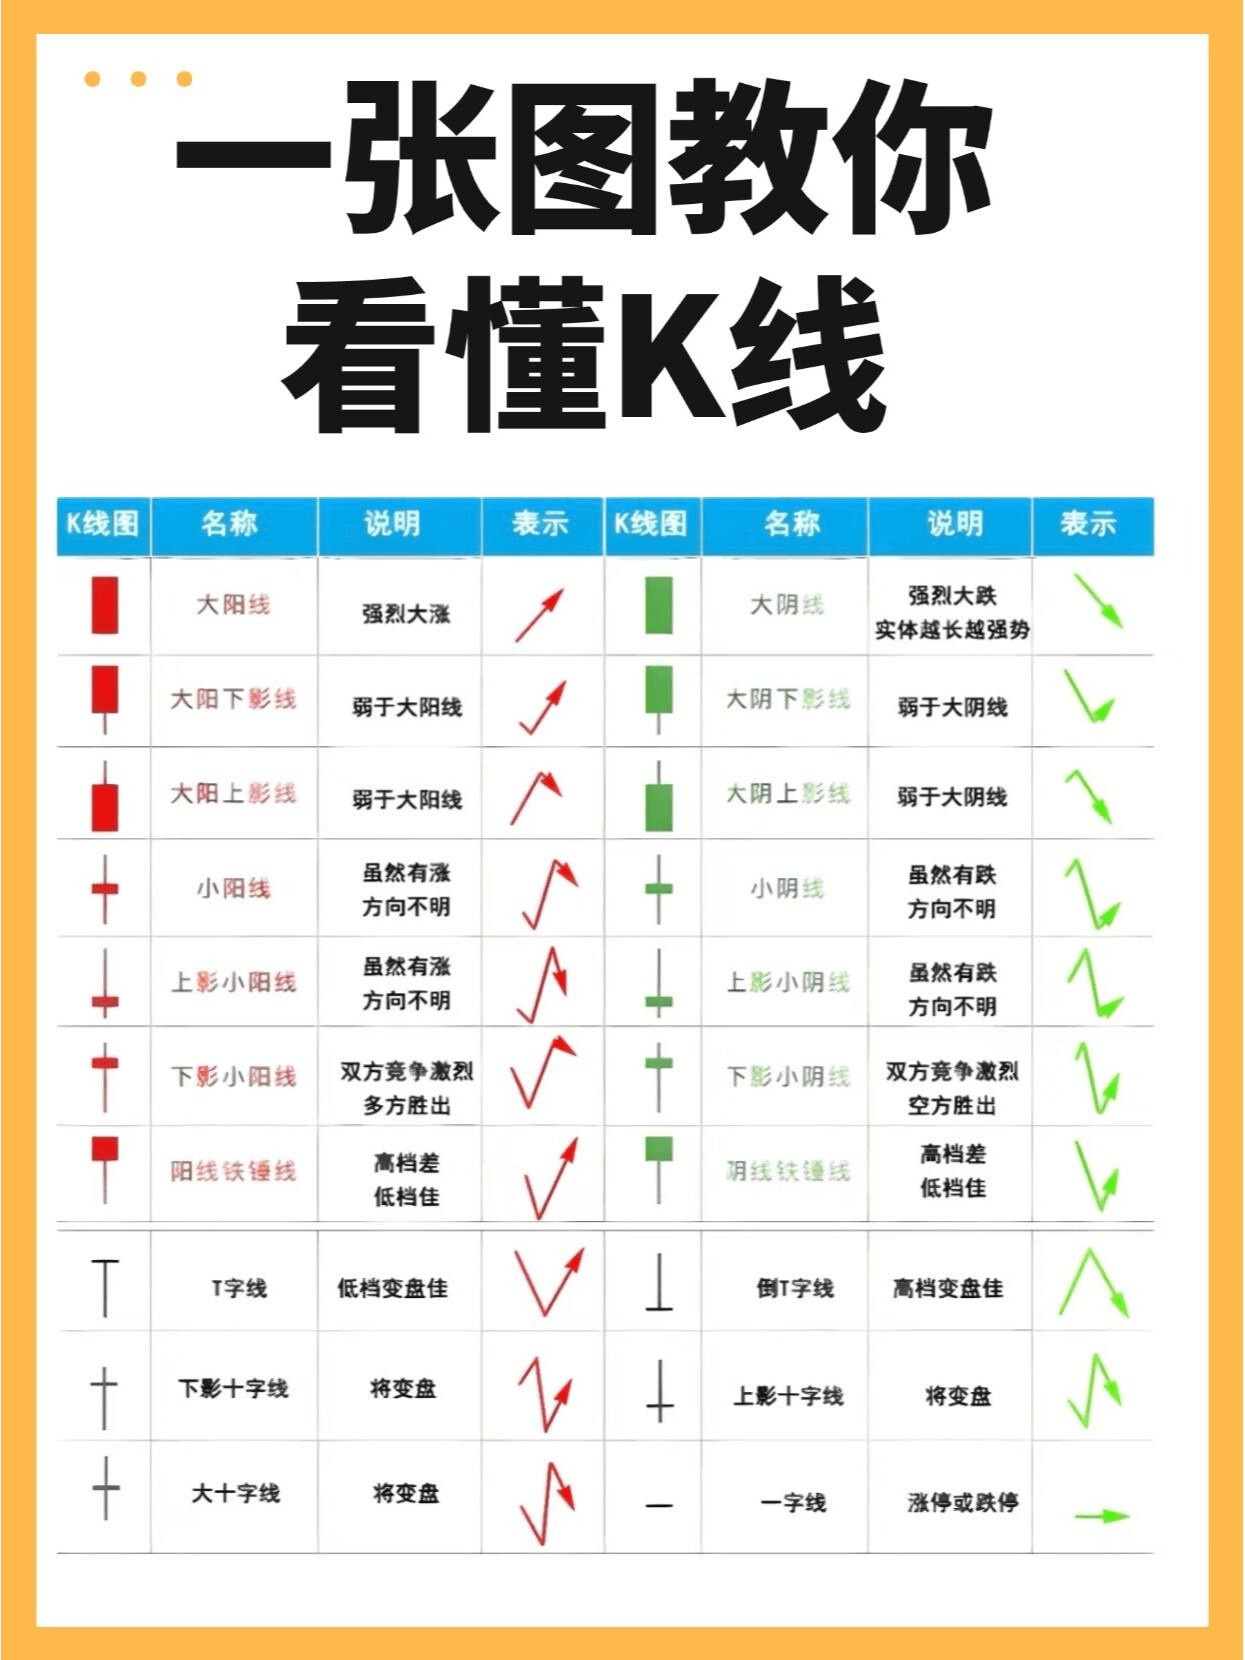
[Star R] Basic Composition of Candlesticks
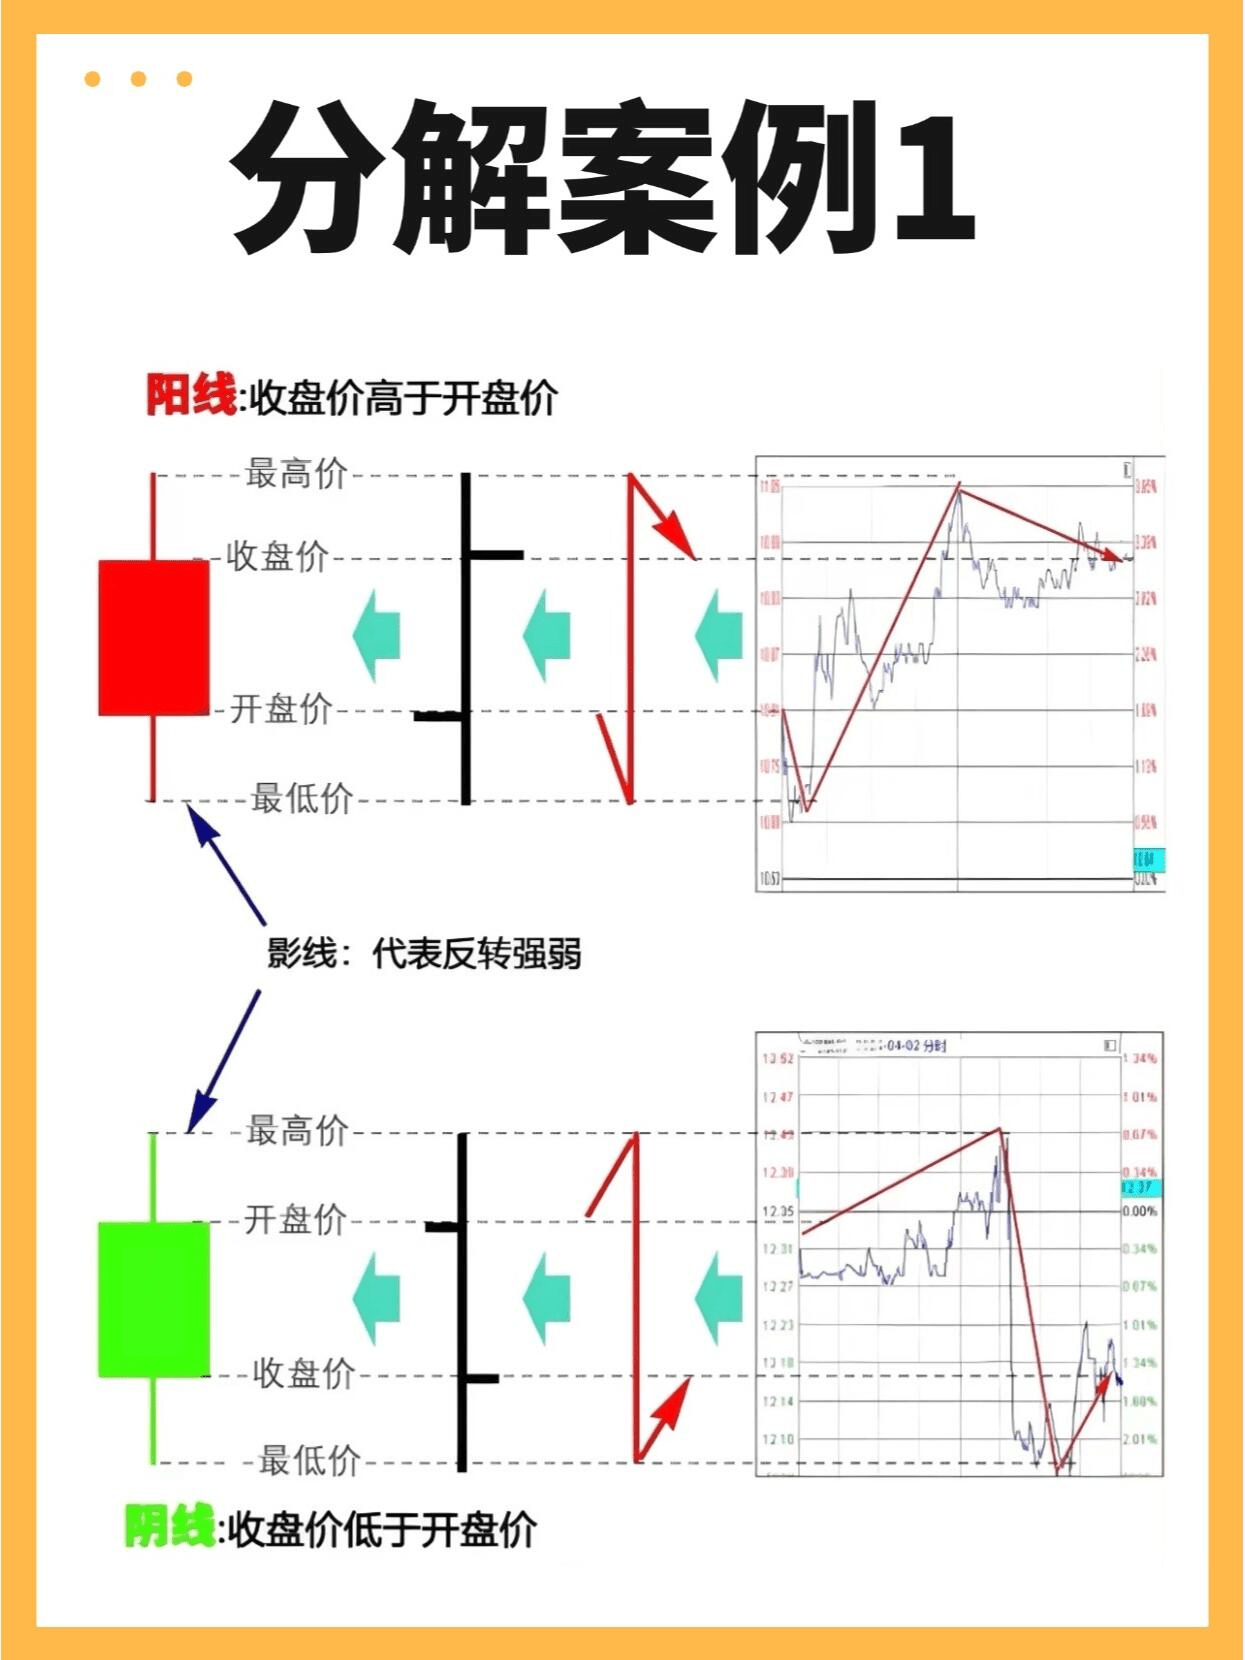
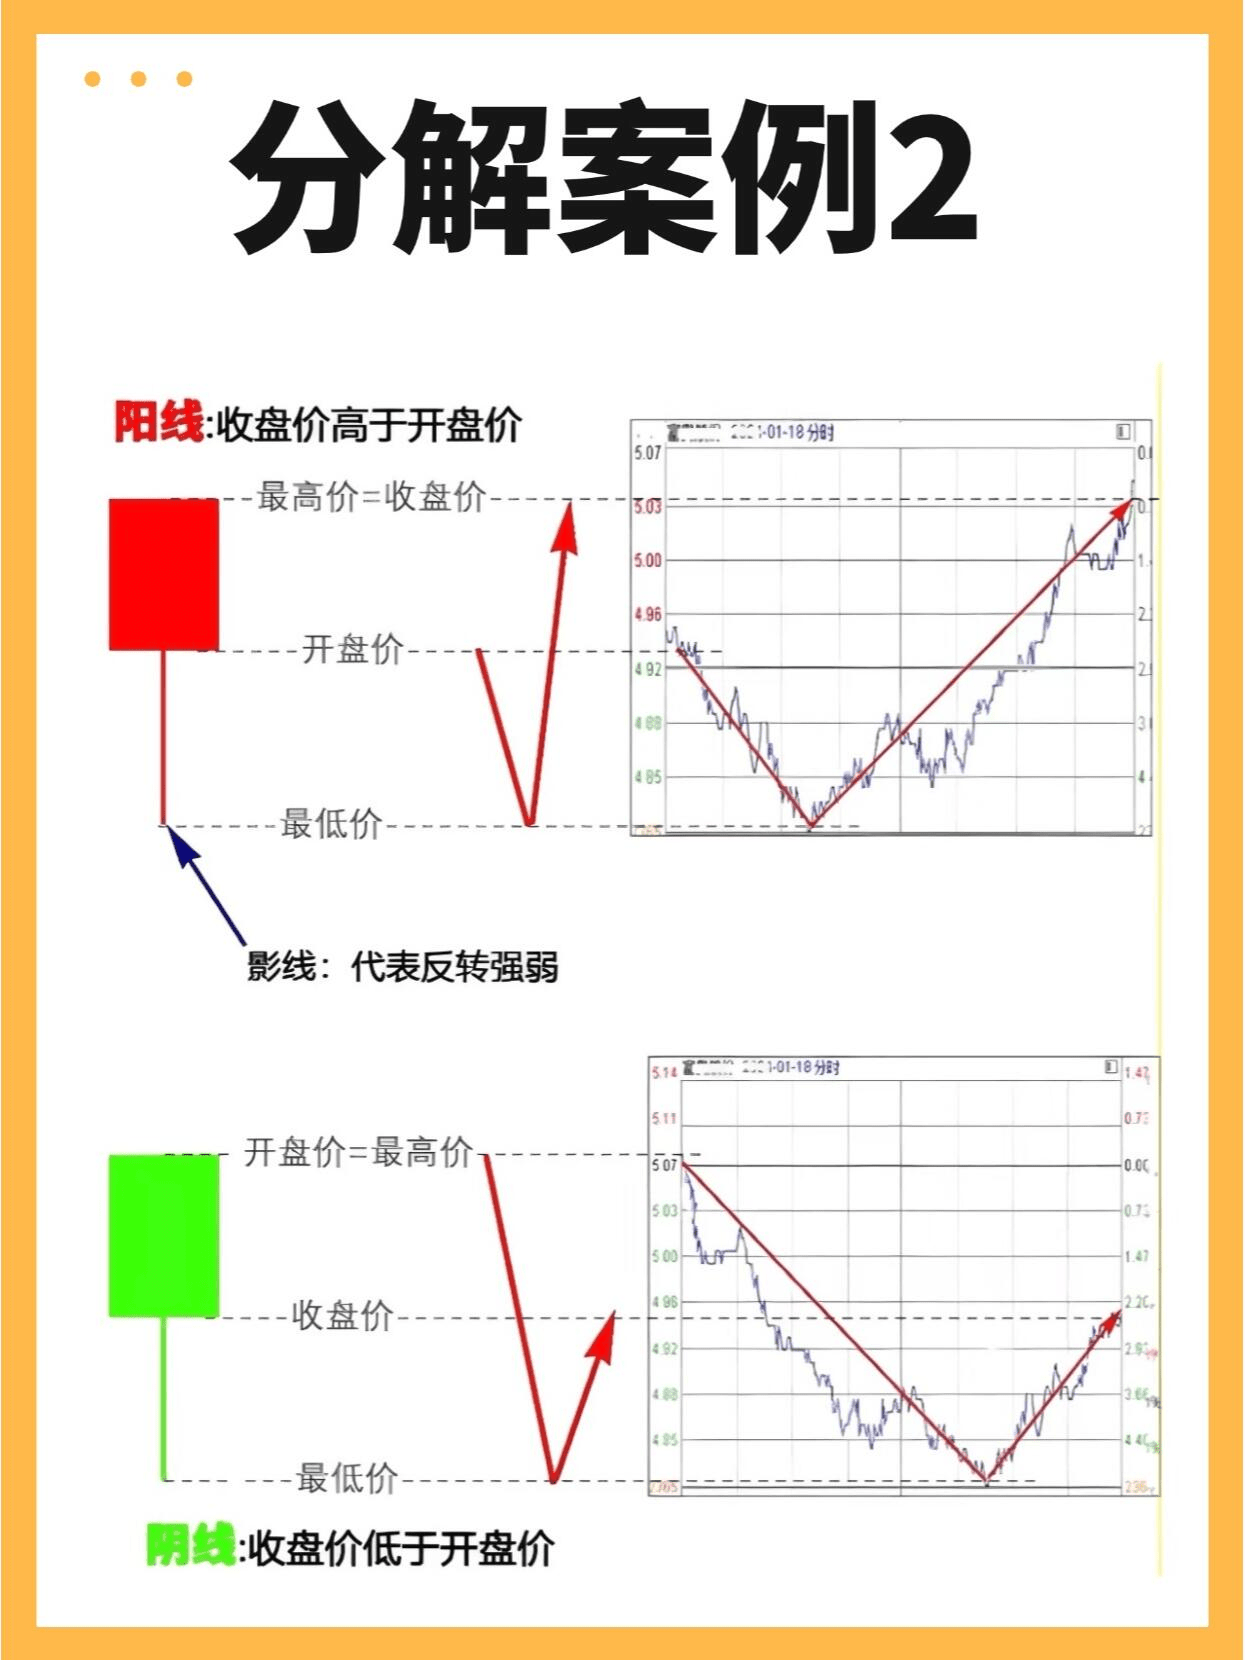
Opening Price: The initial transaction price of the trading day.
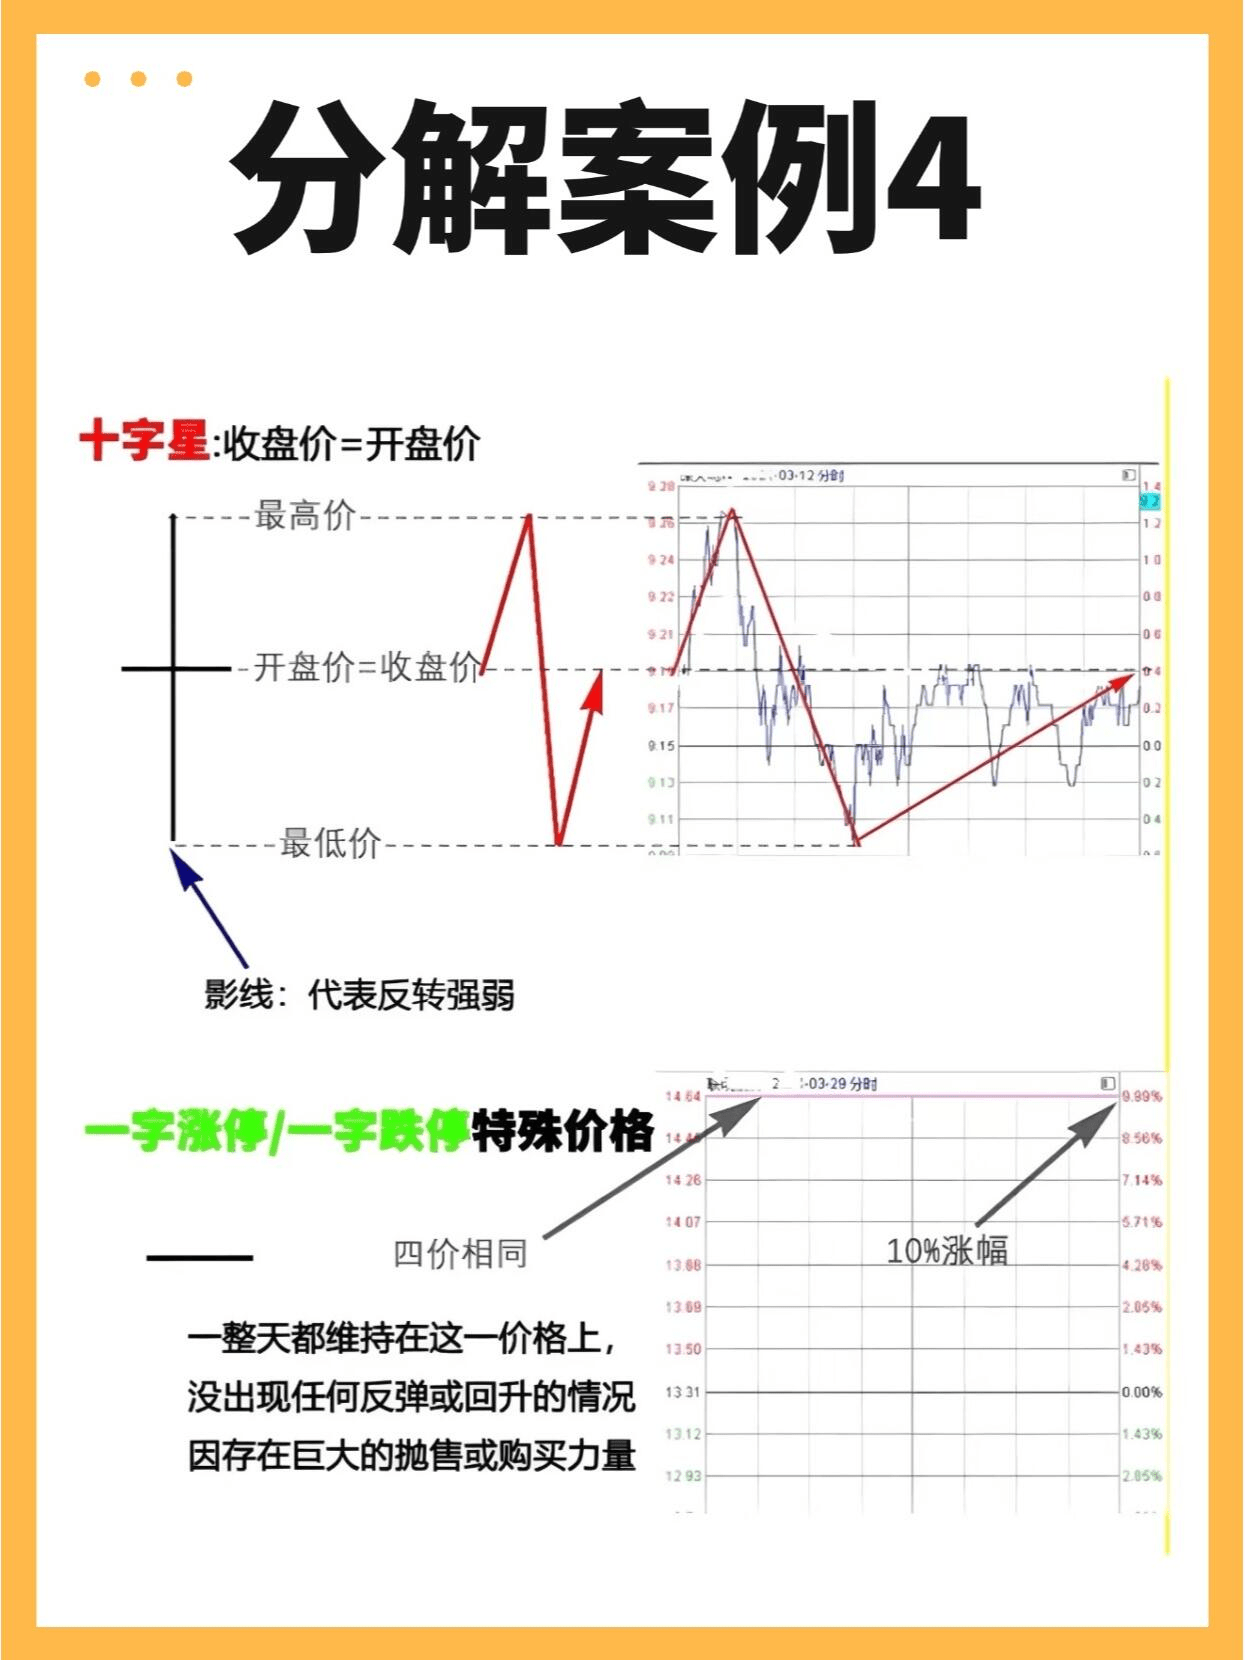
Closing Price: The final transaction price of the trading day.
Highest Price: The highest transaction price within the trading day.
Lowest Price: The lowest transaction price within the trading day.
A candlestick typically consists of three parts:
Upper Shadow: Located above the candlestick, indicates the price range between the highest price and the closing price (or opening price, depending on the candle's bullish or bearish nature).
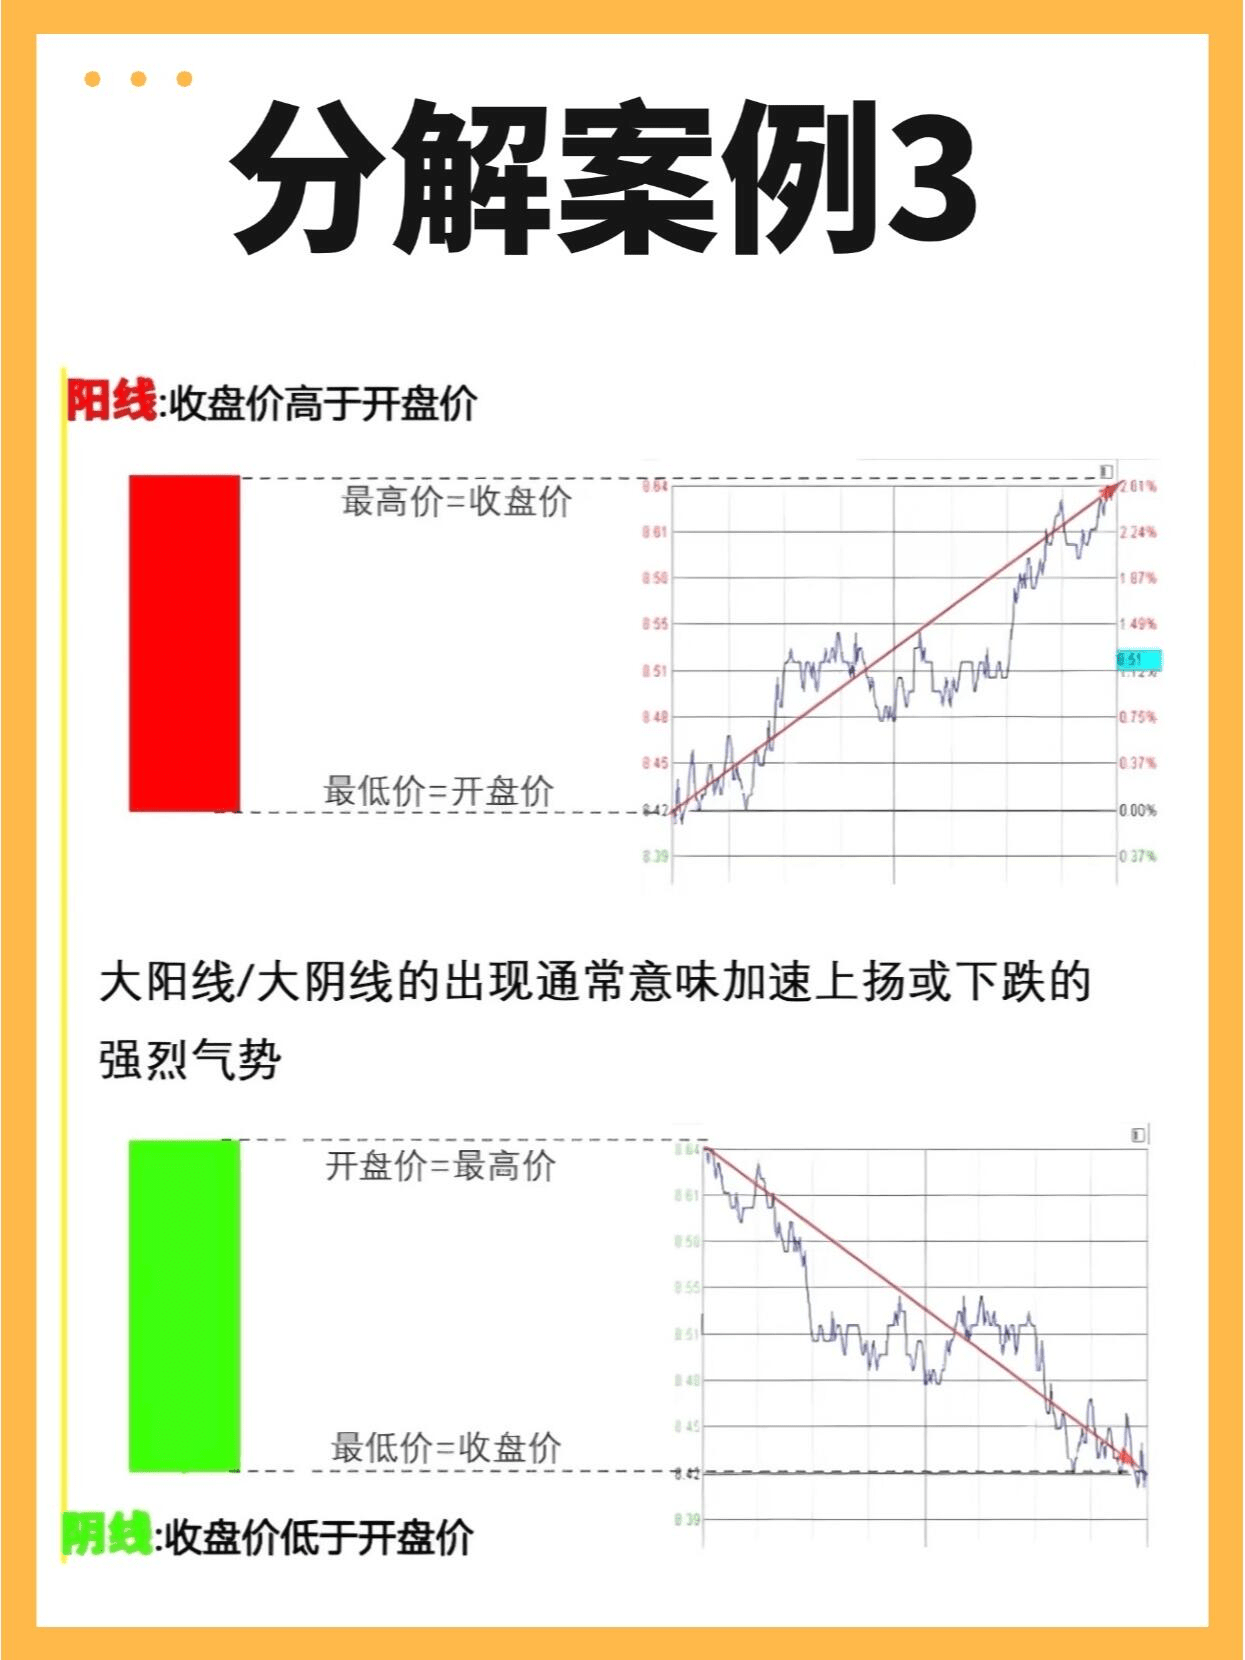
Body: Represents the price range between the opening price and the closing price. A bullish candle (red or white) indicates that the closing price is higher than the opening price, while a bearish candle (green or black) indicates that the closing price is lower than the opening price.
Lower Shadow: Located below the candlestick, indicates the price range between the lowest price and the opening price (or closing price, depending on the candle's bullish or bearish nature).
[Star R] Method for Interpreting Candlesticks
Interpretation of a Single Candlestick
Bullish and Bearish Candles: A bullish candle indicates an upward movement in the market during that period, while a bearish candle indicates a downward movement.
Body Size: The longer the body, the stronger the market's attack force. A longer bullish body indicates sufficient upward momentum; a longer bearish body indicates greater downward momentum.
Shadow Length: The longer the shadow, the stronger the resistance or support in that direction. A longer upper shadow indicates greater resistance to upward movement; a longer lower shadow indicates stronger support.
Interpretation of Candlestick Patterns
Double Bottom and Double Top: A double bottom (W bottom) signals a market transition from downward to upward; a double top (M head) signals a market transition from upward to downward.
Head and Shoulders Bottom and Top: A head and shoulders bottom is a pattern indicating a market reversal to the upside, while a head and shoulders top indicates a market reversal to the downside.
Pregnancy Line: A pregnancy line typically indicates that the market may be about to reverse.
Doji: A doji indicates that the opening price and closing price are the same within that period, showing a balance of power between bulls and bears. If it appears at a high position, it may indicate a top; if it appears at a low position, it may indicate a bottom.
Red Three Soldiers and Three Black Crows: Red three soldiers are three consecutive bullish candles, indicating a strong market uptrend; three black crows are three consecutive bearish candles, indicating a weak market downtrend. However, it should be noted that three black crows during an uptrend may represent accumulation of strength by the bulls.
Combining Position and Volume
Position: The position of the candlestick is crucial for determining its nature. For example, a long upper shadow appearing at the beginning of an uptrend may indicate a test by the main forces, while a long upper shadow appearing at the end of an uptrend may signal a top.
Volume: Trading volume is an important indicator for assessing market trends. In candlestick charts, trading volume is usually analyzed in conjunction with the size or color of the candlestick body. For example, a bullish candle with increasing volume usually indicates sufficient upward momentum; while a bearish candle with increasing volume may indicate strong downward momentum.