In the cryptocurrency circle, these candlestick theories only apply to some extent; not all indicator analyses are useful in the cryptocurrency market. Although the accuracy of candlestick techniques is not one hundred percent, and many candlestick knowledge seems not very useful after learning, according to the experiences of many experts, candlestick techniques still play a key role in long-term analysis of cryptocurrency prices. Whatever direction the cryptocurrency price is heading will be reflected in trading. We can use these techniques to understand the trends of cryptocurrency prices. Candlestick analysis is about probabilities and guides you towards a bright path when you feel lost.
Without further ado, let's get into the main topic.
Today we mainly focus on basic indicator strategies:
1. Usage and settings of moving averages.
2. RSI Indicator + Usage 3 Value Investment.
1. How to use moving averages to judge trends.
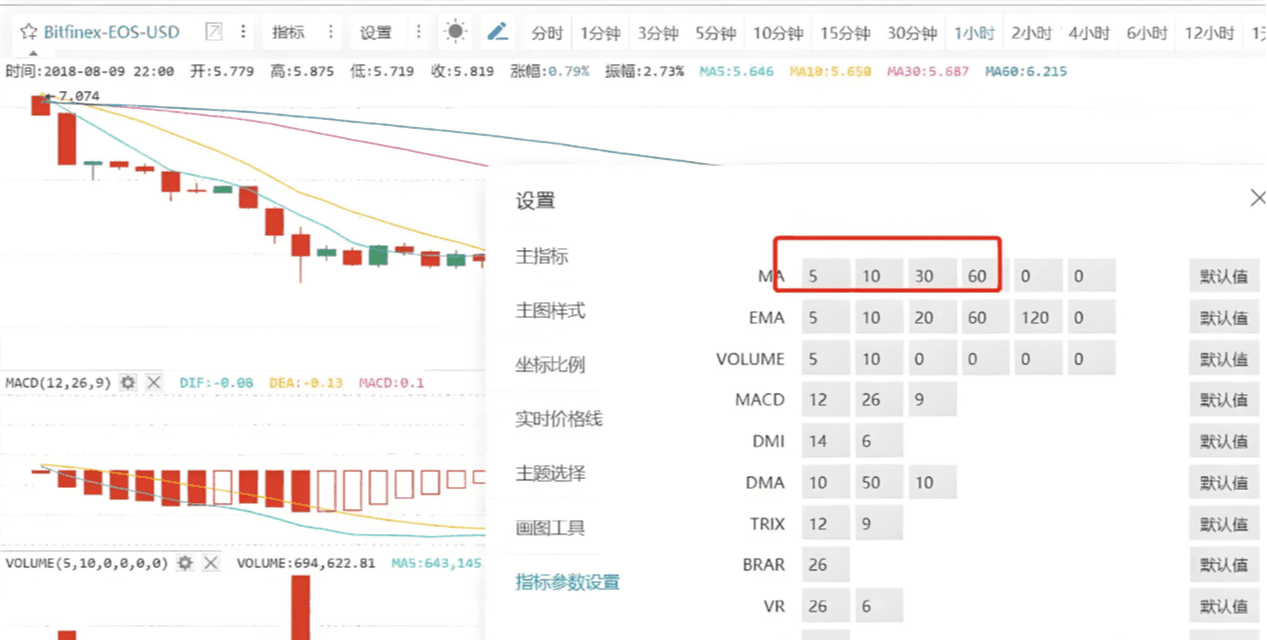
1. First, let's learn how to set indicators.
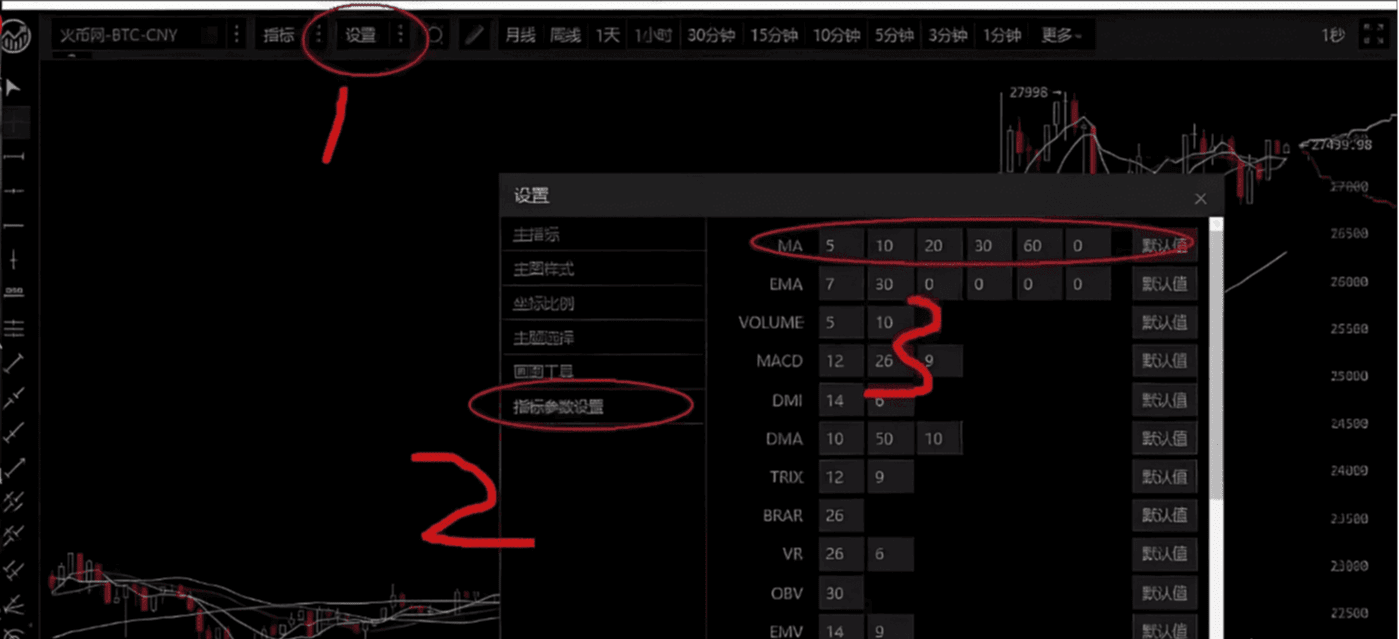
Due to some updates on Huobi, if you can't find it, you can directly click the line with the mouse.
You can see these lines and directly click on them to change.
After opening, you can change it directly here. The moving averages we need to use are: 5-day line, 30-day moving average, 60-day line, and 120-day line. If you feel it’s not useful, you can even change the 5-day line to a 4-day line for a more agile market response.
2. Short-term moving average indicators: 5-day line strategy.
The commonly used short-term line is the 5-day line.
What is the 5-day line? The 5-day line is the sum of the closing prices over five days divided by five.
Typically, the system is set to the weekly line, which essentially uses the average price over a week as the moving average. However, a week's time is too long and reacts relatively slowly. Of course, there are also experts who use the 4-day line, etc. These can be visually displayed through settings.
The 5-day line is the most practical for short-term judgment.
The 5-day line represents the holding price level over the past five days, indicating the buying and selling signals within that time, representing the range everyone can bear, which is the average holding cost. Therefore, changing the moving average is the same.
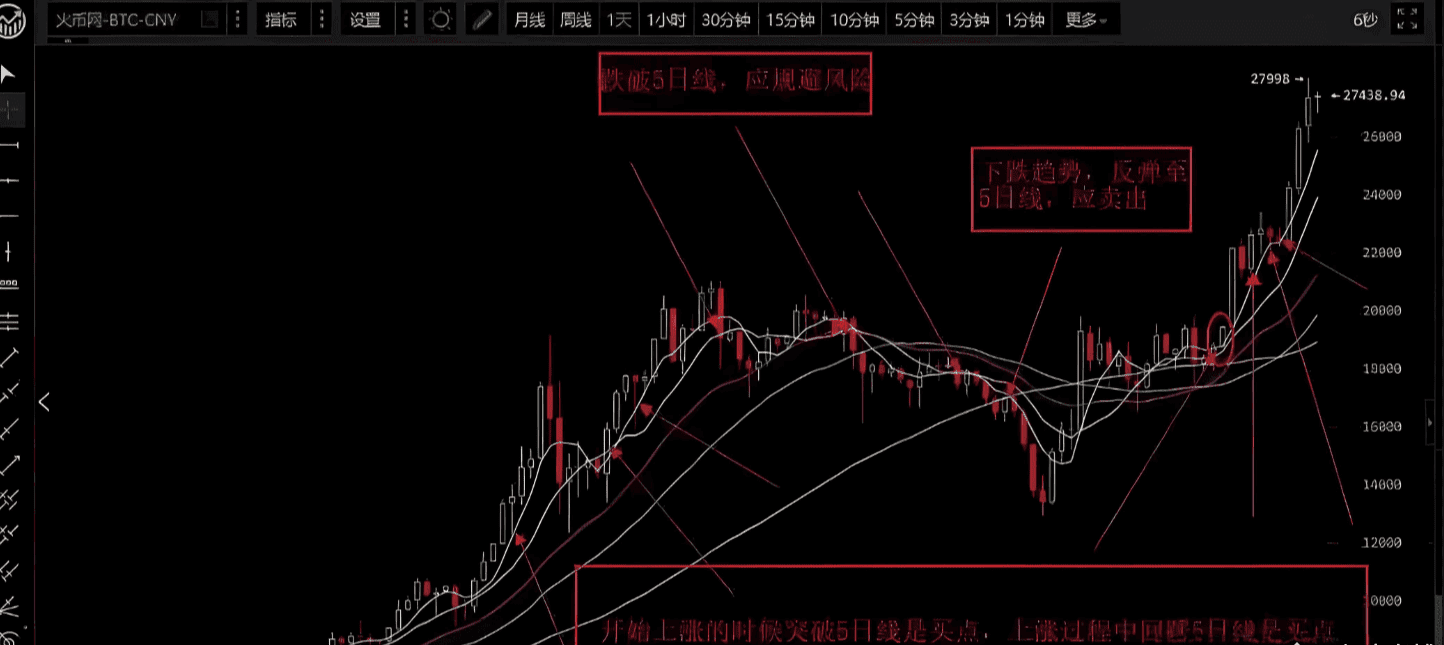
Usage: In a bull market, when the price retraces to the 5-day line, it is the time to increase positions (if it quickly breaks through, you should observe); in a bear market, when the price drops below the 5-day line, you need to sell quickly. As long as it does not break the 5-day line, there should not be any major issues.
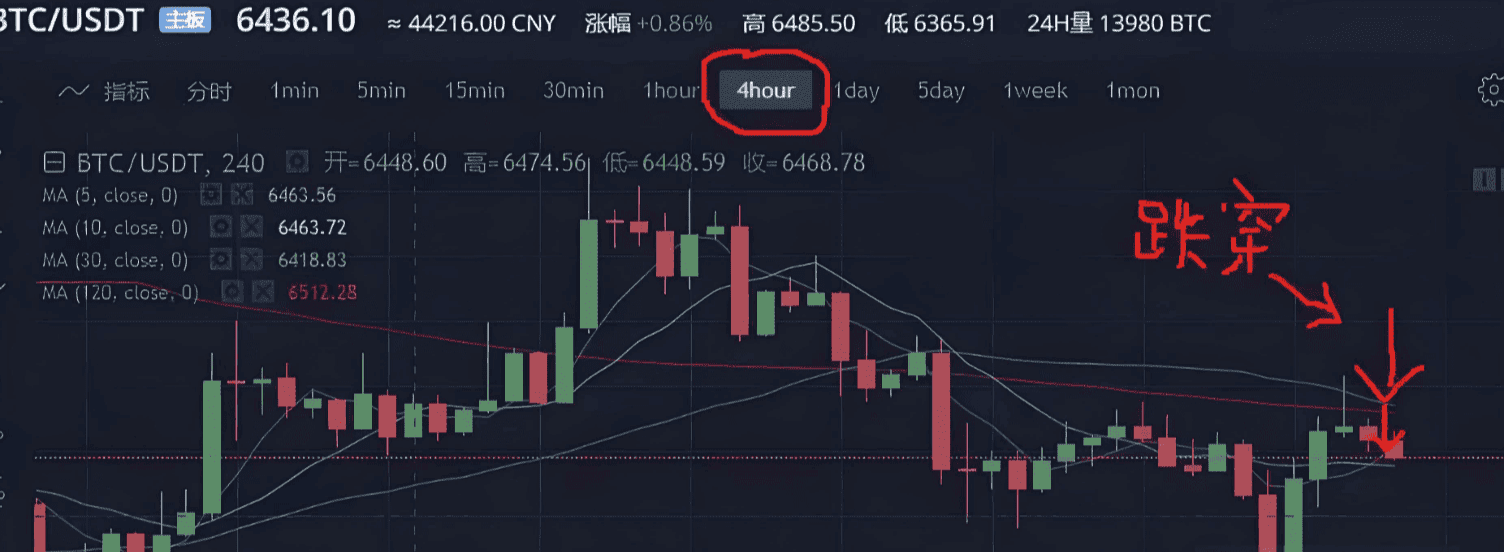
During consolidation periods, you can look at the 1-hour and 4-hour lines, which are the short-term usage.
This theory requires more exploration from everyone, as very few people will tell you that you will encounter many problems in practice. You need to verify it more. Undoubtedly, the 5-day moving average strategy is very useful in practice and is one of the indicators that short-term experts must rely on.
Why use the 5-day line? Because there is a saying, a day in the cryptocurrency circle is like a year in the human world; the market reacts particularly quickly. Using the conventional 7-day line would be relatively slow and unable to keep up with market changes. We all know that there are no limits to the fluctuations in cryptocurrency prices, and trading occurs twenty-four hours a day.
If the 5-day line is used as the judgment standard, then when the price reaches the 5-day line, it will form a support level. If it drops below the 5-day line, you have to wait until it returns to the cost price, and this point will also form a support level.
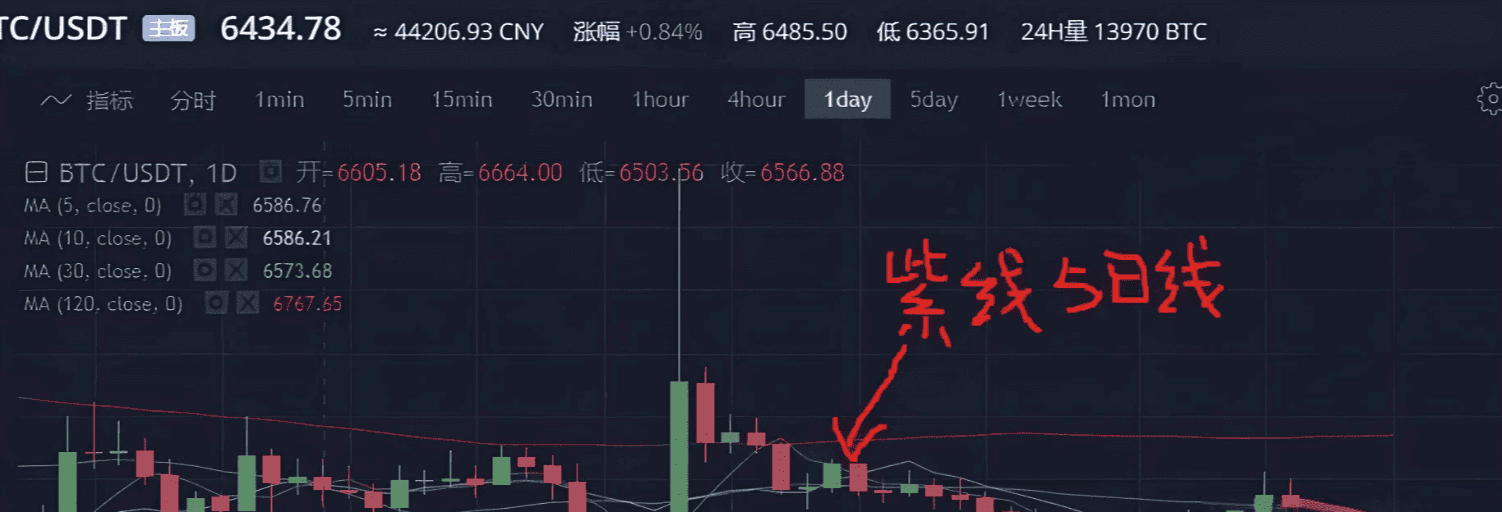
It shows that the current price still hasn't crossed the 5-day line, and there is still much uncertainty. At this time, we use the hourly and four-hour lines.
Practical summary: This strategy mainly focuses on short-term indicators. When approaching the moving average, which is the cost price for everyone, selling pressure decreases, and the price tends to rise again. If it deviates too much from the moving average, the probability of adjustment increases, mainly because investors will choose to arbitrage, leading to a price decline.
3. 30-day line and 10-day line combined with short-term strategies:
The 30-day line is also a short to medium-term strategy. If you are not very fond of trading, we recommend this strategy to you.
As usual, if previously set to: 5-day line, 30-day line, 60-day line, 120-day line, change the 60-day line to a 10-day line.
This set of indicators only requires the use of the 10-day line and 30-day line.
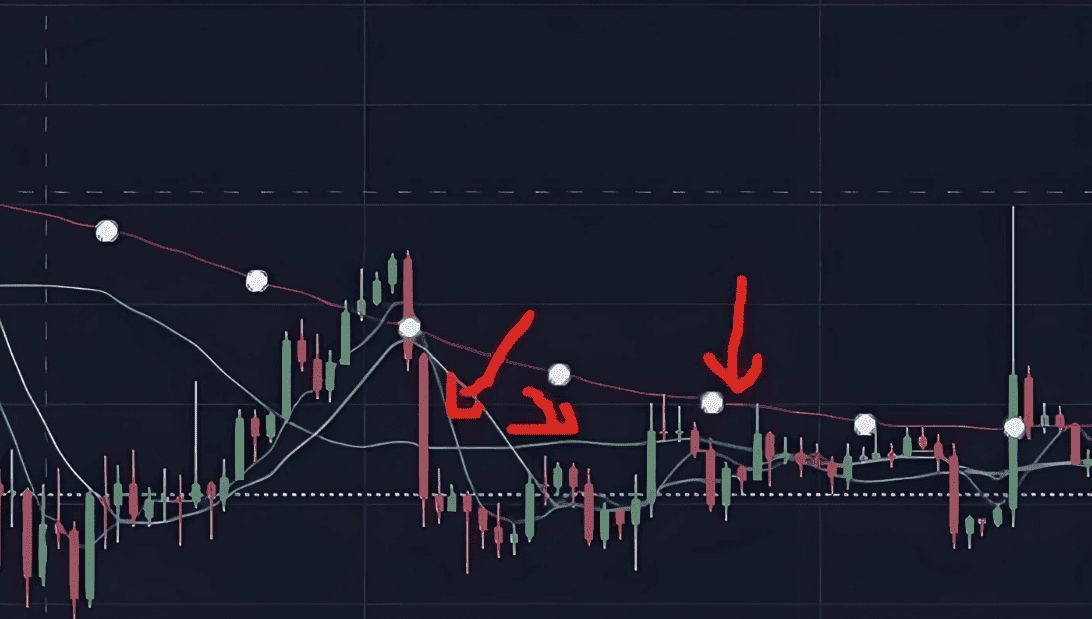
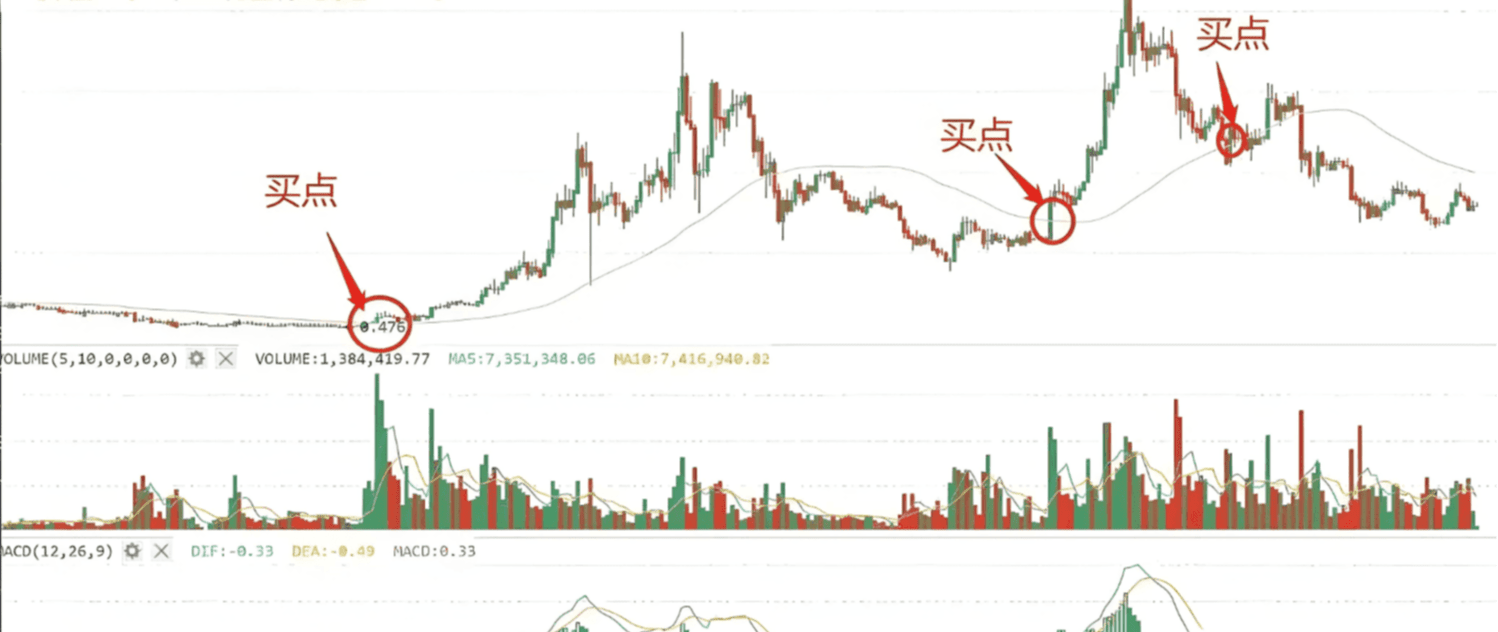
This set of indicators is relatively simple to use: sell when it drops below the 10-day line, and buy when it breaks above the 30-day line. Change the time to one hour, as shown in the diagram.
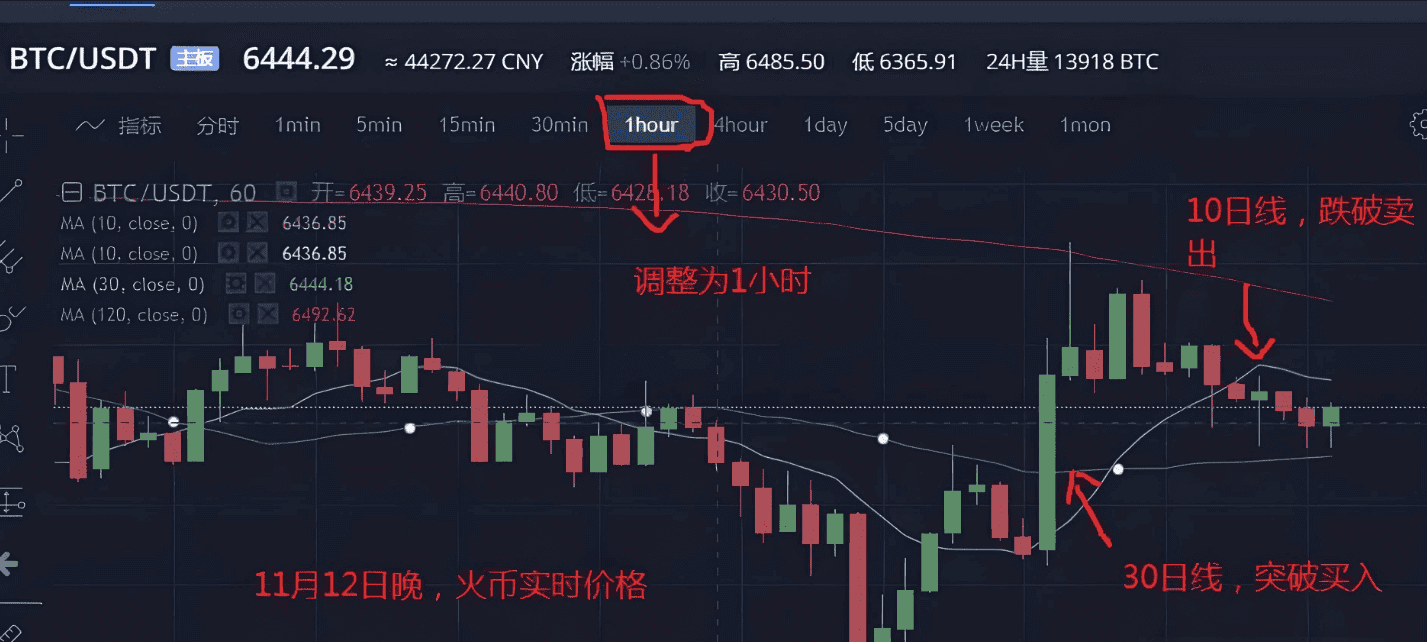
This theory is similar to the 5-day line; the 30-day line indicates short to medium-term trends. When set to one hour, it becomes a short-term buying point. When it falls below the 10-day line, a short-term downward channel opens. Through this combination and application in real practice, it is very effective.
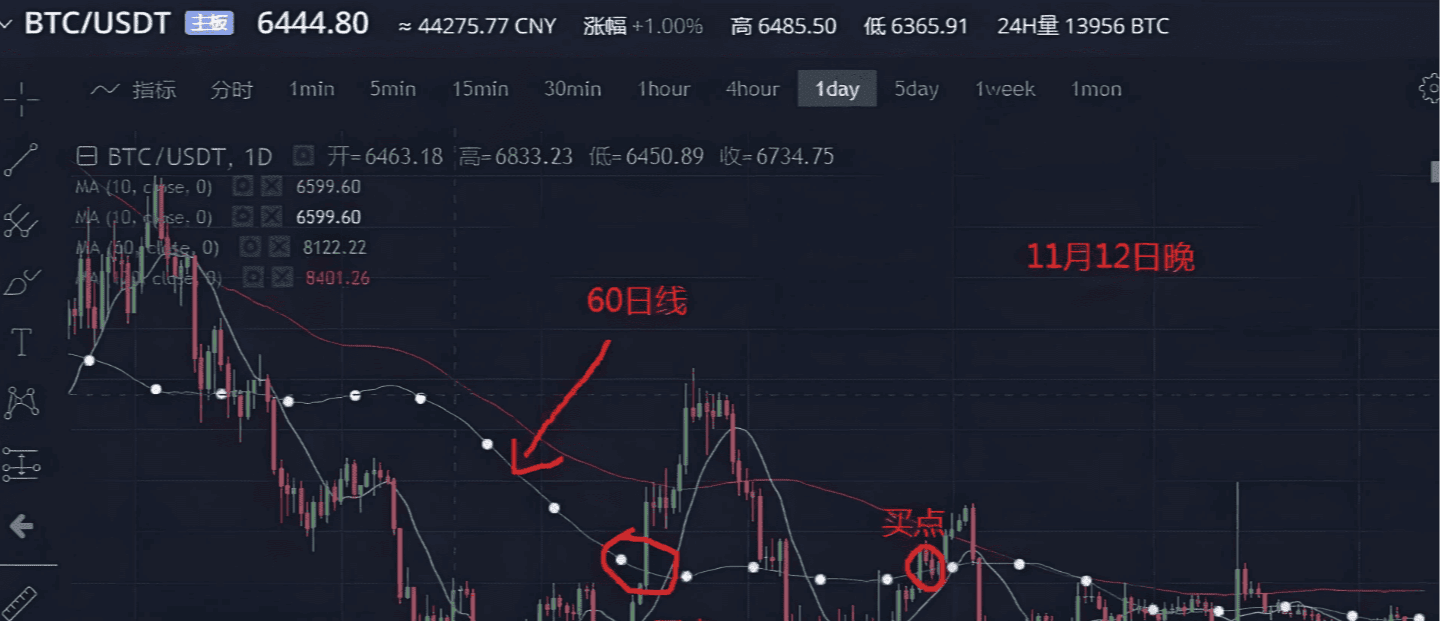
4. Medium to long-term strategy: 60-day line and 120-day line.
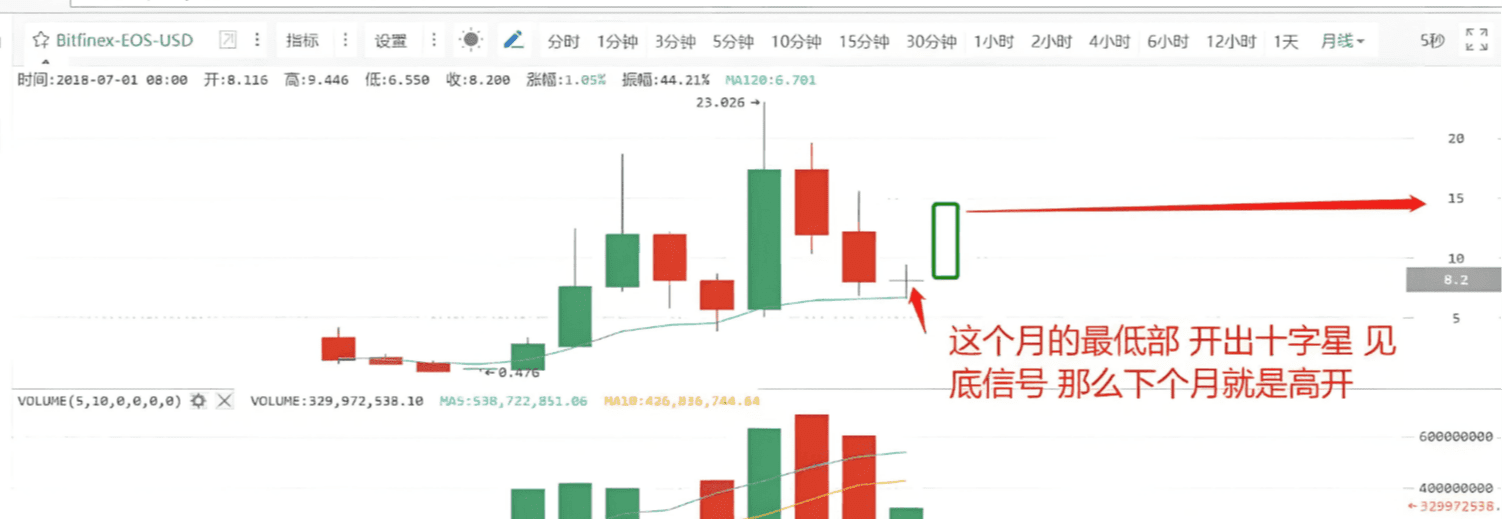
This chart is the trend chart of EOS. It is said that some investors trade several bottoms a year using the 60-day line for stable investment. This method is suitable for those who do not have time to trade.
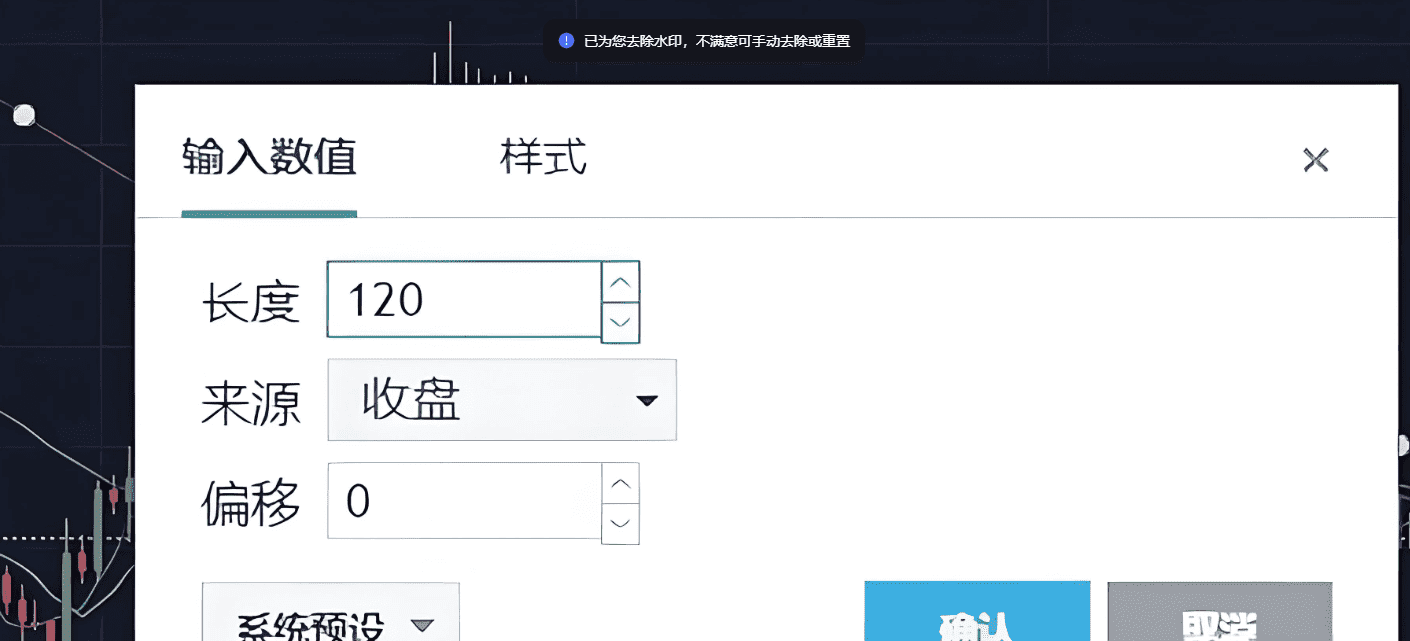
Speaking of the 120-day line, it is the dividing line between bull and bear markets.
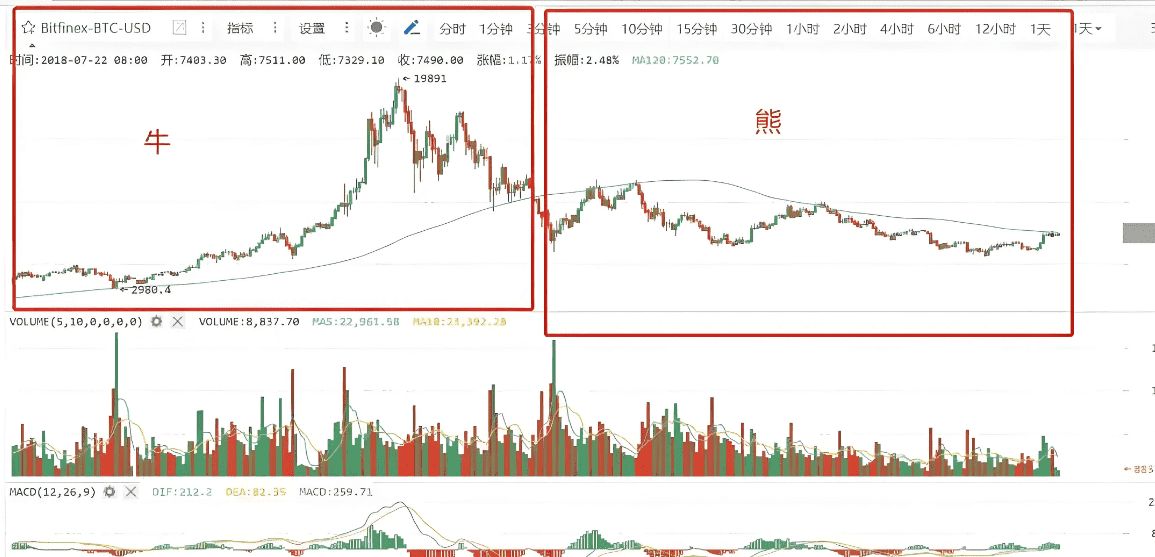
So how do you use the 120-day line for investment?
This is the previous technical chart, and according to the current market situation, it has not crossed the 120-day line. The usage of the 120-day line is actually a technical indicator to judge long-term trends and is also a reference basis in daily trading. This bear market has not yet ended, and once it crosses the 120-day line, it will be an indicator of the arrival of the bull market.
We often see that what various experts refer to as pressure and support levels is actually the average line.
When analyzing major trends, long-term investors should not rely on the 5-day line strategy. The main reference moving average for bull and bear transitions is the 120-day moving average.
5. Box waves to look at pressure and support.
This is from the Elliott Wave Theory, which provides a good explanation for wave trading. Many novices in the stock market have swept through the market for years relying on this theory. Of course, whether it is practical or not is unknown; after all, seeing is believing. Here, we will briefly introduce the support and resistance levels of box waves.
When the cryptocurrency price operates within a certain box, the waves formed have their highest points on a line, which is the resistance level. The bottoms of the waves connected together form the support level.
Generally, the judgment is that a breakout may lead to a higher charge. In such cases, how should you choose?
A main point comes from the fundamentals, which is that when good news is released or large funds enter the market, there can be a surge in the market. Another situation is a breakout followed by consolidation, which is also quite common, indicating that funds are unable to push higher or there is too much selling pressure. At this time, caution is necessary. Of course, such spans can be quite large and can only serve as a reference.
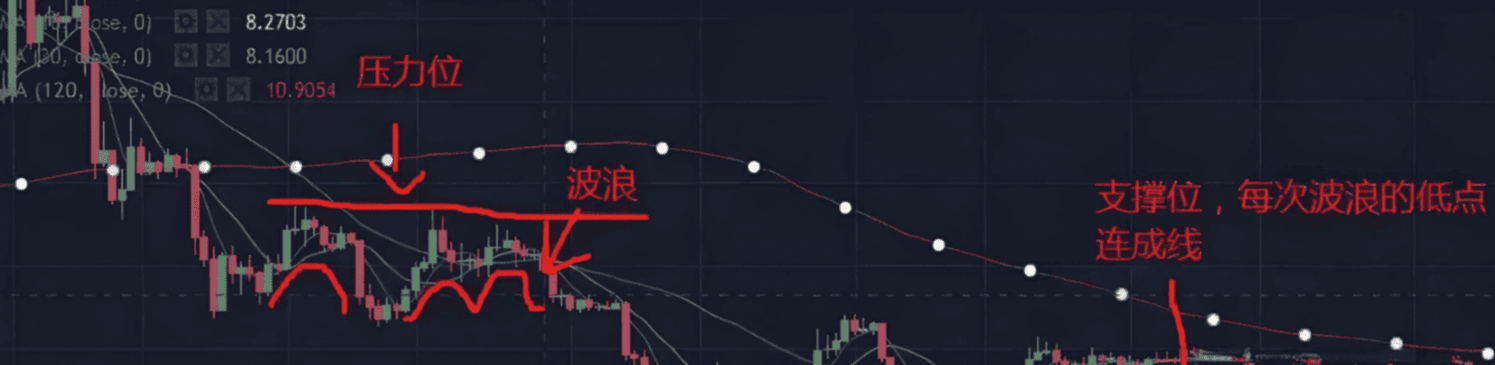
Using box waves, you can see each low and high point to judge support and resistance, which is a relatively common analysis method. It is simple but not very accurate. You can explore it in daily practice or look at technical books on wave theory. To be honest, I have read several good books on waves, but in real practice, their effectiveness is not very good. However, that does not mean everyone will have the same results after reading; everything still relies on practical exploration. I prefer practical techniques over conceptual stuff; what do you think?
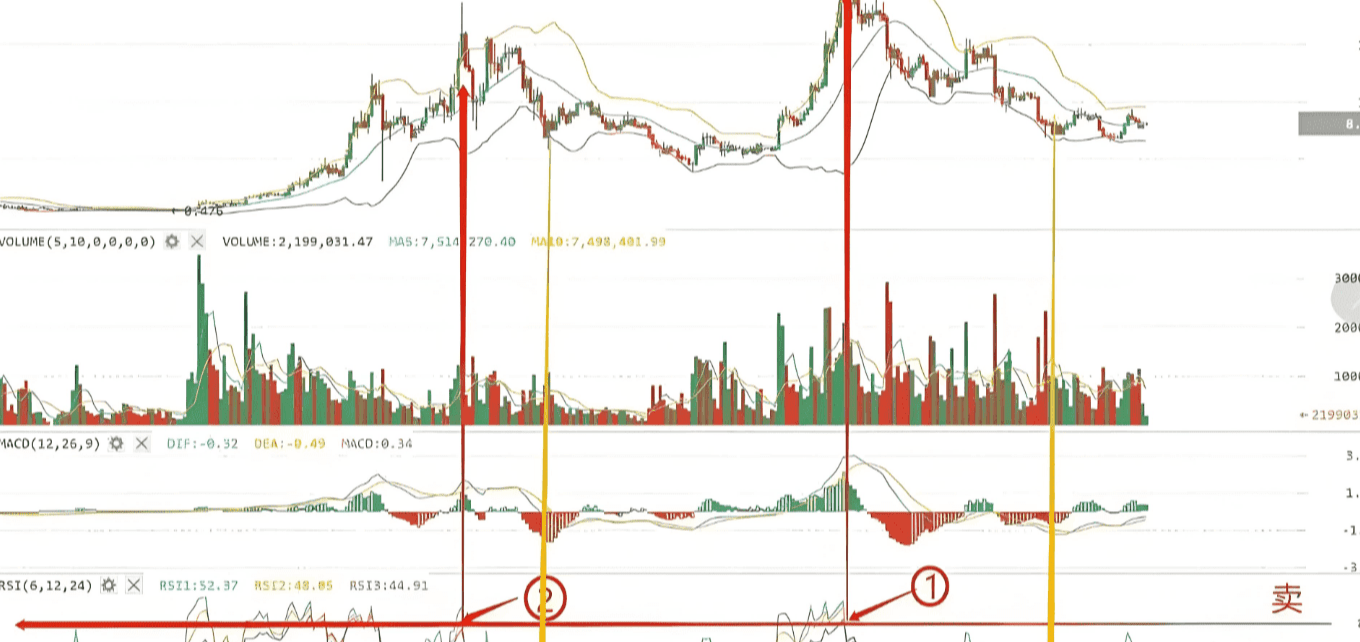
6. RSI Bottom Fishing and Top Escaping Rules.
RSI is also an old technical indicator in the stock market and works particularly well as a reference in the cryptocurrency circle.
The RSI indicator represents a degree of strength, calculated based on the statistics of cryptocurrency price increases and decreases.
The principle of the RSI indicator, in simple terms, is to calculate the power comparison between buyers and sellers using numbers. For example, if there are a hundred people buying a cryptocurrency, sixty people buy, and forty people sell, the price will rise.
So how is it used? 80 to 100 indicates strong sell; 20 to 50 indicates strong buy; weak observation 0 to 20 indicates extremely weak buy.
Once a golden cross is reached, it becomes a buy-sell point.
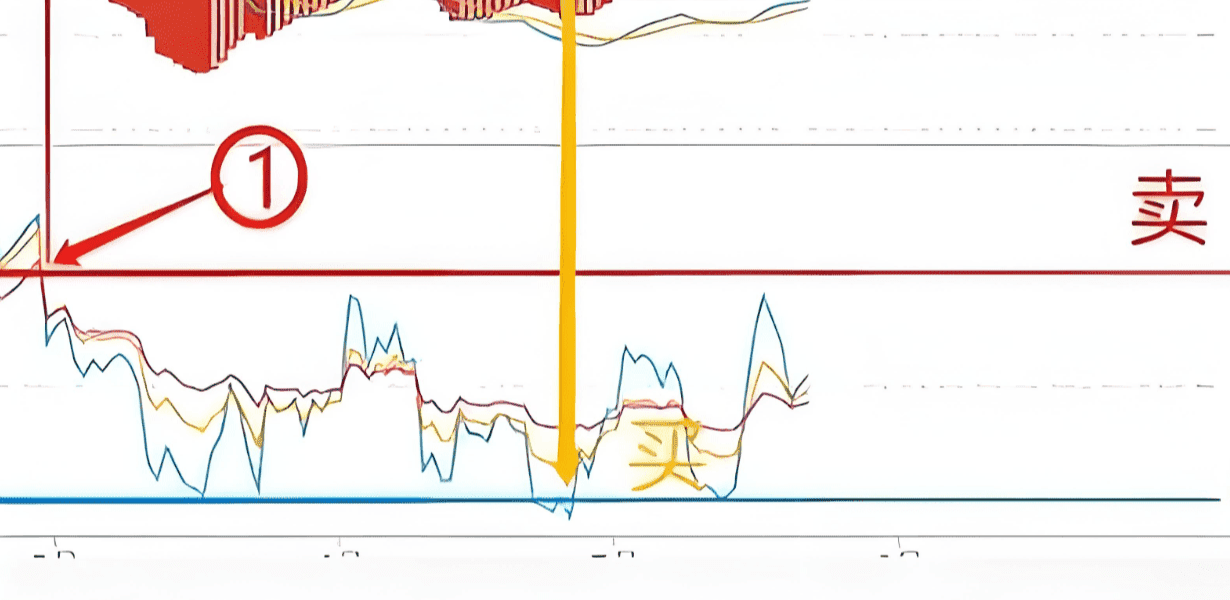
Note that if it reaches 80, there is a high risk of a pullback. When should one sell? Sell at the moment it drops below 80. The RSI technique has been validated by the market; it has been in use since its research in 1978, demonstrating its reference value. In the emerging cryptocurrency circle, this set of indicators can effectively lead you to victory.
Short-term wave trading can choose to operate on the hourly chart to achieve wave top escaping.
Summary: Let's review the five technical indicators we discussed today: the 5-day line strategy, the combination of 10-day line and 30-day line indicators, the role of medium to long-term strategies using the 60-day line and 120-day line, box wave support and resistance levels, and the RSI bottom fishing and top escaping rules.
The above reference indicators, while simple, are actually easier to use when they are simpler. In practice, we have introduced five technical cryptocurrency trading methods. Through practical investment, I believe there is always one that can bring you a different investment experience; there is always one that can become a tool on your investment journey.
You don’t need to stay up late staring at the market guessing trends; you don’t need to struggle with whether your buy-sell points are precise. Only take opportunities where the trend is clear; hold your hands in a bear market, and keep your positions in a bull market. Remember, the cryptocurrency market is not short of opportunities; what is lacking is the execution to keep up.
Only real trading for now, the team has a spot available.
BTC ETH USDT
