Typically, a qualified trader must possess both fundamental and technical analysis skills. However, fundamental analysis only addresses what to buy, such as BTC, ETH, or XRP, which is a selection of the underlying asset. As for when to buy and when to sell, this exceeds the scope of fundamental analysis and requires technical analysis to resolve.
Thus, the core of cryptocurrency technical analysis is to learn how to read charts. How to read charts? What technical analysis indicators are there? How should one analyze them? We will answer these questions one by one.
What is cryptocurrency technical analysis?
A method of analysis that predicts future price changes by analyzing the historical price trends of the underlying asset. Currently, technical analysis methods have been applied to various financial markets, including stocks, forex, commodities, etc.
Since technical analysis only studies prices, it is not significantly related to asset types, which allows this analysis method to apply to all trading markets. Because of this, after the cryptocurrency trading market was formed, this analysis method was introduced without obstacles, creating cryptocurrency technical analysis. This also means that if you understand technical analysis and charting methods in traditional markets like stocks and forex, you essentially grasp cryptocurrency technical analysis and charting, as there is no obvious difference between them.
The core of cryptocurrency technical analysis: candlestick chart
Candlestick charts, 'K lines', 'Bullish and Bearish lines', are the smallest units of technical analysis, and various theories and technical indicators are based on this premise. In other words, to learn cryptocurrency technical analysis, one must first master candlestick charts.
A single candlestick contains four prices, each representing different meanings:
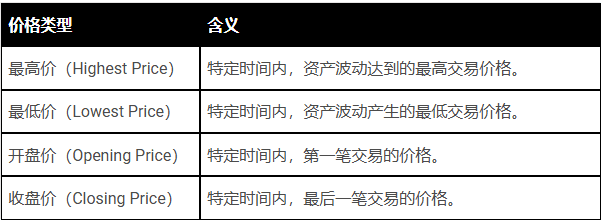
Based on the opening and closing price levels, candlesticks can be divided into bullish and bearish. If the opening price is lower than the closing price, showing that the price rises after opening, then this candlestick is a bullish line, usually represented in red (left figure). Conversely, if after the first transaction the price continues to decline, and the closing price remains below the opening price, then this candlestick is a bearish line, usually represented in green (right figure).
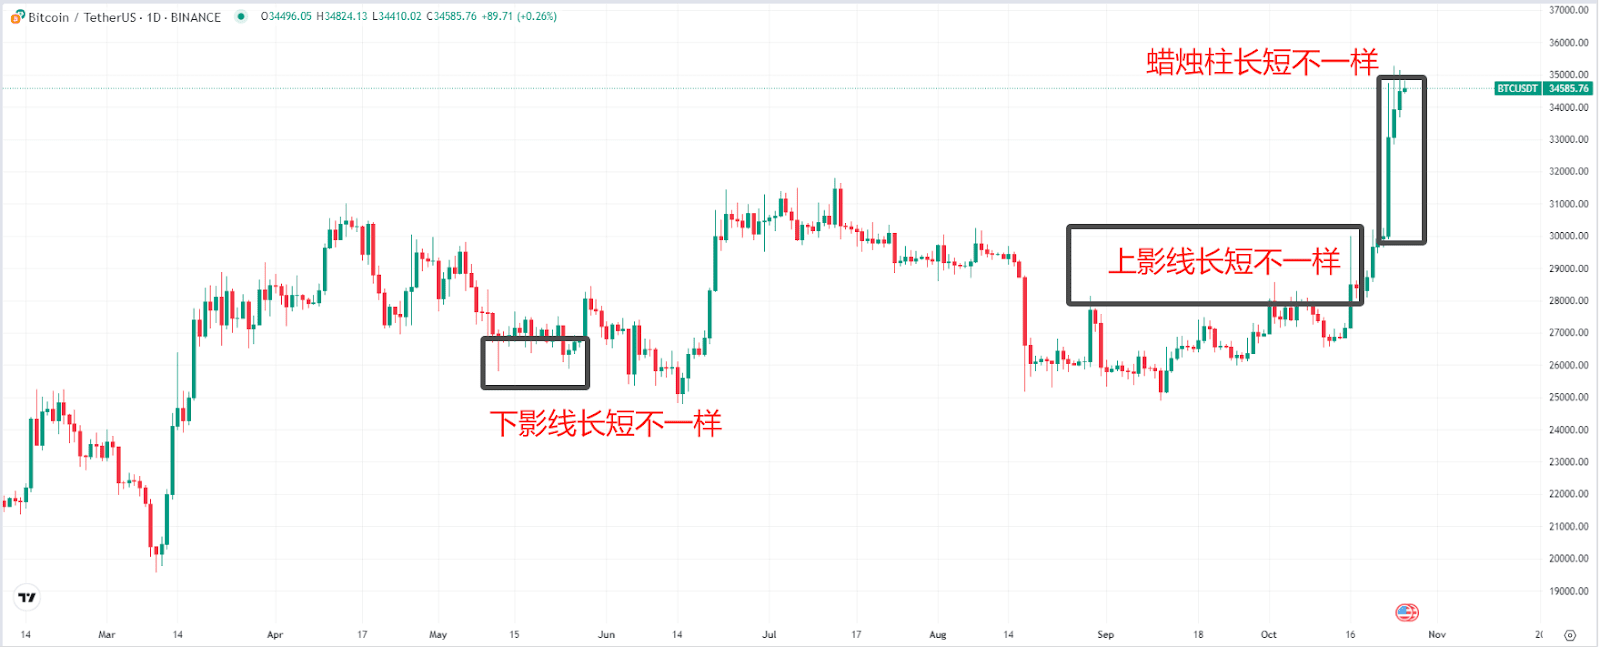
The above figure shows a relatively standardized candlestick, where the prices do not overlap, thus ensuring a complete chart, including the upper shadow (above the candlestick), lower shadow (below the candlestick), and body (the range between the opening and closing prices). However, in reality, there are many non-standard candlesticks, where their shadows and bodies can vary in length or even be absent, leading to different lengths of candlesticks.
How to view cryptocurrency trends?
1. Confirm time frame: Choose an appropriate candlestick chart time frame (such as 1 minute, 5 minutes, 1 hour, daily, etc.), depending on your trading style.
2. Analyze candlestick patterns: Analyzing individual candlestick shapes, such as doji and engulfing patterns, should also be combined with multiple candlestick analyses, such as head and shoulders, double bottoms, flags, etc.
3. Trend Analysis: Observe the arrangement and shape of candlesticks to determine if the market trend is upward, downward, or sideways.
4. Determine support and resistance: Identify potential support and resistance levels through historical price highs and lows, along with technical indicators like RSI.
5. Observe volume: Analyze the effectiveness of candlesticks in conjunction with trading volume; an increase or decrease in volume can enhance or weaken the credibility of candlestick signals.
6. Combine with other technical indicators: Confirm buy and sell signals in conjunction with common indicators such as MACD, RSI, MA, Bollinger Bands, etc.
Which trading data should be focused on?
In addition to the above indicators, traders should also pay attention to certain data, such as trading volume, capital flow, Fear/Greed Index, etc., as they can also reflect market strength.
Trading Volume (Volume)
High trading volume accompanied by price increase indicates a strong market, meaning most traders hold a bullish attitude. High trading volume accompanied by price decrease indicates a weak market, meaning most traders hold a bearish attitude.

Capital Flow
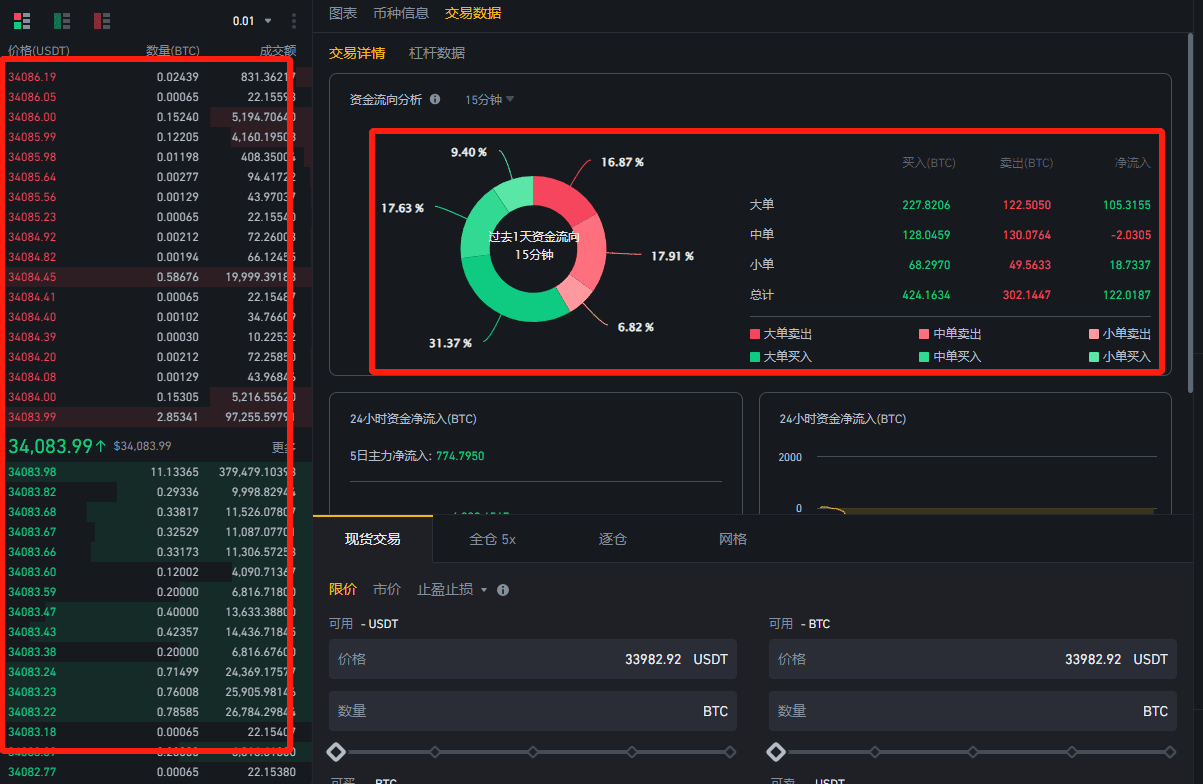
The left side of the diagram below shows the trading order book, displaying the recent BTC buy and sell orders. If there is a massive buying order at the bottom, it indicates strong buying pressure, and you can follow to go long. Similarly, if there is a massive selling order at the top, be cautious of selling.
The figure on the right presents the strength of buyers and sellers in percentage form; if the data changes little, it is not very meaningful. If there are significant capital movements, it is worth tracking.
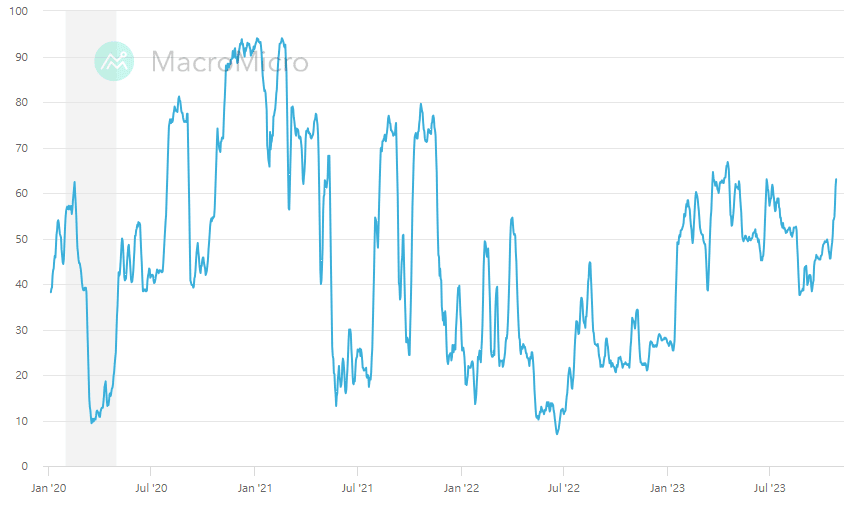
Fear/Greed Index
The Fear/Greed Index describes market (user) sentiment, with a range of 0-100, where 0 indicates extreme fear, 100 indicates extreme greed, and 50 indicates neutrality; while 0-50 indicates fear, and 50-100 indicates greed.
In addition to the above data, if interested, you can also understand liquidation volume, open contracts, long-short ratio, funding rates, TVL, on-chain transfers, whale holdings, number of wallet addresses, etc.
What are the commonly used technical indicators?
Multiple candlesticks connected together form the price trend line, reflecting the price changes of an asset over a certain period, while technical indicators study the patterns of price movements and infer possible future price changes.
Currently, according to TradingView, there are over 100 technical indicators. However, regardless of which indicator, the ultimate goal is to study the bulls (buyers) and bears (sellers) to see who is stronger. Therefore, the next section introduces five relatively popular and easy-to-master indicators and their variations.
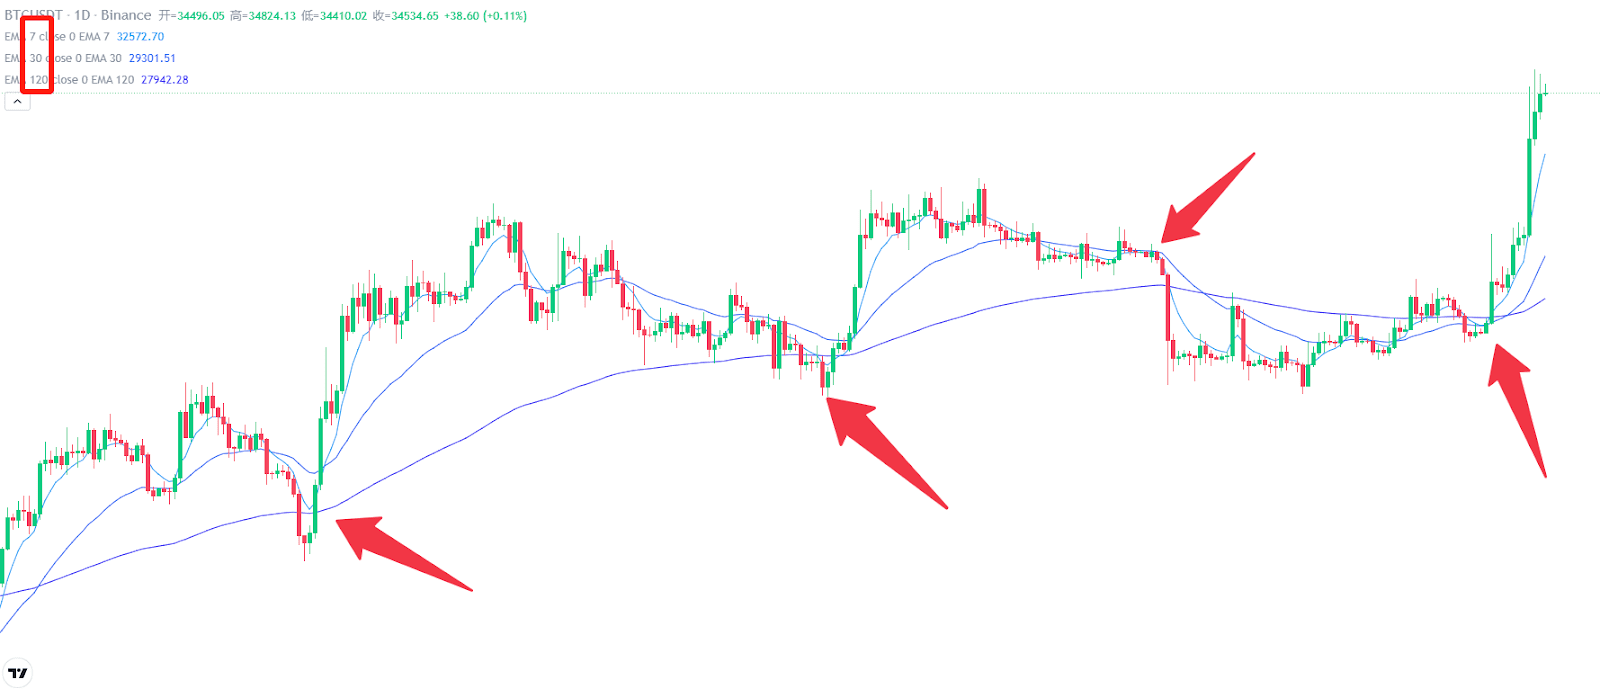
1. Moving Average (MA)
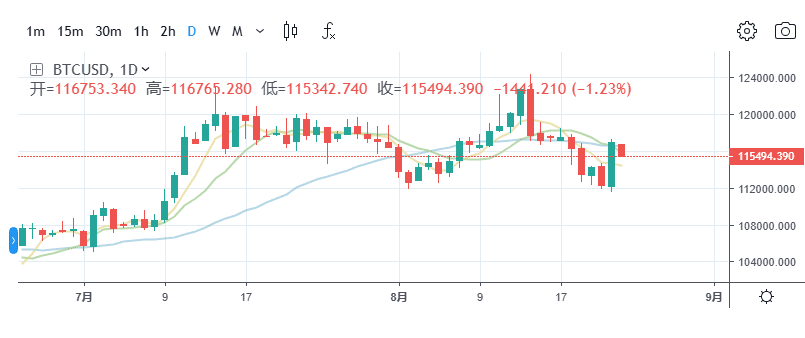
Moving averages are curves generated by calculating the average price over a certain period, usually used to identify trend reversal points, support levels, and resistance levels. When the price line (candlestick line) is above the MA and closely adheres to the MA, the MA acts as a support, signaling a buying opportunity. When the price line is below the MA, the MA acts as resistance, forming a selling signal. Note: If the price line deviates too far from the MA, there will be a demand for price regression, meaning it will move closer to the MA.
MA can be divided into Simple Moving Average (SMA) and Exponential Moving Average (EMA), with EMA giving more weight to recent prices compared to SMA, making it more sensitive to new trends. Additionally, you can set the time period for moving averages according to your preference, generally available for 7 days, 30 days, and 120 days. Therefore, if using EMA, the left corner (as shown below) will display: EMA7, EMA30, EMA120.
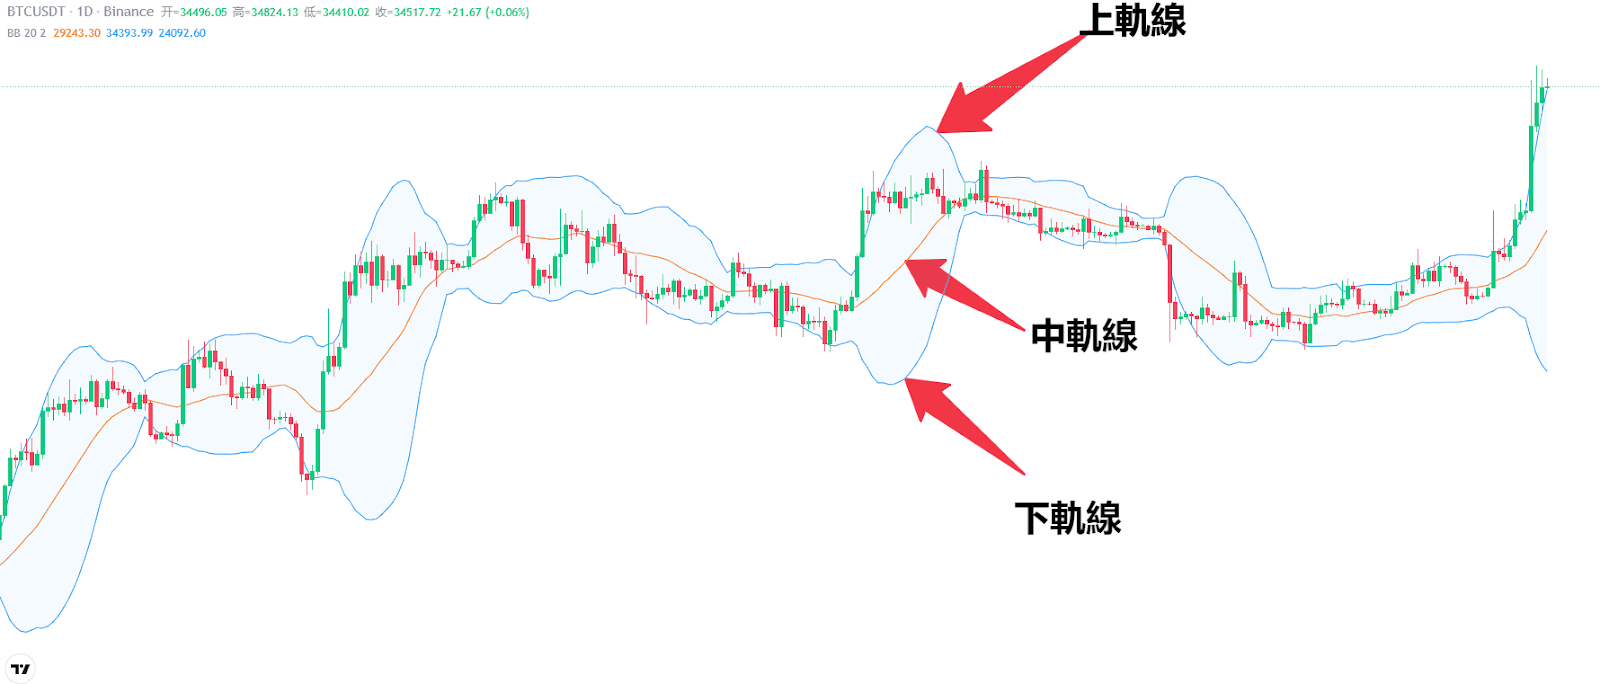
2. Bollinger Bands
Bollinger Bands are a technical indicator developed by American technical analyst John Bollinger, consisting of three lines: the upper band (usually SMA20), middle band, and lower band, used to measure overbought or oversold conditions of an asset.
When the price approaches the upper band, it indicates that the market is in an overbought state, and thus may decline, forming a sell signal; when the price approaches the lower band, it indicates that it is oversold and may subsequently rise, forming a buy signal. If it is at the middle band, it is neither overbought nor oversold, continuing the previous trend (if it was previously rising, it continues to rise; if it was falling, it continues to fall).
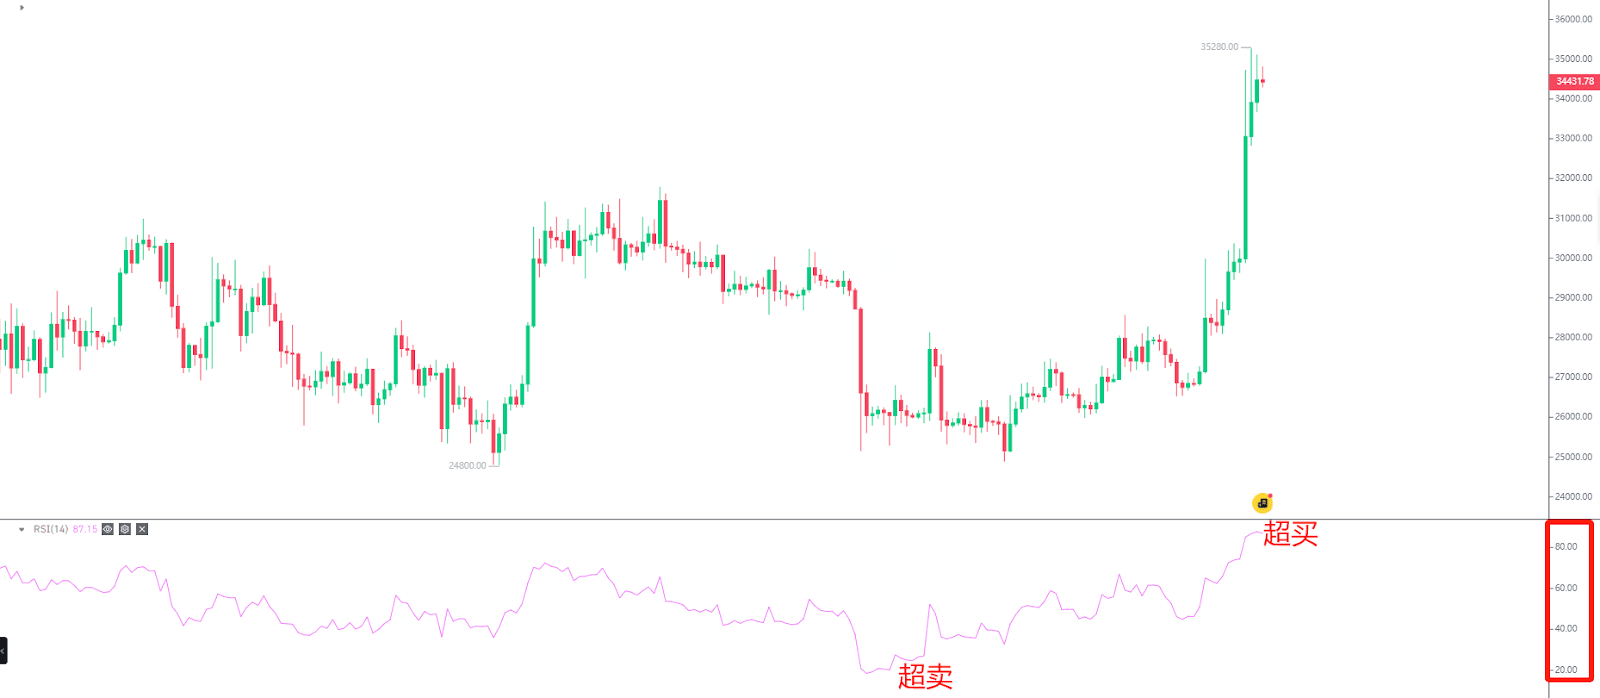
3. Relative Strength Index (RSI)
RSI also has the function of indicating whether an asset is overbought or oversold, and it can also measure the speed and strength of price changes. The calculation of RSI is based on the average price changes over a certain period, converting it to a value between 0-100, with the time period usually set to 14 days, but it can be modified based on needs.
An RSI value above 70 is considered an overbought area, indicating that the market is overbought and there is a risk of a sell-off; an RSI value below 30 is considered an oversold area, indicating that the market is oversold and there is a buy signal for a potential price increase. Additionally, if RSI diverges from the price line (i.e., the directions of fluctuation change oppositely), the price trend may reverse. This means that an original upward trend may turn downward, and an original downward trend may turn upward.
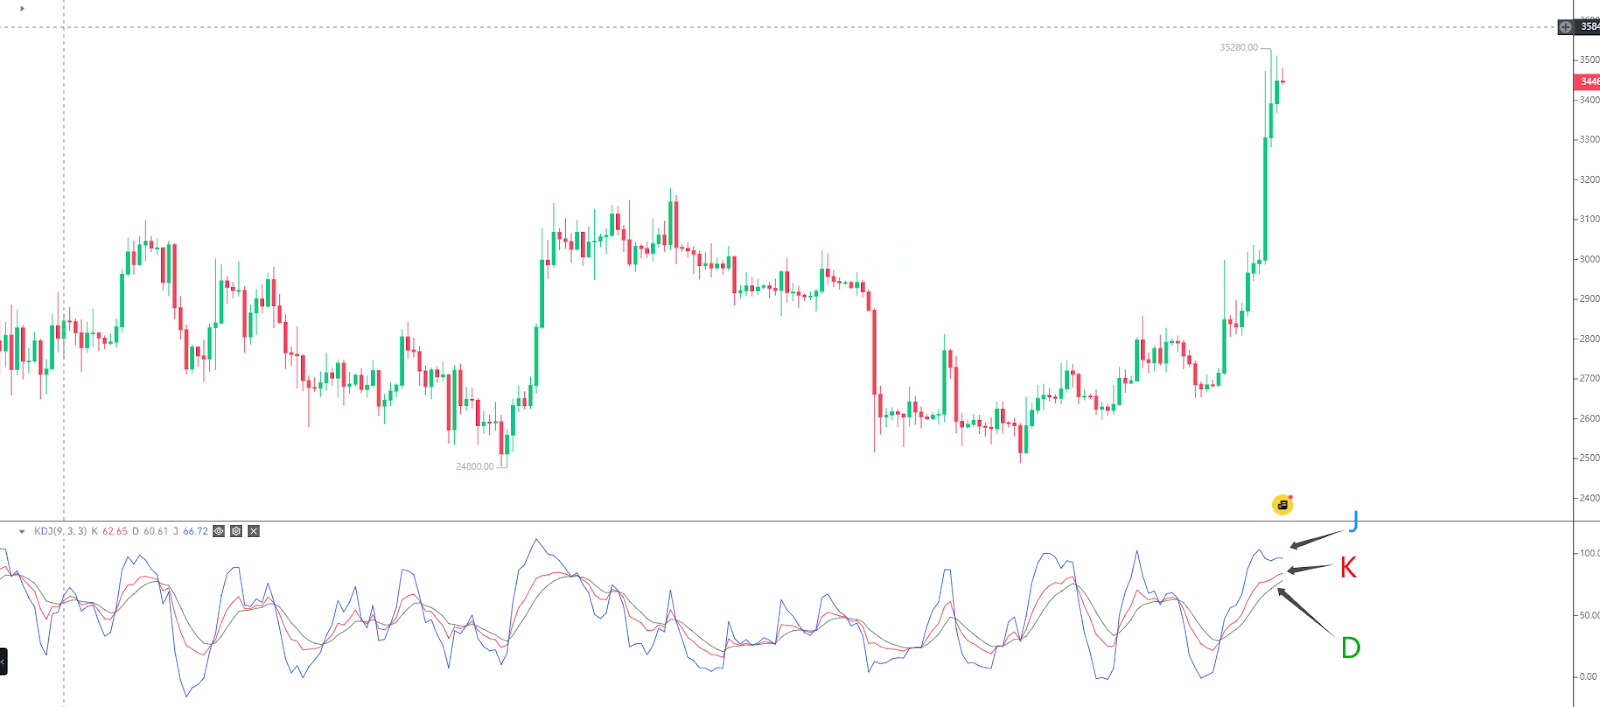
4. KDJ
Similar to Bollinger Bands and RSI, KDJ is also a technical indicator that measures overbought and oversold conditions, and it also includes three lines: K, D, and J (as shown below), with their values ranging from 0-100.
When the K-line exceeds 80 and crosses down through the D line, it indicates that the asset is in an overbought state, forming a downward signal; if the K-line falls below 20 and crosses up through the D line, it indicates that the asset is in an oversold state, forming an upward signal. The J line is the difference between K and D lines, mainly serving a confirmation role.
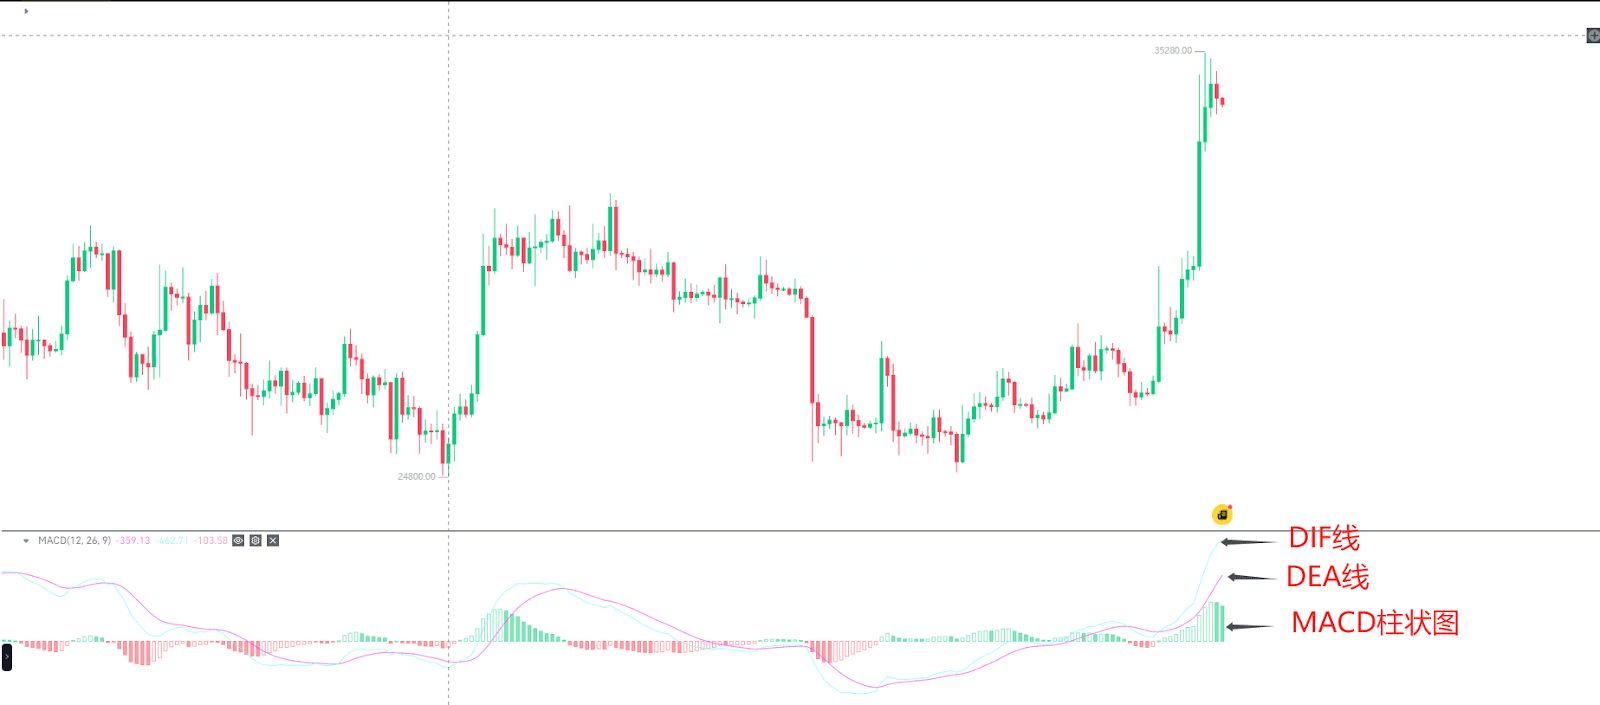
5. Moving Average Convergence Divergence (MACD)
MACD is mainly used to determine turning points in asset price trends and to generate trading signals, mainly consisting of three parts: DEA, DIF, and the MACD histogram, all derived from fast and slow lines.
Golden Cross and Death Cross: When the DIF breaks upward through the DEA, it indicates an upward trend, generating a buy signal (Golden Cross); when the DIF breaks downward through the DEA, it indicates a downward trend, generating a sell signal (Death Cross).
MACD Histogram: When the MACD histogram is positive, it indicates that the fast line is above the slow line, suggesting an upward trend; when the MACD histogram is negative, it indicates that the fast line is below the slow line, suggesting a downward trend. If MACD diverges from the price line, it indicates a potential trend reversal.
In addition to the indicators mentioned above, there are many others, such as WMA, VWAP, OBI, CCI, WR, etc. However, regardless of which indicator, they all attempt to measure the strength of bulls and bears. If the bulls are strong, it indicates an upward trend; if the bears are stronger, it indicates a downward trend.
How to find investment opportunities through technical analysis?
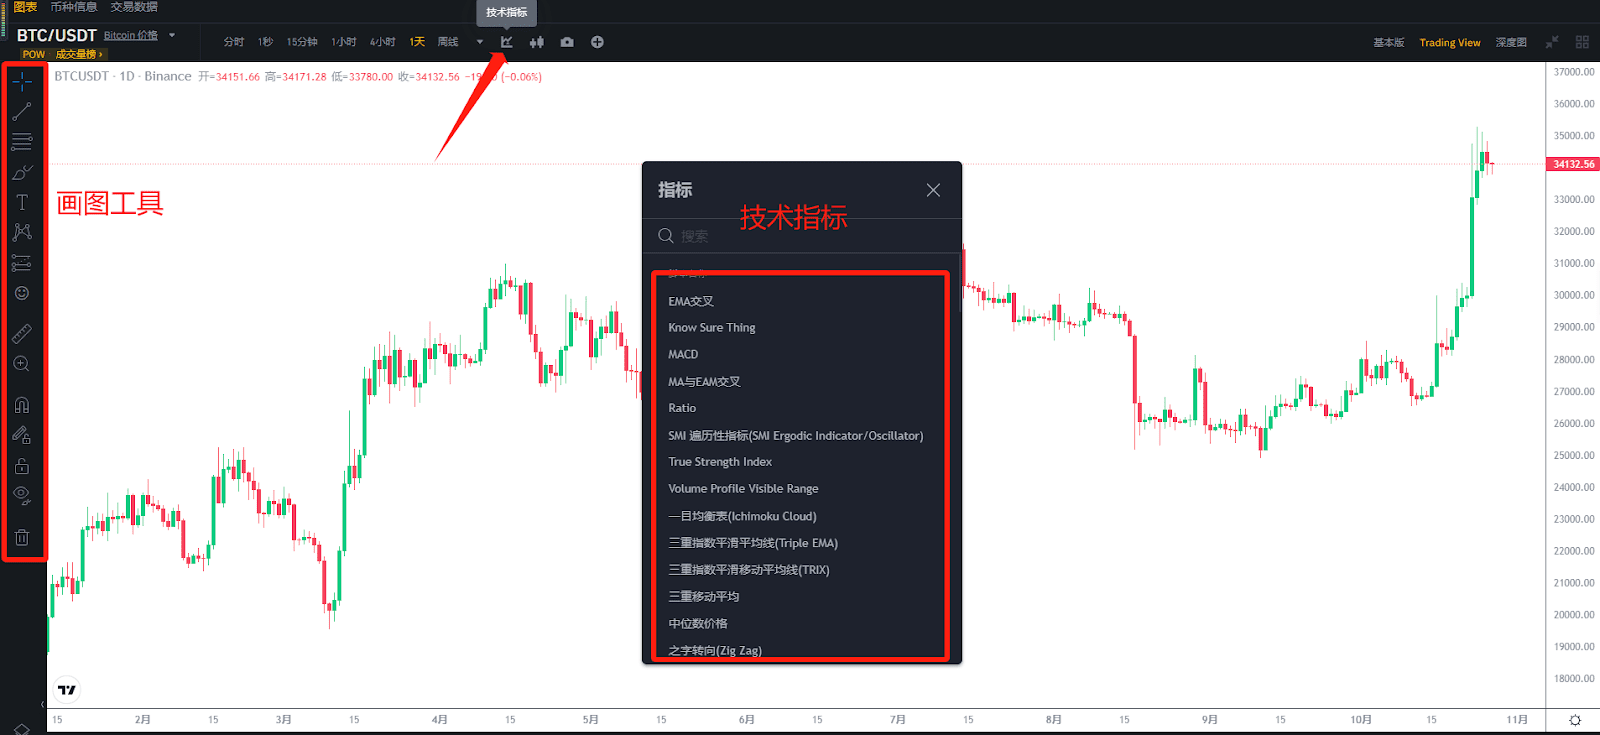
To conduct technical analysis of cryptocurrencies, the first step is to find the corresponding tools, mainly including two categories: market trend charts and data queries.
First is the market trend chart and drawing tools, with TradingView being quite popular, providing various cryptocurrency market trend charts and operational tools. The left side is the drawing toolbar, where you can choose according to your needs; the direction indicated by the arrow is the entrance to technical indicators, clicking it will pop up various indicators, and you can enter a name in the search box, which will then be displayed on the interface.
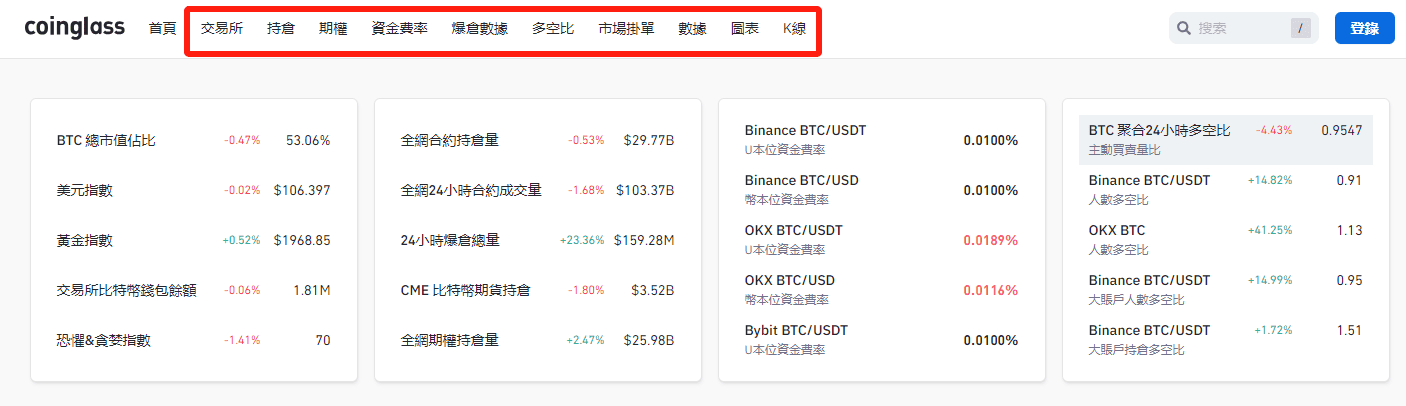
Secondly, data query tools can be used, such as CoinGlass, which provides various data indicators. By clicking on the toolbar above, various data will automatically pop up.
After mastering these basic indicators and drawing tools, it is necessary to study data patterns and draw charts to determine buying and selling points, and then conduct actual operations to verify. It is important to note that this is a repetitive, long-term task, and errors may occur along the way, but persistence is essential, as trading itself is a lifelong practice process, pursuing higher probability accuracy rather than absolute correctness.
Cryptocurrency technical analysis, as a method to analyze and predict price change trends, can effectively solve traders' issues regarding buy and sell prices and timing, i.e., when to buy and sell at what price, helping investors lock in profits or stop losses in a timely manner. However, it is important to note that technical analysis can also fail, especially in the face of sudden information shocks, so one should not become overly reliant on technical analysis or use only one technical indicator; multiple indicators or parameters should be used in conjunction for mutual verification.


