Someone asked me: If you could only choose one K-line combination for trading, what would it be?
I would definitely say without hesitation: the engulfing pattern.
Anyone who has seriously studied trading knows that there are too many patterns in trading, such as 'three black crows,' 'three white soldiers,' and various strange combinations. However, in practice, very few of them are reliable. When you go around in circles learning, you'll find that the simplest ones are the most useful.
The engulfing pattern is very easy to recognize and has a high accuracy rate, applicable in any market and any K-line period. It may seem unremarkable, but it is simple and practical, which is enough.
In today's article, I will thoroughly break down the core logic of the engulfing pattern and explain why it has become my only choice. I will share three techniques for using the engulfing pattern, along with practical case studies to teach you how to improve your trading win rate with this method.
1. Characteristics of the engulfing pattern
There are actually two types of engulfing patterns, one is 'downward engulfing' that appears at the top, and the other is 'upward engulfing' that appears at the bottom.
Its structure is particularly simple, consisting of just two K-lines:
Downward engulfing: The subsequent large bearish candle completely 'eats' the previous bullish candle, indicating that the bears have the upper hand, and the market may fall.
Upward engulfing: The subsequent large bullish candle completely engulfs the previous bearish candle, indicating that the bulls are beginning to counterattack, and the market may rise.
The engulfing pattern consists of these two K-lines; a downward engulfing pattern is a downward bearish candle body that engulfs the previous bullish candle body. An upward engulfing pattern is an upward bullish candle body that engulfs the previous bearish candle body.
As long as you can differentiate between bullish and bearish candles, you have already learned the engulfing pattern! There is nothing simpler than this K-line combination.
Everyone, take a look at the picture below.
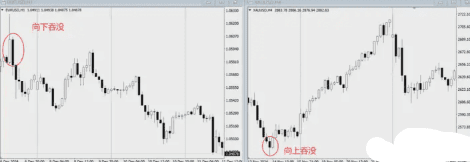
On the left side of the chart is the downward engulfing pattern, where the downward bearish candle body completely engulfs the previous bullish candle body, and the market then begins to oscillate downwards.
On the right side of the chart is an upward engulfing pattern, where the bullish candle not only engulfs the previous bearish candle's body but also exceeds it significantly, leading to a rapid price increase afterward.
This is the engulfing pattern; isn't it super simple?
So why do we choose the engulfing pattern among so many K-line patterns?
Because it is particularly simple and easy to recognize. One bullish candle and one bearish candle; just check if the body covers the previous one, and you can understand it at a glance. All other K-line combinations are more complex and harder to recognize.
The accuracy rate is also high. Statistics online show that the win rate for engulfing patterns appearing at key trend positions can reach 50%-70%.
Moreover, K-lines of different periods can all be used. Daily, hourly, 15-minute, 5-minute charts—regardless of the size of the period, they are all applicable.
Different markets are also applicable. Stocks, forex, futures—all these markets can utilize the engulfing pattern, making its range particularly wide.
Why is it enough to rely solely on the engulfing pattern?
Because its trading logic is sound.
The engulfing pattern is used for market reversals, generally employed after significant increases or decreases in the market, often combined with important support and resistance levels. These two factors inherently have a strong reversal potential, and when combined with a standard engulfing pattern, it results in at least three layers of opportunity.
The technical reasons for trading are reasonable, the logic is smooth, and it feels comfortable to execute, resulting in a naturally high accuracy rate.
Moreover, its stop loss space is almost the smallest.
After the engulfing pattern appears, the entry point can refer to the high and low points of the engulfing pattern, which corresponds to the stop loss space of one K-line. This is one of the smallest stop loss spaces among all stop loss methods, even smaller than the stop loss spaces for small-level entries. Once the market moves out, the ratio of profits to losses is particularly reasonable.
Everyone, take a look at the picture below.
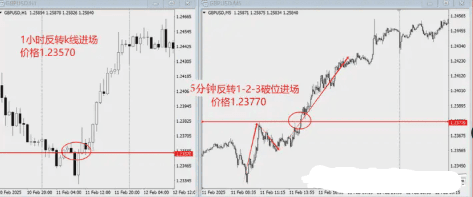
The chart shows the K-line of the British pound, using different entry methods at the same position.
On the left side, the 1-hour reversal K-line enters directly, with the entry price at 1.23570 and the stop loss at the lower level of 1.23315, with a stop loss space of 255 pips.
On the right side, at the same position, an entry was made using a 5-minute breakout at 123, with the entry price at 1.23779, and similarly setting the stop loss at 1.23315, with a stop loss space of 464 pips.
Let's calculate based on closing near the high point of 1.24545 after the market surged.
Entering at the 1-hour reversal K-line, the profit space is 1.24545-1.23570=975, with a stop loss of 255, yielding a risk-reward ratio of 3.8.
The profit space for entering at the 5-minute level is 1.24545-1.23779=766, with a stop loss space of 464, yielding a risk-reward ratio of 1.6.
The gap is still quite large; using the engulfing pattern to set stop losses has significant advantages.
Learning to use the engulfing pattern effectively can help find signals in different markets; it can be used for long, short, and medium-term trades. More importantly, it has an accuracy rate and a reasonable risk-reward ratio, almost meeting all traders' requirements for K-line combinations.
2. The three major techniques for using the engulfing pattern
(1) Use large engulfing patterns instead of small ones.
Market reversals are the result of competition between bulls and bears. With competition, the likelihood of a reversal is higher. During the competitive process, the reversal K-line is usually a relatively large bullish or bearish candle or has a long wick.
Therefore, in practice, when using the engulfing pattern, always choose those formed by K-lines with large spaces, as they are more effective.
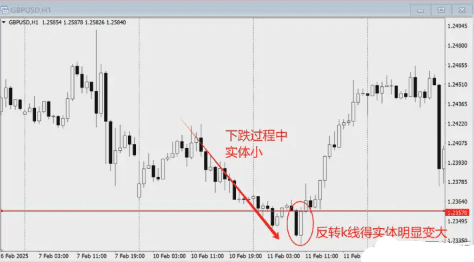
Everyone, take a look at the picture below.
The chart illustrates the reversal of the British pound at the 1-hour level, with a bearish candle touching the bottom and a bullish candle engulfing it. The body of the bullish candle is noticeably larger than the K-line bodies during the previous downtrend, which is a clear signal that the market may reverse after a struggle; this must be noted in practice.
Using large K-lines can filter out many false signals of engulfing patterns.
(2) Only use it at key support and resistance levels.
As a single technical standard, the engulfing pattern in practice must be combined with other indicators, most commonly considering trading when the engulfing pattern appears at key support and resistance levels.
If the market is a one-sided rise or fall with very few pullbacks before reaching support and resistance levels, the possibility of a reversal with an engulfing pattern is higher.
Never trade casually just by seeing a reversal pattern.
(3) The use of the pattern should be flexible.
Be flexible when using the engulfing pattern. At very important support and resistance levels, the engulfing pattern can be less standard; even if it doesn’t fully engulf, it can still be traded, as the support and resistance levels add value to this non-standard engulfing pattern.
For example, if a trade requires 100 points, the support and resistance level accounts for 50 points, and the engulfing pattern accounts for 50 points. If the support level is particularly important and can give 70 points, then even if the engulfing pattern is not up to standard, it can still be traded with 30 points.
However, if the support and resistance levels are not that important, you must choose a standard engulfing pattern.
In simple terms: at important support levels, support is more important than patterns; at ordinary support levels, patterns are more important than support.
3. Practical explanation of the engulfing pattern
Let me directly state a trading logic of 'look big, trade small.'
First, look at the important support levels on a larger scale. After the market drops to this position, if a engulfing pattern appears on a smaller scale, it can be a signal to go long.
Everyone, take a look at the picture below.
The chart shows the K-line chart of the British pound. The left side is the weekly K-line level, and the right side is the 4-hour K-line level.
On the left side, the market has dropped significantly, from 1.342 to around 1.200, from September 24 to January 25.
After the market dropped to the support level, switch to the 4-hour level. A engulfing pattern formed near the support level on the 4-hour chart, with the bullish candle's body almost fully covering the previous bearish candle.
However, at such an important horizontal support level, we must pay more attention to support, and we can relax the requirements for K-line patterns a bit. After entering, set the stop loss at the low point of the engulfing pattern.
Afterward, the market surged more than 400 points, with a stop loss of only 40 points, resulting in a particularly good risk-reward ratio.
In forex trading, other sizes and cycles can also be combined, such as daily with hourly, 4-hour with 15-minute.
Here, I will expand on this.
After the market drops significantly at the weekly level and reaches an important horizontal support level, it is likely to experience several weeks of bullish movement, resulting in several bullish weekly candles.
This indicates that in the coming weeks, the market will likely trend bullish, and it won't rise all at once; it will mostly oscillate upwards.
In practice, we can seize such important support opportunities on a larger scale, continuously looking for long opportunities in the British pound over a few weeks. As long as the market pullback signals a reversal, we can keep going long.
You can even switch to the 1-hour level and continuously go long. After several weeks, the profits will be quite good, and then you can take a break and wait for the next similar opportunity.
This method is also applicable to different trading instruments.
Let me explain a similar example, with the same logic but slightly different details, to help everyone deepen their understanding.
This is the combined movement of the US dollar against the Swiss franc at the 4-hour level and the 15-minute level.
The chart shows the K-line of the US dollar against the Swiss franc, with a movement similar to the previous example, but the time frames have changed to 4 hours and 15 minutes.
On the left side, in the 4-hour chart, the market rose rapidly from the bottom, reaching the previous pressure level of 0.91964, and then formed a large bearish candle, creating a downward engulfing pattern that meets our technical standards for engulfing patterns.
After this pattern appears, we know that the market on the 4-hour level will decline for a period of time, with several bearish candles likely forming, and the bearish trend may continue for 1-2 days.
Switch the K-line chart to 15 minutes and look for short opportunities; there are a total of three.
The first time is after the market breaks down and pulls back to the neck line, forming a downward engulfing pattern, at which point you enter and set the stop loss at the high point.
The second time is to enter after an upward pullback breaks the trend line, with the stop loss also placed at the high point.
The third time is to enter after the market breaks down following a horizontal consolidation, with the stop loss also placed at the high point.
After 2 days of market movement, the bearish space on the 4-hour level has also appeared, so you can pause trading and wait for the next opportunity.
Both examples use the same logic, only differing in cycles, with slight variations in details. The goal is to thoroughly explain this trading logic. Mastering one trading logic is much stronger than having a vague understanding of ten.
This logic is a standard opportunity-waiting trading logic. 'Look big, trade small' has a high success rate and an ideal risk-reward ratio.
The engulfing pattern is the most comfortable pattern for me to trade since I started, and I sincerely recommend it to everyone, hoping it can help with your trading.

