Six things not to start with, four things not to let go:
Six things not to do:
1. If the coin keeps falling and the 60-day line hasn't stabilized yet, don't touch it. Follow the trend, wait and see if the coin keeps falling.
It will come back later.
2. Don’t buy coins that have good news after they have risen. Good news is often a signal to sell.
News, the main force may want to close the net.
3. If the price rises too fast, stay away from the 5-day moving average and don’t chase it. The risk of rising too fast is also high, and chasing high prices can easily lead to being trapped.
4. Don’t take risks if the coin suddenly jumps at a high level. The risk is not small if the coin jumps at a high level. It may be that the main force is quietly selling.
5. If the turnover rate exceeds 30%, we should avoid it. If the turnover rate is too high, it means that the bulls and bears are fighting fiercely. We should avoid this volatile market.
Affection.
6. Don’t be fooled by coins that are still trying to maintain their value despite a bad market. Coins that are still trying to maintain their value despite a bad market are most likely just a scam.
Four things not to let go:
1. If the RSI+ is between 50 and 80, continue to hold it. If the RSI is in the middle and higher, it means that the coin still has strength and you can earn more by holding it.
many.
2. Don’t rush to sell coins that have jumped up from a low position. A gap-up upward movement indicates that the bullish momentum is very strong. Wait and see if it can continue to rise.
3. Hold on to the coins that are trending upward. Follow the trend. The longer you hold on to the coins that are rising, the more you will earn.
4. Don’t sell coins that have all their chips concentrated in one place. If all the chips are piled up together, the main force may want to push the price up. Wait until the price reaches a higher point before selling.
It’s not too late to do it.
Experience in cryptocurrency trading: When it comes to cryptocurrency trading, you still have to follow the rules and can’t just go by your feelings.
It is much more reliable to see the trend clearly than to guess blindly!
I am Chu Ge, with more than 10 years of practical experience in the crypto market. I focus on "technical teaching" and am committed to helping traders improve their trading skills and theories.
Think about it, establish a stable mentality, avoid being cut, make rational decisions, and pay attention to the official account: <比特大魔王>!
Generally speaking, the entire disk is divided into two parts: main and secondary. You can also place the main picture alone, depending on your personal preference.
Let’s look at the main picture first:
What indicators are generally used in the main chart?
I personally prefer to use weighted moving average + EMA, of course there are also those who use MA.
What is the difference between the moving average MA and the weighted moving average EMA?
The simple explanation of MA is to average the stock prices of several days and then connect them into a line.
For example, the 5-day moving average is the average of the prices from the first day to the fifth day, and the average of the prices from the second day to the sixth day.
The price from the third to the seventh day is averaged to get a value, and so on, these values are connected into a line to get the 5-day average.
Wire.
How to understand it?
If the current price is above the 5-day moving average, it means that the market purchasing power is relatively enhanced in the past five days.
Domestic market purchasing power continues to decline.
5 days is too short. What if we change it to a 120-day moving average?
In other words, if the market price stands above the 120-day moving average, does it mean that purchasing power has continued to rise over the past 120 days? What does this signal?
Purchases in a short period of time may be volatile, but purchases in a long period of time will form a trend, so the 120-day moving average is used to judge medium and long-term trends.
The role of trends.
If the price crosses the 120-day moving average and stabilizes, it means that there will be a short-term or long-term upward trend.
Rising market. This is the meaning of moving average.
So what is EMA?
It is an algorithm based on MA. As for how to calculate it, it is more complicated. Its feature is to increase the sensitivity of MA and make the moving average
When the K-line changes drastically, it can follow the adjustment.
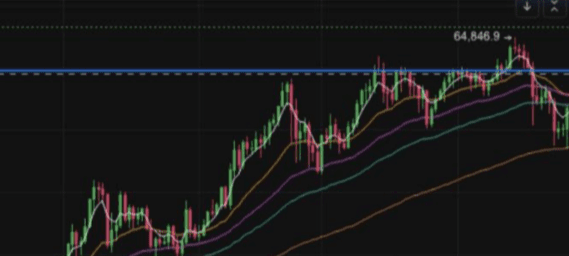
As shown in the figure, 12345 are EMA5, 20, 40, 60 and 120 day lines respectively.
I choose EMA because it is smoother than MA, looks better, and can increase the accuracy of judgment.
Very big, the latter is recommended for short-term trading.
The relationship between moving average and price: Price is like a dog running wild, and moving average is like a rope. When the dog runs too far, the rope and the dog are
There will be tension between them.
However, the moving average only cares about price and does not pay attention to the combination of volume, so the dealer will use the moving average to create various traps to lure more and less.
It is rude to negotiate price based on the quantity.
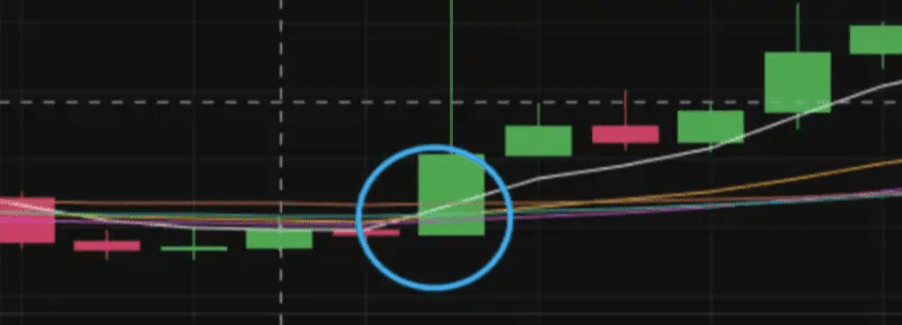
Look at how perfectly these moving averages line up.
A situation where the moving average plays a supporting role.
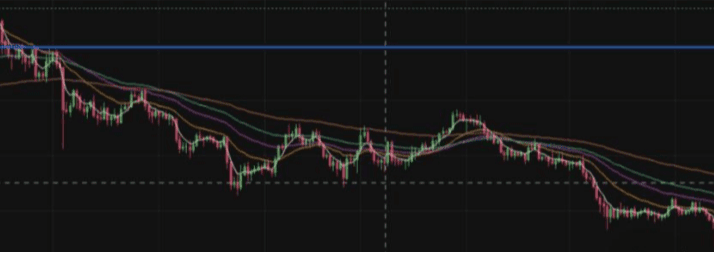
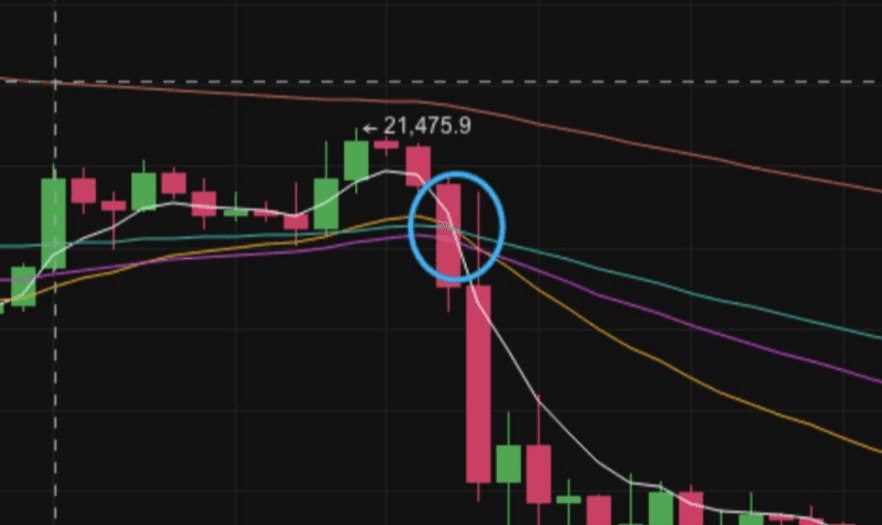
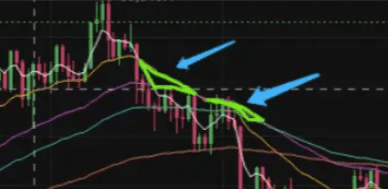
A situation where the moving average plays a suppressive role.
A situation where the moving average plays a suppressive role.
Feel it carefully.
How can we use moving averages to help us make better judgments?
Some indicators extended from the moving average include:
What do golden cross, death cross, price support, price pressure, golden spider, death spider, etc. mean respectively?
Golden Cross: The cross formed by the short-term moving average crossing the long-term moving average has a supporting effect on the price in the short term. As shown in the figure:
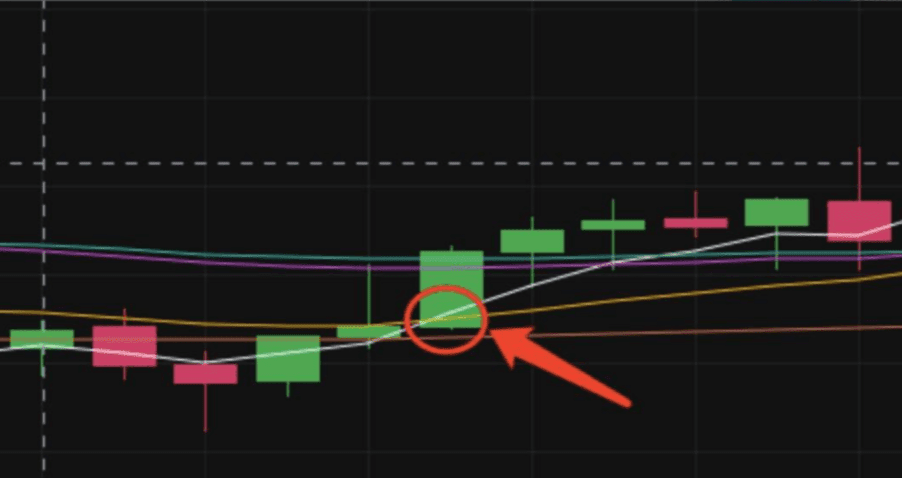
There are two golden crosses in the figure: the cross formed by the 5-day moving average crossing the 10-day moving average, and the golden cross formed by the 5-day crossing the 20-day moving average. The price has been rising in a short period of time.
The internal rise is successful.
5-day golden cross indicates that people who bought within 5 days are willing to use more than the average price within 10 days to chase the rise, so short-term demand exceeds supply, and the price
The rise is natural.
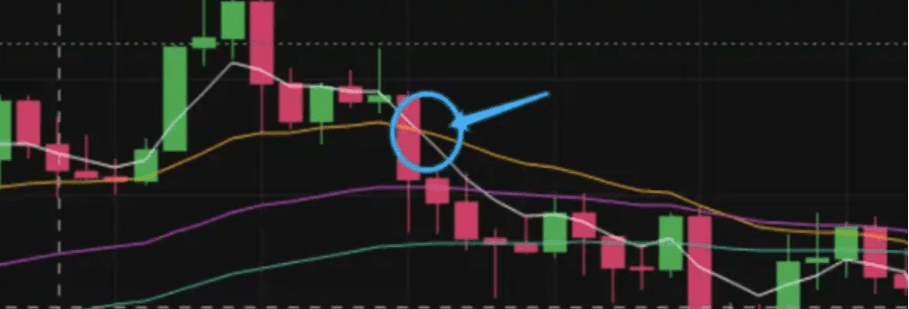
The cross formed by the 5-day moving average crossing below the 10-day moving average in the figure is called a death cross, which has a suppressive effect on prices in the short term.
Golden cross and death cross play a role in judging the next trend in a certain sense.
However, it also has a lag, and if it is a short-term moving average, it is even more limited.
How to increase its power?
Multiple Crossovers Simultaneously: Golden Spider and Dead Spider.
The picture shows a typical dead spider: the 5-day moving average crosses below the 10-day and 20-day moving averages, and the 10-day moving average crosses below the 20-day moving average, forming a six-legged spider.
Spider-like shape. It has a strong bearish warning.
On the contrary, the shape formed by the 5-day crossing the 10-day, the 5-day crossing the 20-day, and the 10-day crossing the 20-day is called the Golden Spider. The appearance of the Golden Spider indicates that the bulls are coming.
Lin.
The appearance of spiders often indicates the market trend for the next period of time, because it has three cycles involved at the same time. As for how long the trend will last,
See what period the moving average involved is.
By the same token, any moving average crossover has a lag. How can we increase its stability and durability?
So let’s extend it further: price support and price pressure.
Price support: The three intersection points formed by the 5-day moving average crossing the 10-day moving average, the 10-day moving average crossing the 20-day moving average, and the 5-day moving average crossing the 20-day moving average
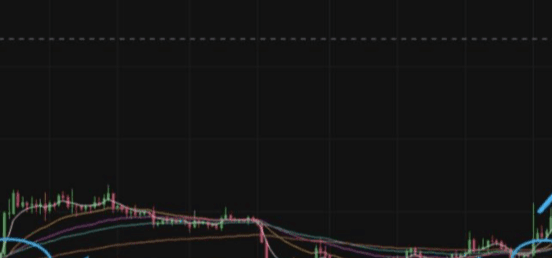
The triangle formed will support the price for a period of time in the future. As shown in the figure:
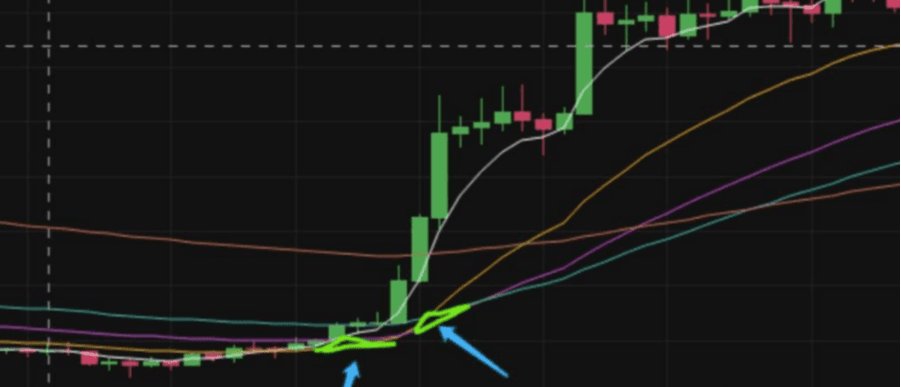
Not only did it form a price support, but it also formed a double price support. Facts proved that there was a wave of upward trend lasting three months.
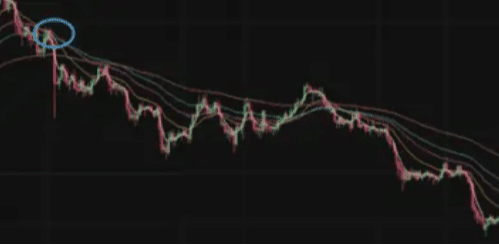
Price pressure: The triangle area formed by the intersection of the 5-day moving average crossing the 10-day, the 5-day crossing the 20-day, and the 10-day crossing the 20-day is for the next period of time.
Prices within a certain timeframe have a suppressive effect.
The price continued to fall for a whole year under this double price pressure.
Therefore, generally speaking, the beginning of a market trend is often the appearance of price support or price pressure patterns. Two price support or price pressure patterns are more stable.
When this pattern occurs, bulls can enter the market on dips and vice versa.
Note: Horizontal and volatile market is excluded.
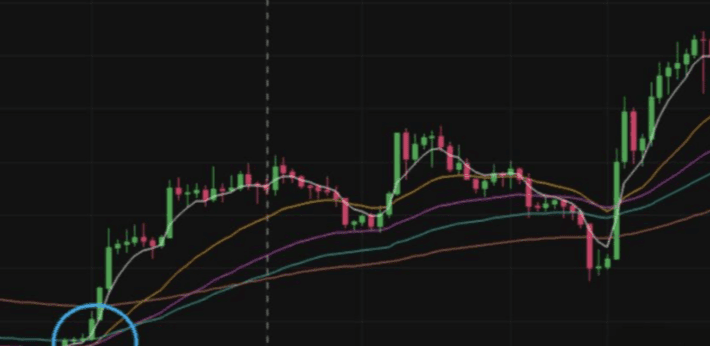
Let's look at the above chart and think about this question: How did the two levels of double price support appear? Why did this market trend occur?
Friends who have seen this and want to improve their cryptocurrency trading skills must read more and study carefully. It is recommended to collect it!
Several key points for cryptocurrency trading
1. Keep a close eye on Bitcoin + trends
In the cryptocurrency world, Bitcoin often leads the way in terms of price fluctuations. Although Ethereum+ can sometimes be strong and have its own independent trend, most altcoins are affected by the
Its left and right
2. Pay attention to the relationship between Bitcoin and USDT+
Bitcoin and USDT often move in opposite directions. When USDT rises, you need to be wary of Bitcoin falling. When Bitcoin rises, it is an opportunity to buy USDT.
3. Seize the opportunity to trade in the early morning
From 0:00 to 1:00 every day, it is easy to see the phenomenon of pinning. Domestic coin friends can set the buying price of their favorite coins at a low price before going to bed, and set the selling price at a high price, or there may be a surprise.
Happy to close deals and make profits easily.
4. Observe the rise and fall trend in the early morning
Every morning from 6 to 8 o'clock is the key period for buying or selling. If the price continues to fall from 0 o'clock to 6 o'clock, it is advisable to buy or make up for the loss.
If you keep rising, it is advisable to sell, as it is likely to fall on the same day.
5. Pay attention to the afternoon fluctuations
Pay special attention to 5 pm. Due to the time difference, American coin friends start to operate, which may cause the price of coin to fluctuate. Many big rises and falls occur at this time.
born.
6. Beware of Black Friday Plus
There is a saying in the cryptocurrency circle that there is a "Black Friday". Although there are big drops on Friday, there are also big rises or sideways movements. Just pay attention to the news.
7. Be patient with falling currencies
If a coin with a certain trading volume falls, don't worry. Hold on patiently and you can get your money back. It can take as short as 3 or 4 days or as long as a month. If you have extra money, you can make up for it in batches.
Unless it is a junk coin.
8. Stick to long-term spot trading
When doing spot trading, holding the same currency for the long term and trading less frequently often yields greater returns than frequent trading. It all depends on your patience.
9. Pay attention to external factors
The volatility of the cryptocurrency market is affected by many factors, such as the attitude of various countries towards cryptocurrencies, which will fall if they are negative; the financial policies of the United States; the views of bigwigs on cryptocurrencies, such as
Musk's remarks. Pay attention to financial news.
10. Maintain a positive mindset when trading cryptocurrencies
The mentality of cryptocurrency trading is crucial. Don’t panic when the price drops sharply, and don’t be arrogant when the price rises sharply. Just lock in your profits.
Because we have a goal, everything is possible
The ideal of life is to live an ideal life
Action is the answer so I never ask why
#美国加征关税 #TruthSocial加密蓝筹ETF #BTC再创新高
$XRP $ETH $BTC


