A comprehensive guide to candlestick chart patterns: Understand 12 high-probability patterns at a glance (with trading strategies).
This guide will teach you how to interpret candlestick patterns and detail the 12 most popular candlestick patterns every novice trader should be familiar with in daily trading. For each pattern, we will introduce identification methods, trading strategies, and related important information to help you achieve the best trading performance. You will also learn which candlestick patterns are best suited for day trading or long-term investment.
In trading, candlestick charts refer to a specific type of price chart that can provide traders with price information about a particular asset over a specific time period. Sometimes, these candlesticks combine into recognizable specific patterns. When interpreted correctly, these patterns can help traders reduce risks, confirm trends, and make more informed trading decisions.
In addition, since trading itself is a high-risk activity, we will introduce four simple 'trading rules' that every trader should follow to minimize potential losses and maximize returns.
Trading Rules
Rule #1. If in doubt, exit the market.
Trading is far from an exact science. While charts, trading patterns, and technical indicators can provide you with a statistical edge in making trading decisions, they do not guarantee success.
Unfortunately, some trades, even if they look perfect on paper, may not develop as you wish. In practice, up to 40% of trades may fail. Therefore, when making mistakes, it is crucial to stop losses early. If you start to doubt the performance of a trade after entering, you should quickly close the position.
Rule #2. Do not look back.
Admitting that you made a mistake and closing a position at a loss is psychologically very painful. Because of this, many traders will hold their positions for too long. They think, 'I should have closed at a certain price point but did not, so I will wait for the price to return to that level before exiting.' This is an extremely wrong approach.
Once you realize you were wrong about the direction, decisively stop the loss and do not look back. Similarly, even if you just closed a trade and then the price soars, do not look back. Traders must make decisions based on the information available at that time. It is easy to look back at past trades and try to figure out what should have been done, but it is a waste of time. Make decisions based on the information at hand, and then let go of the past.
Rule #3. Plan ahead to avoid poor performance.
Trading requires you to spend sufficient time analyzing potential opportunities and planning based on trading patterns. Do not attempt to trade on impulse or 'wing it,' as this is a reliable path to long-term losses. If you cannot find high-probability trading opportunities the night before trading day, it is better to wait for the next day.
Rule #4. Ignore market noise.
If you are trading based on candlestick charts, do not let economic data or financial news interfere with your judgment. Unless it is a shocking global news event, it should not affect your trading decisions. For example, the Russia-Ukraine war or the Iraq-Iran war are major breaking news events that should impact your trades, but a central bank official's comment on a nearly irrelevant topic should not influence your trading judgment.
Candlestick Patterns
These candlestick patterns apply to all tradable assets with publicly available historical price data — including forex, futures, stocks, and cryptocurrencies — and can be applied over any time period.
① Dark Cloud Cover
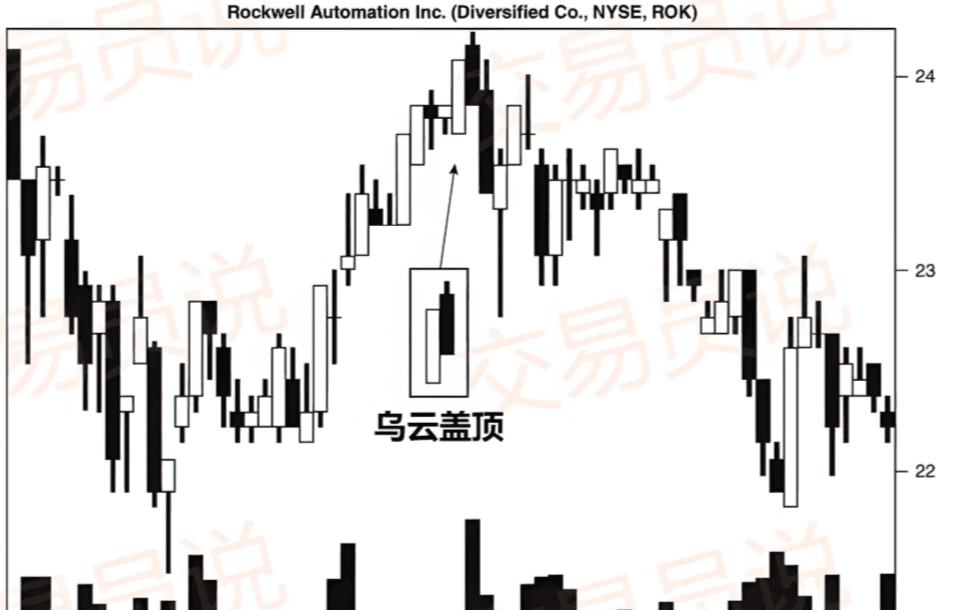
As shown in the figure above, the dark cloud cover pattern is ironically formed; its starting point is typically an upward price trend, where the bulls continuously push the price higher. You should see a tall bullish candlestick (white candlestick), suggesting that the market may continue to rise; then, the next day, the opening price is higher than the previous day's high, creating a gap up. At this point, the bears begin to exert selling pressure, causing the price to decline all the way down, ultimately closing near the day's low, thus forming a complete candlestick pattern.
Most traders believe that this candlestick pattern only makes sense when it appears after an uptrend. In other words, as the price continues to rise, the pattern's reference value for identifying trend reversals increases. Conversely, if the price is in a consolidation or oscillating market, the reliability of the dark cloud cover pattern will decrease significantly.
In summary, identifying the dark cloud cover pattern should meet the following five conditions:
◎ Currently in a clear upward trend.
◎ A bullish candlestick appears in this uptrend.
◎ The next day, a gap opens higher.
◎ A bearish candlestick closes after a gap up.
◎ The closing price of the bearish candlestick is below the midpoint of the previous bullish candlestick's body.
The dark cloud cover pattern usually signals that the price may decline. Therefore, if the price continues to rise the next day, it can be reasonably determined that the pattern has failed; but if the price indeed drops, the pattern can be confirmed, and at this point, consider entering the trade.
Naturally, traders who identify the dark cloud cover pattern should consider promptly exiting all long positions. For traders seeking to establish short positions, the best practice is to set stop-loss orders above the confirmed bearish pattern candlestick high. The confirmed candlestick refers to the bearish candlestick that further verifies the validity of the pattern the day after it appears.
When using the dark cloud cover pattern, combine it with other technical indicators to enhance the probability of successful trades. Many traders incorporate the relative strength index (RSI) when trading this pattern for auxiliary judgment. If the RSI reading is above 70, it indicates that the price is in an overbought state. Therefore, when the RSI is above 70 accompanied by the dark cloud cover pattern, this combination signal is usually more reliable, indicating that the price is likely to decline soon.
Unlike other candlestick patterns, the dark cloud cover does not have a fixed profit target. Traders must rely on other indicators (such as RSI, moving averages, or fundamental factors) to determine when to exit for profit.
② Gravestone Doji
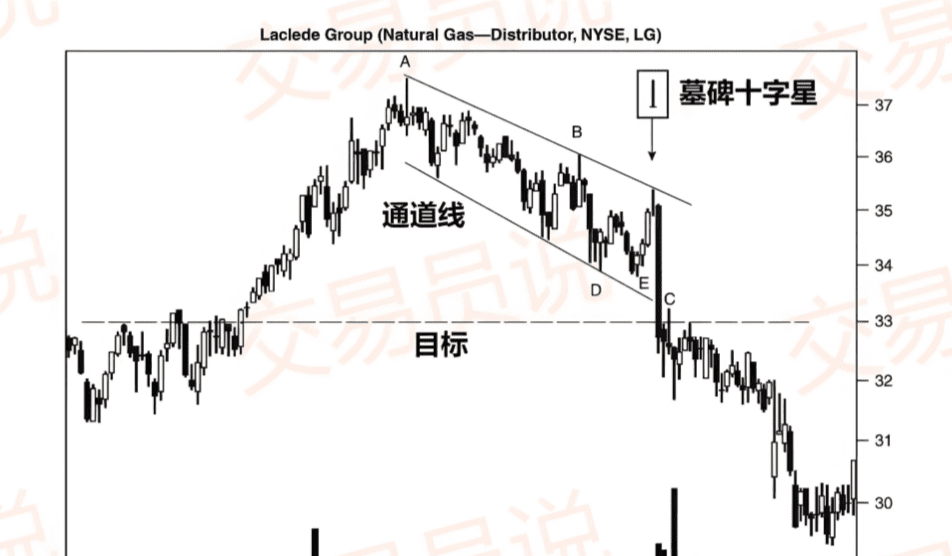
The gravestone doji is aptly named; it is a bearish reversal pattern that indicates the price is about to decline. Although we more often find the gravestone doji in uptrends, as shown in the figure above, this pattern can also appear in downtrends, indicating that the price may continue to decline.
The formation of the gravestone doji requires that the opening price and closing price equal the day's low. This situation usually occurs in the context of bullish traders dominating after the opening and pushing the asset price higher. However, the rising price attracts bearish traders to enter, and they ultimately prevail by applying significant selling pressure, causing the price to fall back to the opening price and close at the day’s low. In other words, the formation process of the gravestone doji is: the price opens high and rises but ultimately falls back to the starting point, forming a candlestick pattern resembling a gravestone.
Since the gravestone doji suggests that the price of the asset may soon decline, traders typically choose to exit all long positions and consider establishing short positions. Of course, as with identifying other candlestick patterns, it is best to combine this with other technical indicators to confirm the validity of the signal. For the gravestone doji, 'volume' is a key confirmation indicator.
As shown in the figure, shortly after the gravestone doji forms, volume increases significantly. This surge in volume indicates that selling pressure is imminent, ultimately driving the price down. For traders who were trading this pattern at the time, it would be wise to enter the market and short as soon as this pattern appears. Conversely, a reasonable stop-loss position would be set just above the low of the previous trading day.
In the gravestone doji pattern, it is difficult to set a fixed profit target. Therefore, traders must rely on their judgment and other indicators to assess when the price hits a bottom and when to take profits.
It is also important to note that the 'gravestone doji' is not a particularly reliable candlestick pattern. Therefore, it is recommended to use it in conjunction with other confirmation indicators, such as volume, RSI, or MACD, to increase the chances of success.
③ Dragonfly Doji
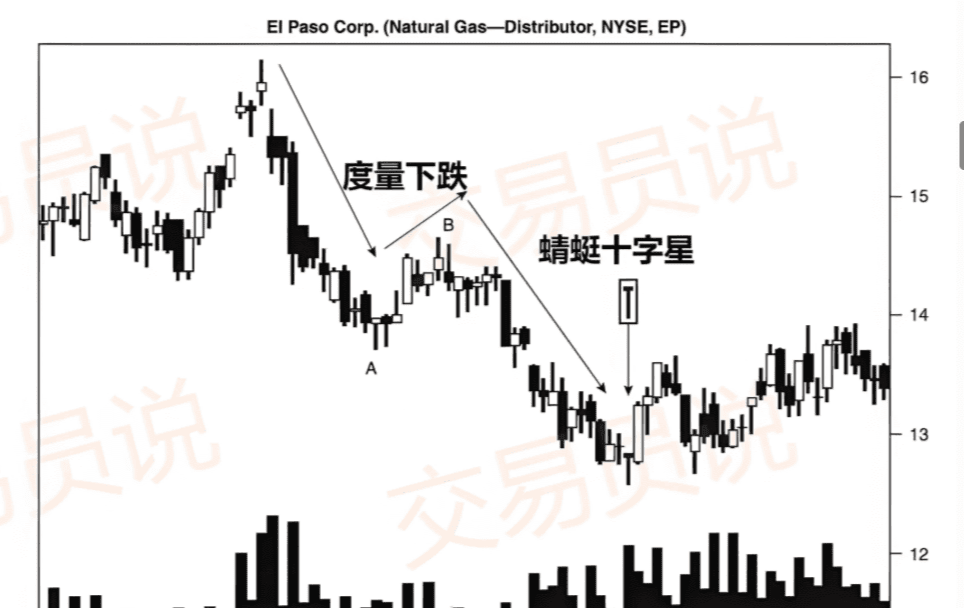
The dragonfly doji is precisely the opposite of the gravestone doji. However, like the gravestone doji, the formation of the dragonfly doji also requires the opening and closing prices to be at the same level.
Identifying the dragonfly doji is relatively easy because its shape is very distinctive. This pattern typically appears on trading days when, after the opening, bears exert continuous selling pressure, pushing the price down. However, at some point, bulls seize the opportunity to buy at a lower price, pushing the price back up to near the opening price, ultimately closing at the opening price. Recall that the formation process of the gravestone doji is the opposite of that of the dragonfly doji.
Unfortunately, the dragonfly doji, like the gravestone doji and all other doji patterns, is not a particularly reliable candlestick signal. Therefore, it is recommended to use it in conjunction with other technical indicators, such as volume, RSI, or MACD, to enhance the confirmation effect of the pattern.
Similarly, when the price is in a range-bound phase, the predictive ability of doji patterns is very limited. This is because doji patterns typically require a trend reversal to be effective; in a range-bound scenario, due to the lack of a clear trend to reverse, doji patterns often struggle to provide valid signals. The only exception is when the price is at the top or bottom of the range; in that case, doji patterns may help confirm the validity of support or resistance levels.
For example: if the price of gold is in a range-bound state and is currently trading near the support line, then if a dragonfly doji appears, it may signal that the gold price is about to rise and help validate the reliability of the previously drawn support line.
④ Morning Star
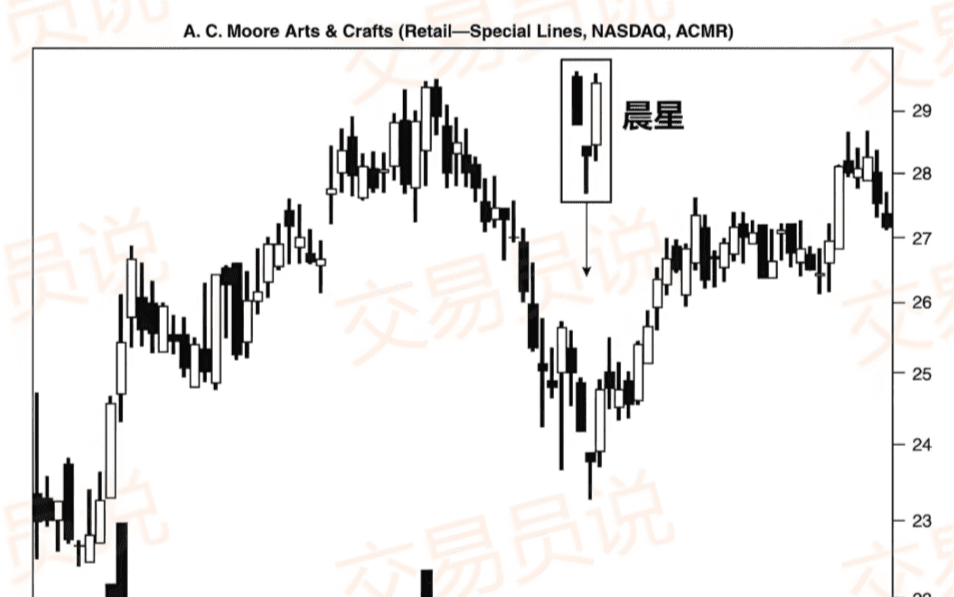
The morning star is a bottom reversal pattern, indicating that after a period of decline, the price is expected to start rising. The name comes from the alias of Mercury, 'the morning star,' symbolizing the omen of sunrise.
As shown in the figure above, this pattern consists of three distinctly different candlesticks. The first is a large black bearish candlestick, showing that the bears fully control the market; the second is a smaller black bearish candlestick (sometimes a doji), indicating that the bears' strength is weakening, and their ability to continue to push the price down is decreasing; the third is a large white bullish candlestick, recovering most of the decline of the first bearish candlestick, indicating that the bulls have regained control. You can see these three candlesticks marked in the figure above.
Ideally, there should be a gap between the second and third candlesticks of the morning star pattern, but even if the gap is not obvious, it will not significantly weaken the validity of the pattern. The key to determining whether the morning star pattern is established is that the third candlestick must rise strongly, recovering as much of the decline caused by the first bearish candlestick as possible.
Like other candlestick patterns, the morning star also has its limitations. The most significant limitation is that the entire pattern is only considered complete after the third candlestick closes. Typically, by the time the third candlestick closes, the price has already shown a significant rebound, which poses a challenge to the risk/reward ratio for traders — in other words, when you enter, a large portion of the potential profit may already have been consumed.
As the name suggests, since the morning star pattern indicates that the price will rise, traders should promptly exit their short positions and consider establishing long positions. In this case, setting the stop-loss at the lowest point of the second candlestick is usually a safer approach.
However, before entering, it is always wise to use other technical indicators to confirm the price reversal. Since the morning star is a bullish pattern, support lines are particularly useful during the confirmation process. Similarly, it is ideal for the volume to show a gradual upward trend throughout the formation of the three candlesticks, especially with the highest volume on the third day. High volume accompanying the third bullish candlestick is regarded as the most reliable way to confirm the morning star pattern.
⑤ Evening Star
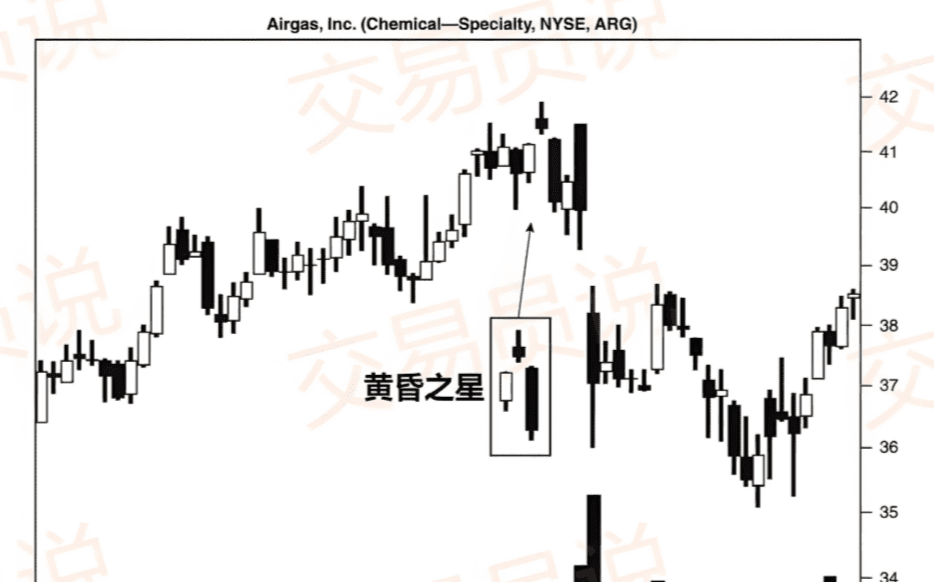
The evening star pattern, as its name suggests, is the 'bearish version' of the morning star. As you can see from the figure above, the evening star is named after the planet Venus, which appears in the sky before sunset.
The evening star pattern also consists of three distinctly different candlesticks. The first is a long white bullish candlestick, showing the strength of the bulls; followed by a smaller black bearish candlestick, which is the 'star', indicating that the momentum for price increases is waning and a top may have formed; the third is a larger black bearish candlestick, which retraces most of the gains of the first bullish candlestick, completing the entire evening star pattern. As you may have noticed, the logic of the evening star's formation is the exact opposite of that of the morning star.
Ideally, there should be a gap between the second and third candlesticks of the evening star, but such gaps are even rarer in actual trading and are not a necessary condition for determining the validity of the pattern. Although many teaching illustrations show both the morning star and evening star with gaps, it may not be observed in actual trading. The key to determining whether the evening star pattern is valid lies in whether the third candlestick clearly engulfs most of the gains of the first bullish candlestick.
The limitations of the evening star are exactly the same as those of the morning star. In other words, when the third candlestick confirms the establishment of the pattern, the price has already experienced a significant decline, and from a risk/reward perspective, entering at this time may have partially consumed the potential return.
Since the evening star is a bearish pattern, resistance lines will be very valuable during the confirmation process. Similarly, the ideal volume characteristics should be: gradually increasing volume throughout the formation of the three candlesticks, with the highest volume on the third day. The large volume drop on the third bearish candlestick is usually regarded as the strongest confirmation signal for the evening star pattern.
⑥ Shooting Star
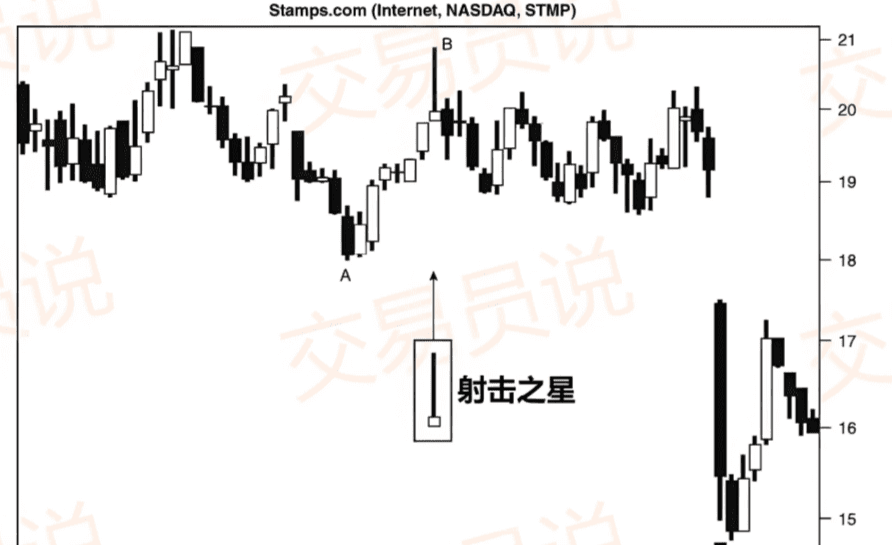
The shooting star is a bearish reversal candlestick pattern that appears after an uptrend. As shown in the figure above, the characteristics of the shooting star include a long upper shadow, a very small body, and a very short or almost nonexistent lower shadow. The name of this pattern comes from an old Japanese proverb: 'A shooting star in the sky signals misfortune.'
As a bearish pattern, the shooting star must appear after a series of continuous price increases. Its effects are most pronounced when it follows three or more consecutive bullish candlesticks that are continually reaching new highs. Of course, even if it appears after a series of bearish candlesticks, as long as the price is overall in an upward trend during that period, it can still be valid.
The process of forming a shooting star is as follows: the price rises after the opening but then faces strong selling pressure from bears, causing the price to fall back near the opening price and ultimately close, forming this type of candlestick. The longer upper shadow represents the bulls attempting to push higher but ultimately failing, leading to losses for those who bought at higher prices.
An ideal shooting star should feature a gap between its body and the previous candlestick. You can see this in the figure above. However, like many other patterns, this gap may not appear in practice and is not a necessary condition for forming the pattern. However, if the gap does not appear and other technical indicators do not support the validity of the pattern, then the reliability of the pattern may be compromised.
If you recall the gravestone doji we discussed earlier, you will notice that the shooting star resembles it in appearance. This is because the gravestone doji can be seen as a special form of the shooting star: the gravestone doji's body is almost zero (since the doji pattern has no body), making it a stronger bearish signal than the shooting star.
The main problem with the shooting star is that it is not a particularly strong bearish pattern and can only occur after a clear uptrend. This is also its most apparent limitation. In a strong upward trend, the significance of a single candlestick should not be overemphasized. Therefore, traders need to wait until the price truly starts to decline to confirm the effectiveness of the shooting star.
Unfortunately, since the shooting star itself is not particularly strong, even if a brief decline occurs after its formation, the price may quickly rebound and continue to rise.
Therefore, by the time the pattern is truly confirmed, the ideal entry timing is often missed. Traders looking to trade the shooting star should combine other technical indicators to assess its validity and potential downside. Indicators that help evaluate the subsequent movement of the shooting star include the Relative Strength Index (RSI), resistance lines, moving averages (MA), and volume.
Before continuing to learn about the next candlestick pattern, we should also point out that the shooting star is almost identical in shape to another candlestick pattern, the inverted hammer. The only difference is that the shooting star appears after a significant price increase, while the inverted hammer typically appears after a clear price decline.
⑦ Hammer
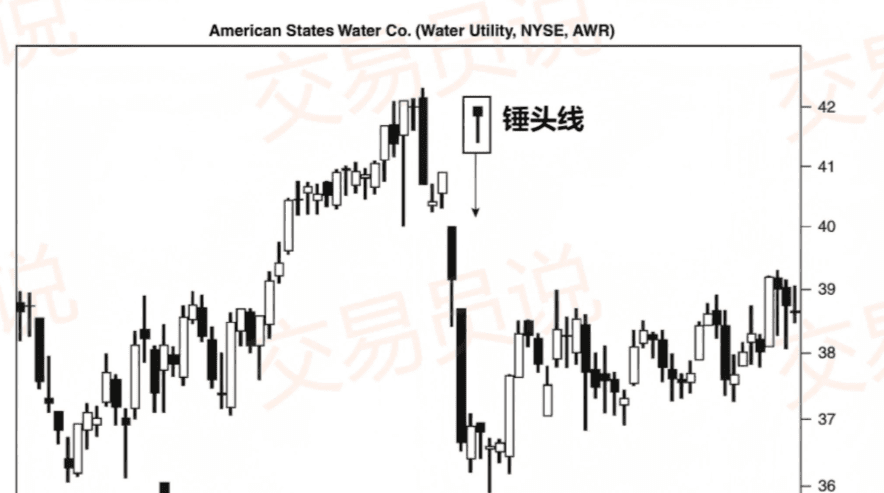
As shown in the figure, the hammer candlestick's characteristics are: a small body with a long lower shadow. Although the hammer is a bullish reversal pattern, its body can be either a bullish (white) or bearish (black) candlestick. This is because even a hammer with a bearish body can trigger a strong upward movement.
However, for the average reader, we can consider that a hammer candlestick with a bullish body usually represents a stronger reversal signal, while a hammer with a bearish body represents a relatively weaker reversal signal. That said, in my personal experience, the color of the hammer's body does not have a substantial impact on the validity of its pattern.
The key criterion for identifying the hammer candlestick is the length of the shadows. The length of the lower shadow (also known as the 'wick' or 'tail') should be at least two to three times the length of the body to constitute a qualified hammer candlestick. Let’s look at how this is represented in actual charts.
As shown in the figure, there are two potential hammer candlestick patterns. However, the lower shadow of the first hammer candlestick is too short and does not meet the pattern requirements, so it cannot be recognized as a hammer candlestick. In contrast, the lower shadow of the second candlestick is particularly long, far exceeding the standard of two to three times its body length, which is key to forming an effective hammer candlestick.
The length of the candlestick is important because it indicates that the market attempted to push the price down significantly but ultimately failed. The intervention of bullish buying pushed the price back close to the opening price (forming the body of the hammer). The Japanese refer to this movement as a bullish 'kamikaze reversal.' This failure to push the price further down signals that a reversal may be imminent.
This reversal signal (and the hammer candlestick itself) needs to be confirmed when the price continues to rise the next day. If the price continues to rise the next day, the hammer candlestick pattern is considered confirmed, and traders can consider entering.
However, if the market turns downward again, be sure to remember trading rules #1 and #2: either do not enter the market or exit quickly with a stop-loss. Remember, missing out on some profits is better than using profits to cover losses.
Like the shooting star pattern, the hammer candlestick has a very similar 'relative' — the hanging man. The only difference between the two is that the hammer appears at the end of a downtrend as a bullish pattern, while the hanging man appears at the end of an uptrend as a bearish pattern.
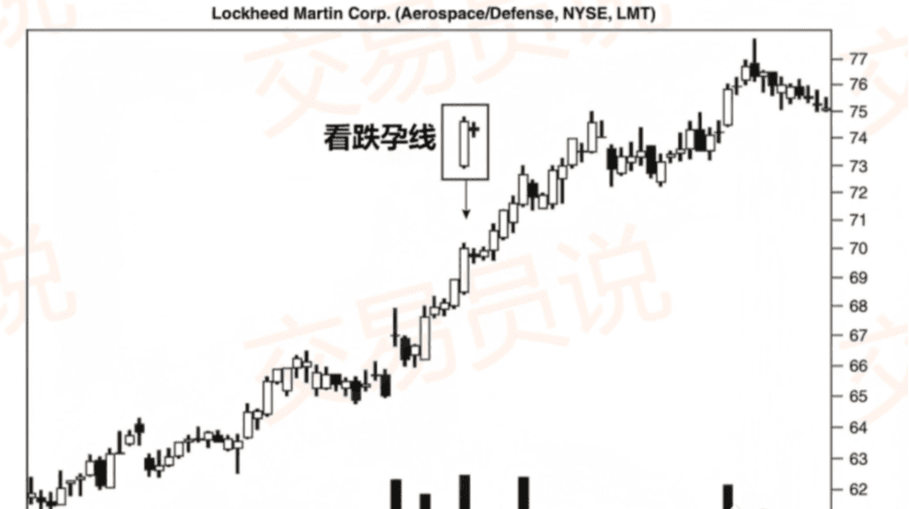
The bearish harami is a pattern consisting of two candlesticks, indicating that the price of an asset may soon turn into a downward trend. However, as clearly shown in the figure above, the bearish harami is not foolproof and can also fail.
The chart shows a structurally perfect bearish harami, but the price failed to turn down and continued to rise. Therefore, it must be pointed out from the start that the bearish harami is a particularly unreliable pattern, with a relatively high failure rate. Thus, traders should exercise extra caution when trading based on this pattern.
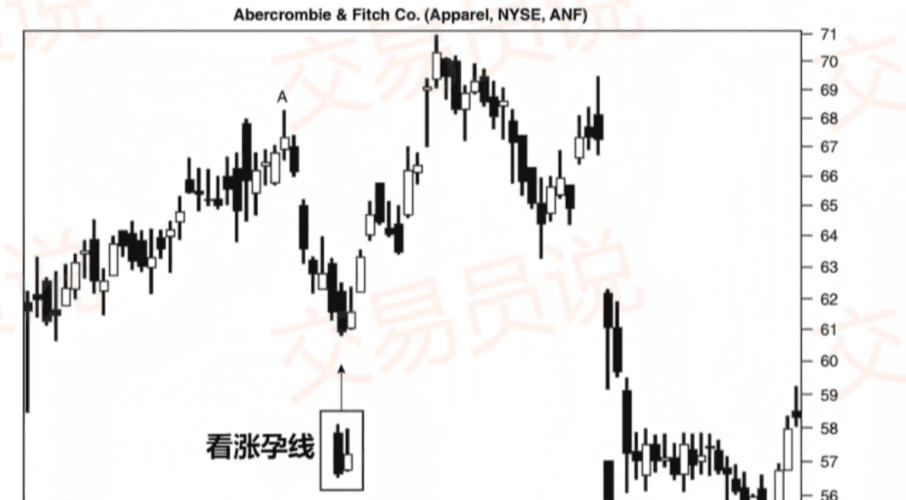
Identifying the bullish harami is relatively straightforward. This pattern consists of a long bullish candlestick (white) as the main candlestick, followed by a smaller black bearish candlestick. The only judgment requirement is that the second black candlestick must be completely contained within the body of the first bullish candlestick.
The strength of the reversal is inversely related to the size of the body of the second candlestick — the smaller the bearish candlestick, the higher the likelihood of a reversal. However, it must be emphasized that regardless of how small the second candlestick is, there is always a risk of failure in this pattern. As shown in the figure, even though the second candlestick is significantly smaller than the first, the price still did not reverse.
Due to the inherent instability and high failure rate of the bearish harami pattern, traders typically combine it with other technical indicators. While many indicators are available, the 200-day moving average is particularly popular when trading the bearish harami. Of course, it can also be combined with RSI and stochastic oscillators to aid in verifying the validity of the pattern.
Although it's advised to set stop-loss orders in any trade, it is particularly emphasized when using this pattern: stop-loss is a must. The setting of the stop-loss depends on the trader's risk tolerance.
Risk-seeking traders are advised to set their stop-loss orders at the bottom of the second bearish candlestick once the price confirms the decline.
Risk-seeking traders may choose to set the stop-loss at the top of the first bullish candlestick.
⑨ Bullish Harami
The bullish harami is the bullish counterpart of the bearish harami, indicating that the downward trend is about to reverse upward. Like the bearish harami, the bullish harami is a two-day pattern, where the body of the first main candlestick is longer than that of the second smaller candlestick.
The first day of this pattern typically shows a clear bearish trend and usually occurs at the end of a downtrend. On the second day, although bulls attempt to push the price up, their efforts are limited, and the closing price remains below the opening price of the first day. This trading behavior forms the basic shape of the bullish harami. Let's take a closer look at how to identify this candlestick pattern.
To identify a reliable bullish harami, the following characteristics should be noted:
◎ The price is in a downward trend.
◎ The body length of the first main candlestick is greater than that of the second smaller candlestick.
◎ The main candlestick should be a bearish candlestick.
◎ The second smaller candlestick is a bullish candlestick (the closing price is higher than the opening price).
◎ The opening price of the second candlestick is higher than the closing price of the first main candlestick.
◎ The closing price of the second candlestick is lower than the opening price of the first main candlestick.
As shown in the figure above, all the characteristics of the bullish harami illustrated above are evident, leading to a temporary reversal of the downward trend. The figure emphasizes that while the bullish harami may accurately predict a reversal, it cannot determine how long that reversal will last. The reversal may also be short-lived, with the downward trend quickly resuming thereafter. Therefore, traders should set reasonable profit targets and strictly implement stop-loss orders.
If the price rises again on the third day, the bullish harami pattern can be confirmed. More cautious traders often wait for the confirmation signal before entering. However, in financial markets, it is always necessary to weigh the risk/reward ratio. Since the reversal indicated by the bullish harami may be short-lived, you may have missed out on most of the profits by the time you enter. Therefore, traders with a higher risk tolerance may choose to enter the market near the close of the second candlestick.
Ultimately, how to operate these patterns depends on your personal trading goals, strategies, and risk tolerance, which is a choice that you need to weigh yourself.
⑩ Bullish Engulfing Pattern
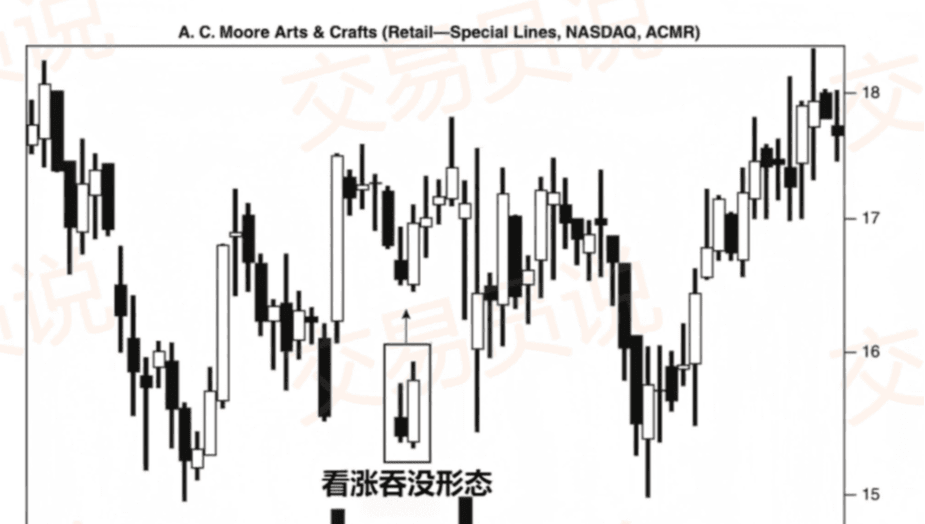
The bullish engulfing pattern is another reversal pattern composed of two candlesticks, indicating the end of the downward trend and the beginning of an upward trend. The name of this pattern comes from its formation characteristics: the second candlestick completely engulfs the first candlestick, exhibiting very strong bullish strength, hence the name 'bullish engulfing.'
Let's take a look at how to identify potential bullish engulfing patterns.
The main characteristic of identifying this pattern is that the first candlestick is bearish, followed by a larger bullish candlestick the next day. To constitute an effective bullish engulfing pattern, the following conditions must be met simultaneously:
◎ The length of the shadows (upper and lower shadows) of the second candlestick must be greater than the length of the shadows of the first candlestick.
◎ The highest price of the second candlestick is higher than that of the first candlestick.
◎ The lowest price of the second candlestick is lower than the lowest price of the first candlestick.
◎ The body length of the second candlestick is greater than that of the first candlestick.
As long as the above four points are satisfied and the pattern appears in a downward trend, it can be reliably identified as a bullish engulfing pattern.
It is important to emphasize that no matter how accurately you identify this pattern, candlestick patterns are not absolutely effective. Although the bullish engulfing pattern is generally more reliable, failures still occur.
Generally speaking, if the price falls below the lowest point of the first candlestick, it means the pattern has failed. In other words, if the price continues to fall below the low of the first bearish candlestick, the pattern is invalid. Therefore, that low point is a good place to set a stop-loss. However, some risk-seeking traders may choose to set the stop-loss at the lowest point of the second bullish candlestick to gain more maneuvering space in the trade.
When the price continues to rise on the third day, it indicates that the pattern is confirmed, and the trend reversal is established. The question is, when is the most appropriate time to enter the market? More cautious traders often choose to wait for confirmation signals on the third day before entering, but this inevitably sacrifices some potential profits.
Risk-preferring traders may choose to enter the market near the close of the second bullish candlestick. For these risk-seeking traders, it is recommended to closely observe the trading volume near the close of the second day. If the volume increases along with the price rise, it is safer to assume that market sentiment has changed and that the next trading day will confirm the validity of the pattern.
Although the bullish engulfing pattern is a strong signal for a trend reversal, it also has limitations. First, the second candlestick can sometimes be very large, meaning that traders who set a stop-loss at the low of the second bullish candlestick may face higher risks. Second, this pattern does not provide a clear profit target, making it challenging to determine reasonable exit points. Traders need to combine other technical indicators or methods to set reasonable profit targets.
⑪ Bearish Engulfing Pattern
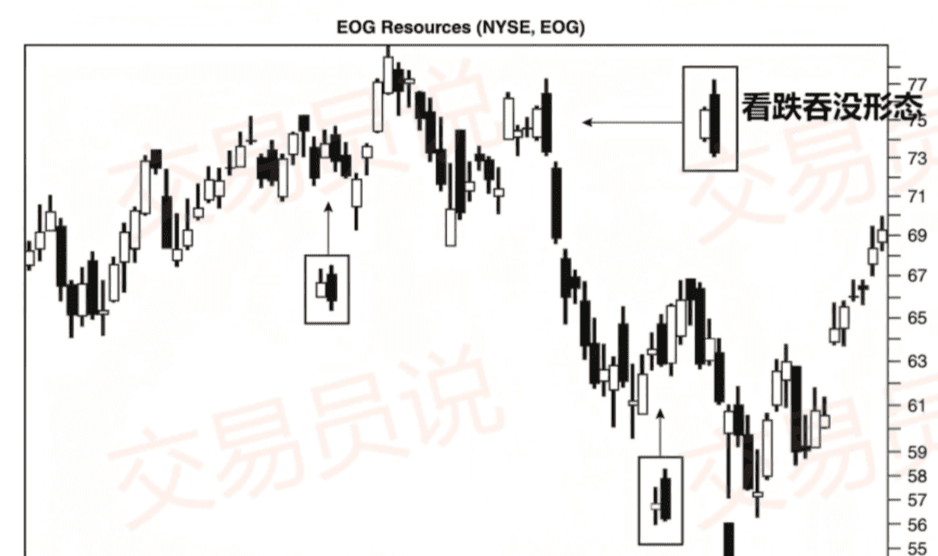
As the name suggests, the bearish engulfing pattern is the bearish counterpart of the previously mentioned bullish engulfing pattern. It consists of two candlesticks, indicating that the upward trend is about to end and may initiate a new downward trend.
When identifying this pattern, the main characteristics include: the first main candlestick is a bullish candlestick; the next day is followed by a larger bearish candlestick. When the opening price of the second bearish candlestick is significantly higher than the closing price of the first bullish candlestick, this pattern is considered more reliable.
Additionally, the reliability of this pattern is higher when the uptrend has lasted for a long time. If the price is oscillating or in a range-bound phase, while the bearish engulfing pattern may frequently appear, it often fails or leads to limited downward movement and a short duration.
Similar to the bullish engulfing pattern, if the price continues to decline on the third day, it confirms the validity of the bearish engulfing pattern. Cautious traders will wait for this confirmation signal before entering, but doing so may sacrifice some potential profits. In contrast, risk-preferring traders may choose to enter near the close of the second bearish candlestick. Such traders should closely monitor changes in volume, as volume can reflect the reliability of the pattern.
When trading the bearish engulfing pattern, it is generally recommended to set the stop-loss order at the opening price of the second bearish candlestick. If the price rebounds to this level, it means the bulls have regained control of the market, and the pattern may fail.
Additionally, when trading the bearish engulfing and other candlestick patterns, it is especially important to consider the broader trend. For example, when the asset is in a significant upward trend, the effectiveness of the bearish engulfing pattern may be short-lived, especially in the absence of supporting indicators.
However, if the asset starts to rebound after a significant decline and shows a bearish engulfing pattern, this may be an excellent opportunity to enter short.
The limitations of this pattern are similar to those of the bullish engulfing pattern. Since the body of the second bearish candlestick can be large, if traders set the stop-loss at the low of the second bearish candlestick, the risk may be high. Moreover, this pattern does not provide a clear profit target, so traders need to combine other tools or methods to set reasonable exit points.
⑫ White Three Soldiers Pattern
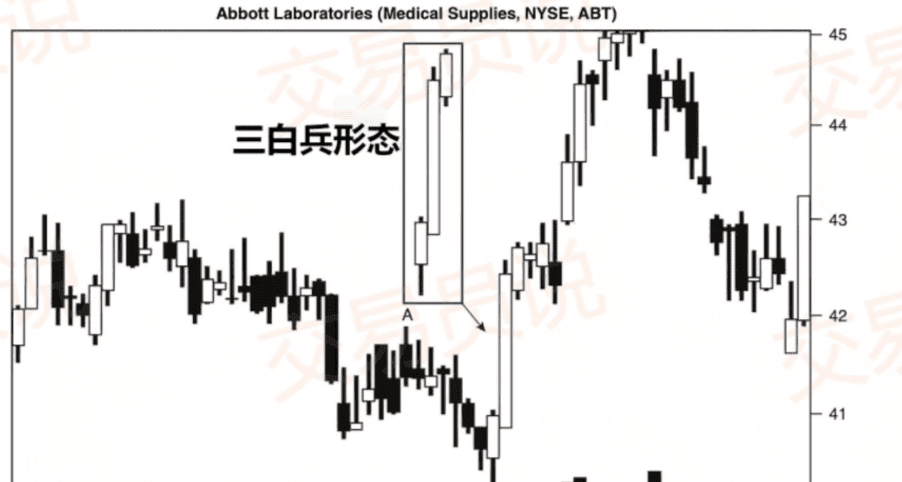
As shown in the figure above, the white three soldiers pattern (AWS) consists of three consecutive bullish candlesticks. Typically, when this pattern appears during a price decline or in a weak area near a support level, it indicates a significant rebound force is about to emerge.
Identifying the white three soldiers pattern is relatively straightforward; traders only need to observe consecutive bullish candlesticks closing higher over three days during a downward trend. To meet the AWS pattern, the opening price, high price, low price, and closing price of the second day must all be higher than those of the first day, and the same holds for the third day. This type of price movement is usually quite intense, serving as a strong signal of a reversal from a downward trend to a bullish trend.
When trading the AWS pattern, be aware that rapid price increases may lead the RSI indicator to show overbought signals. Remember that after a rapid rise, the price often undergoes a period of consolidation before continuing to rise. Therefore, traders entering based on the AWS pattern should be prepared for patience.
Like other patterns, the white three soldiers can also fail. Traders should confirm the validity of the pattern by combining it with other indicators such as moving averages and trend lines before entering.
Volume is a key indicator to focus on when trading the AWS pattern. If the volume is low during the formation of the pattern, it indicates that the upward trend lacks sufficient support, and the rebound may be difficult to sustain. In general, if the volume is low, remember the first trading rule: 'Exit if in doubt!'
If there is sufficient volume and other indicators support your judgment, it is still advisable to set a stop-loss when entering. For AWS patterns, many traders prefer to set the stop-loss at the lowest price of the second bullish candlestick. Although this stop-loss position is relatively lenient, it is beneficial for the smooth execution of the trade, as significant increases are often followed by slight pullbacks. Allowing for some stop-loss space is more favorable than setting it too tightly, which may lead to being stopped out due to a pullback, thus missing out on subsequent profitable movements.
Summary
Now that you understand the basics of the 12 main candlestick patterns, you may wonder how to better identify tradable patterns. In fact, I have many articles that introduce various patterns and how to trade them, and traders can also use some recognition tools to search for and find the patterns they wish to trade.
Ideally, traders should take the time the night before the trading day to analyze the chart patterns of planned trades, reference relevant indicators, and determine stop-loss and take-profit levels before entering. Always remember the third rule of trading: 'Plan ahead to avoid poor performance.'
Candlestick charts are one of the important tools for traders to analyze price trends. Through this guide, you will gain a deeper understanding of market movements and grasp the rules of price changes, thus understanding why candlestick charts are so popular in the trading field.
However, the most important point of this article is that although candlestick patterns can provide valuable references, they are not infallible. Even perfectly formed patterns can fail. Therefore, do not blindly trade any emerging patterns without verifying them through other indicators or chart tools.
Be sure to assess the risks and rewards in every trade, set stop-loss orders to guard against adverse price fluctuations, and make thorough trading plans before entering.