If your capital is within 500,000 and you want to achieve quick success in the cryptocurrency market through short-term trading, please read this post carefully. After reading, you will have a profound understanding of the essence of short-term trading!
I am 34 years old this year, have been in the market for 10 years, and have been trading cryptocurrencies for a living for 6 years!
Not choosing a financial major in college is a significant regret in my life. Starting from my freshman year, I began to learn about stocks, finance, foreign exchange, etc., online. The red and green screens filled my life with color and fascinated me. With unlimited anticipation for the market, I opened an account in my sophomore year, gradually learning about the cryptocurrency sector and Bitcoin through an introduction from a classmate. I became increasingly interested and began my investment career.
Like most friends who have recently entered the market, I was initially fascinated by technical indicators and continuously used cryptocurrencies for backtesting to find规律; I was eager to enter low-priced coins or coins that had undergone significant pullbacks, believing they were safer. In fact, these perceptions of the market are entirely wrong.
Only later did I understand that if you want to gain profits quickly in the market, you must trade short. Combine medium and long-term compounding together!
The conclusion is: do not let the blood of profit cloud your judgment; you must understand that the most difficult thing in the world is how to sustain profit. You must conduct thorough reviews to determine whether it is luck or skill; a stable trading system that suits you is the way to sustainable profits.
There is a saying that left a deep impression on me: if you do not occupy the ideological space, others will.
Today, I share with you the trading mindset that has allowed me to stand firm in the market for a long time. If you study it seriously, you will gain a lot, and your understanding of trading will undergo a dramatic change!
How to manage positions in different market conditions? Self-made position ratio (with illustrations)
I believe many people encounter the problem of not grasping the cycle well when trading.
For example, I am used to trading on the one-hour chart, but when there is no profit space on the one-hour chart, I want to look for opportunities on the five-minute chart. When jumping from a larger time frame to a smaller one, I still tend to place orders according to the previous position size, which can lead to problems: making small profits and large losses. Additionally, I will not control my position size and do not know how much to allocate each time.
Today, we will learn how to calculate position size and how to use and obtain the free calculator.
1. The conversion of trading cycles easily leads to small profits and large losses.
Why is the risk-reward ratio unchanged, yet we earn less on the five-minute chart than on the one-hour chart?
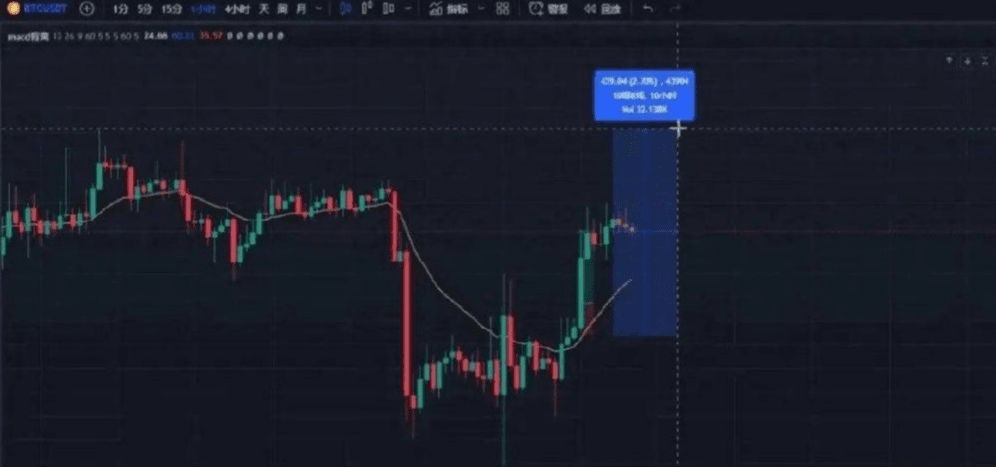
In the one-hour chart, we can eat about 400 points with a 1:2 risk-reward ratio, but on the five-minute chart in Figure 2.
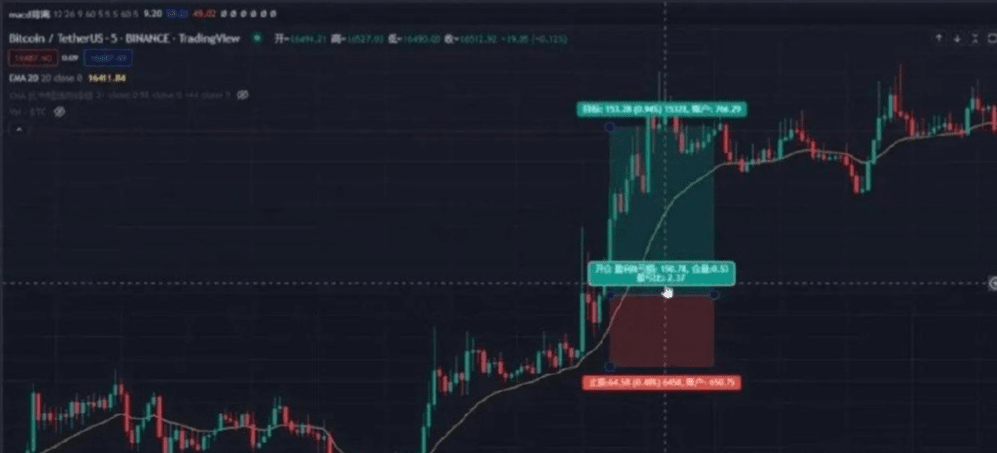
We can only gain 153 points. Under the same position size, the money earned on the five-minute chart and the one-hour chart is different. If it transitions from one-hour to five-minute, it will lead to small profits and large losses.
2. Position management
Many people know nothing about position management except for the risk-reward ratio. For example, going long at the position in Figure 3, the risk-reward ratio is 2.41. Apart from using tools from TradingView to obtain this ratio, there is no way to start.
Some people fully leverage their position every time they trade, using all the money in their account. They cannot clearly identify how much position they should take each time, nor do they know how many times of leverage to open. They may not even know what is loss-based position sizing.
To make it convenient to use, I made a calculator myself.
Regarding how to obtain and use this calculator, we will explain later.
In fact, what we make in trading is based on volatility points. If we are trading low-leverage contracts on a daily chart, if we do not control our positions well, it can lead to many losses.
The position sizes for trades on the daily chart and the one-hour chart are different. Let’s compare. Assuming I am willing to lose a maximum of 1000 USD each time.
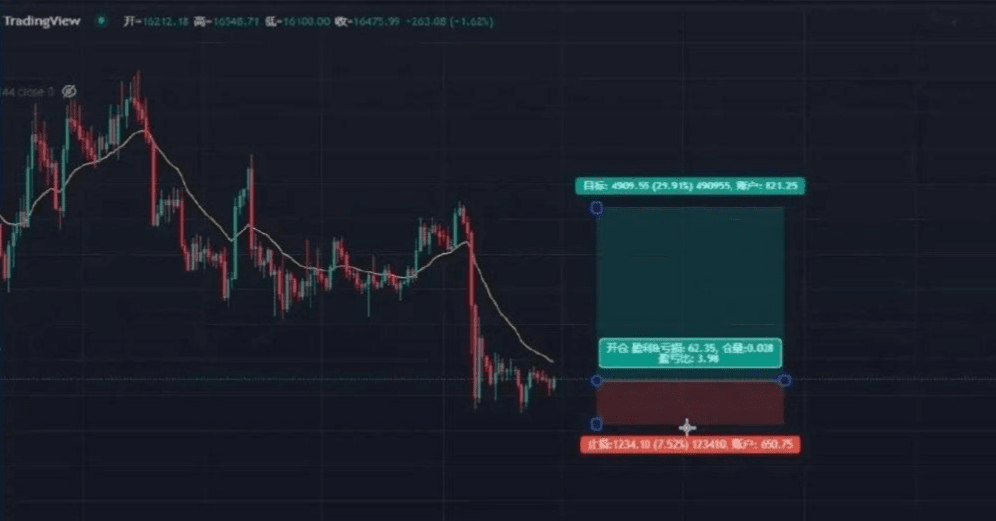
Daily chart:
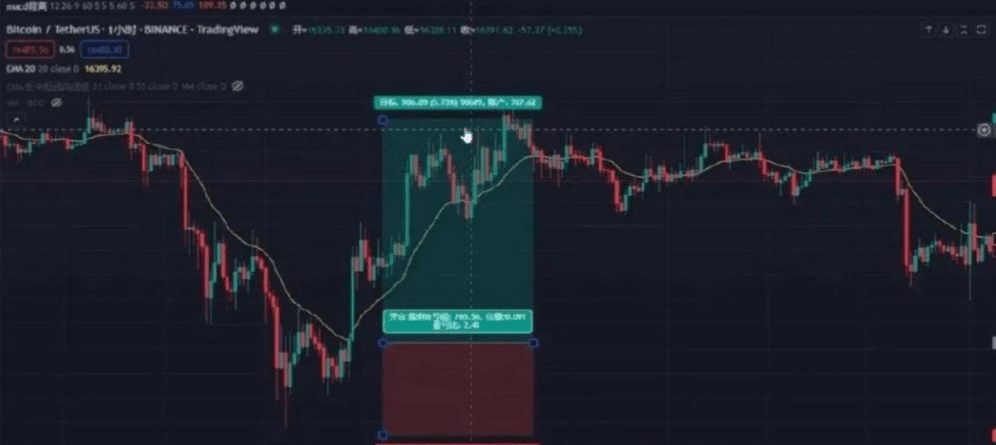
As shown in Figure 5, the stop loss percentage on the daily chart is 7.52%, while the take profit is nearly 30%.
One-hour chart: The risk-reward ratio is set at 1:2 in the one-hour chart shown in Figure 6.
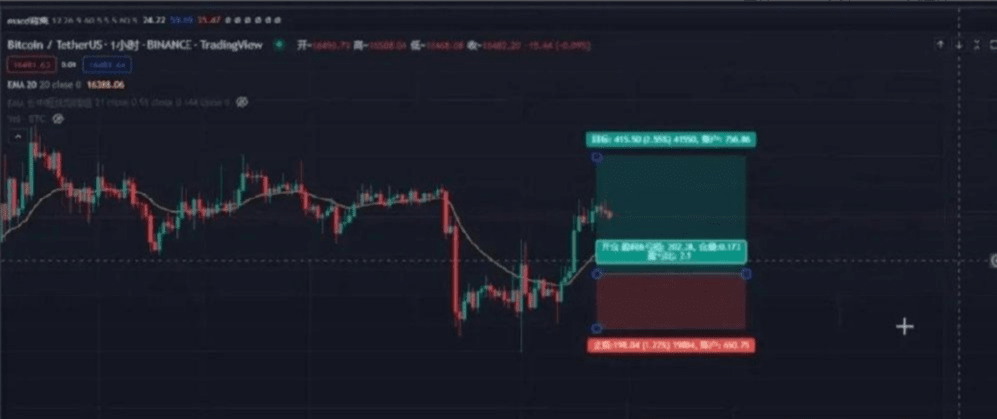
The stop loss percentage at this time is 1.22%, and take profit is only needed to rise to 2.55% for this trade to take profit.
Five-minute chart:
Under the same conditions, my risk-reward ratio on the five-minute chart would look like that in Figure 7.
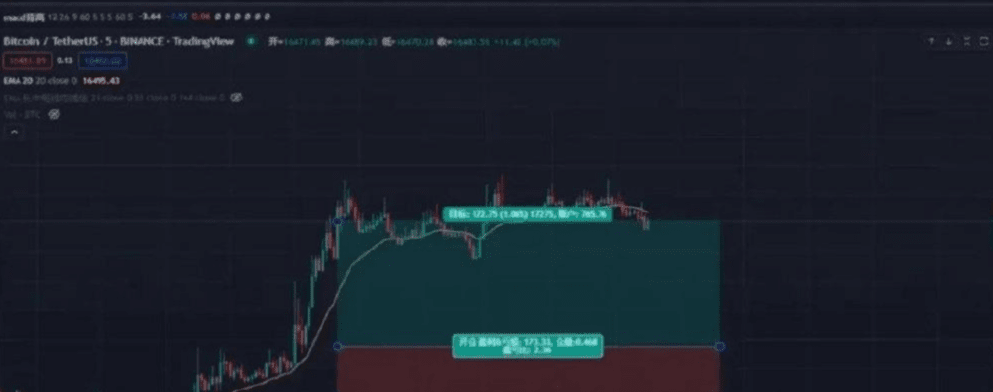
The stop loss is only 0.45%, while the take profit is 1.06%.
So, after comparing these three cycles, do you still think you can open the same position in different cycles? Of course not. Because we profit from volatility. The risk-reward ratio is the same for each cycle, but the size of the volatility is different. Therefore, under the condition of expected losses and gains being the same, our position should be inversely proportional to the volatility.
3. Use and explanation of the calculator
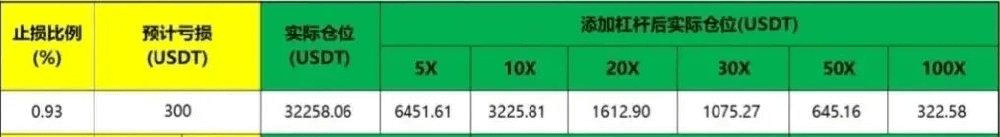
To facilitate use, I created a calculator for calculating position size, which you can use first when entering the market, as shown in Figure 8.
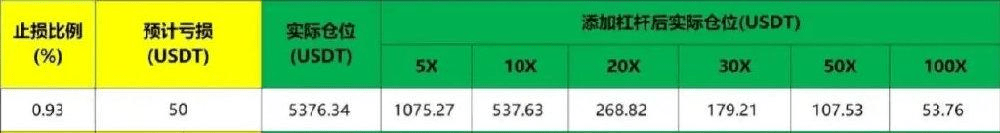
All trades should first consider how much to prepare to lose. The 'expected loss' in the calculator represents the risk control ratio, and the position risk adopts a fixed percentage model.
In the calculator, you only need to fill in the numbers corresponding to the yellow boxes; the other numbers will be automatically calculated as you input the numbers. Do not manually change any numbers other than those corresponding to the yellow boxes.
For example, if my account has 1000 USD and I am only willing to lose 5%, it would take me 20 consecutive losses to lose all my money. Therefore, multiplying the risk ratio by the current account balance (5% * 1000) gives the value that should be filled in the 'expected loss' section (50).
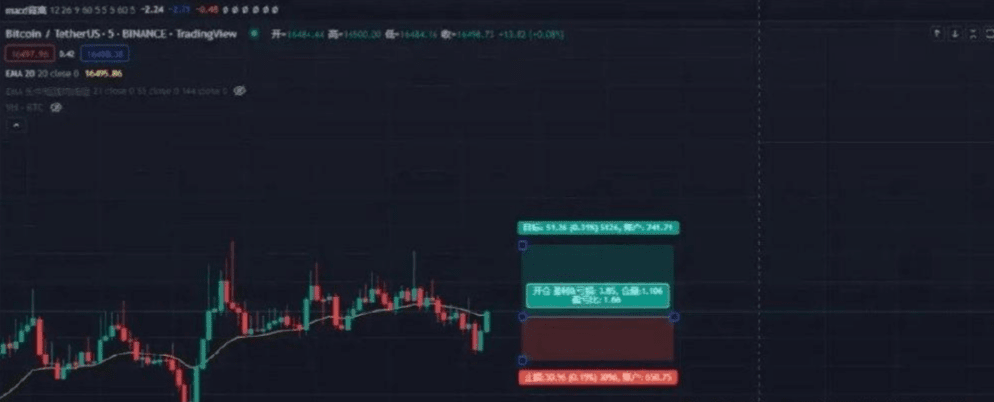
Let's take the five-minute chart in Figure 9 as an example. Now we want to enter the market at the current price.
As shown in the figure, the stop loss ratio is 0.19, take profit 0.31, and the risk-reward ratio is 1.66. From the risk-reward ratio perspective, this trade is feasible.
Fill in the stop loss ratio as 0.19, and the expected loss as 50, so you can calculate that the actual position needs to be opened at 26315 USD, which corresponds to the 'actual position' number. If making a contract, you need to leverage, so you will refer to the later data on how much leverage to use. However, my advice is still to use low leverage.
So how much can we earn? Fill in the corresponding opening price as 16494 and the latest price as 16546.
That is to say, when the market rises to 51.26 (Figure 9), the expected profit from this trade is 82.96 USD. Shorting is the opposite. Subtracting the later fees gives the final actual profit.
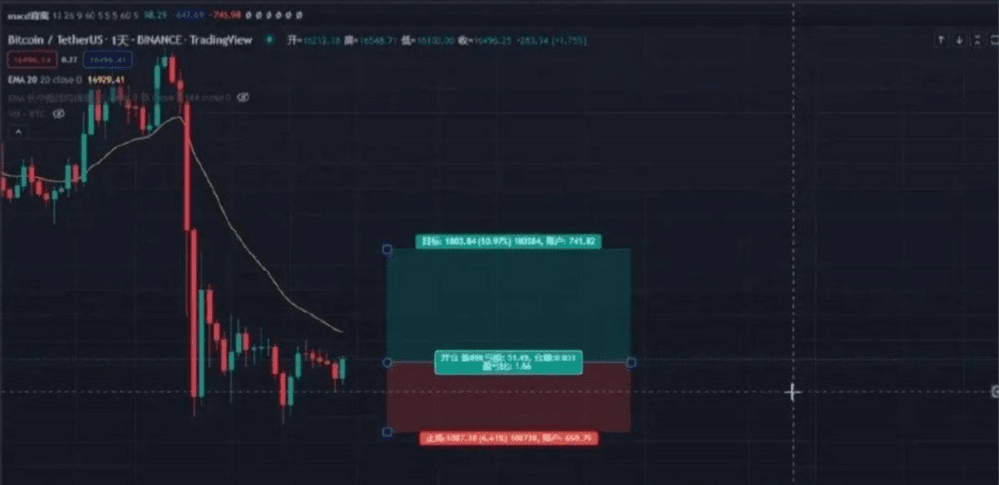
Daily chart:
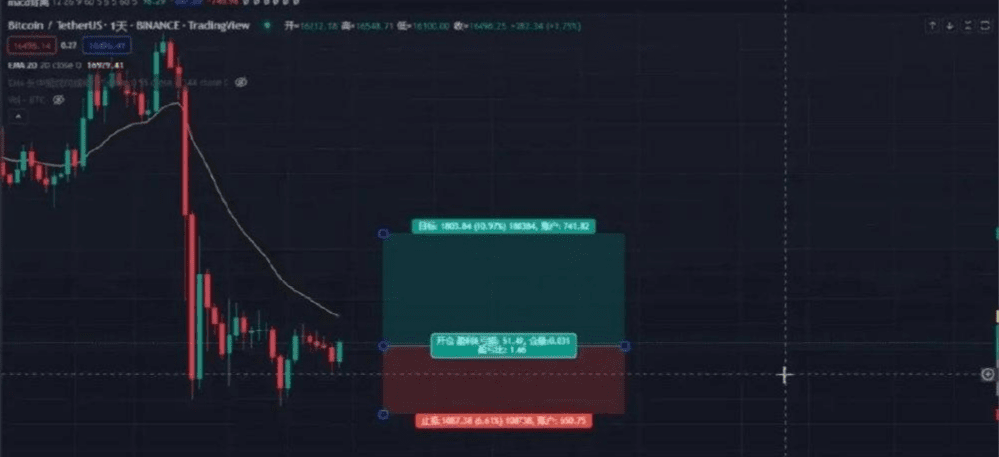
Fill in the stop loss ratio as 6.61, the opening price as 16444, and the latest price (take profit price) as 18254, resulting in the figure shown in Figure 13.
No matter which cycle we trade in, as long as we control our positions well, we can ensure the same profit and loss. Especially for beginners, do not complicate the position; using this calculator is sufficient.
Of course, this calculator is designed for my own convenience and does not account for the issue of adding to positions. Our old calculator can calculate the addition of positions.
Price action analysis - Trading within trading ranges (with illustrations)
If you frequently trade short, you will inevitably deal with trading ranges. Today, we will analyze each candlestick step by step to learn how to trade within a trading range.
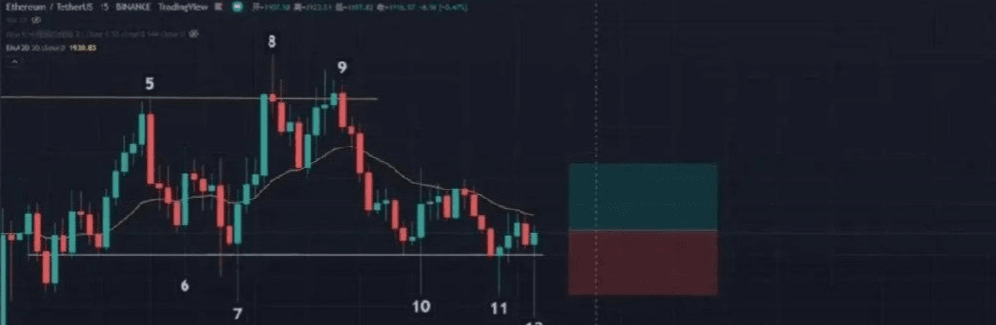
Let’s take Ethereum’s 15-minute chart as an example. The first thing to do is to look at the overall trend pattern of the market, as shown in Figure 1.
Figure 1
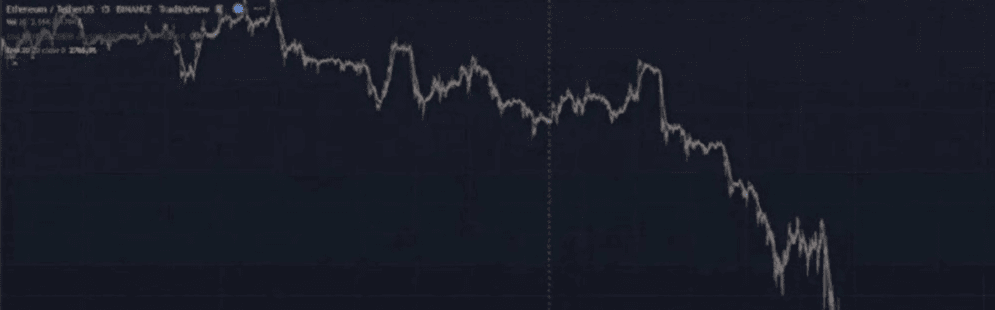
We can see that the overall market is in a downtrend and is in a big bearish trend, having just experienced a rapid decline. Next, we look at Figure 2.
Figure 2
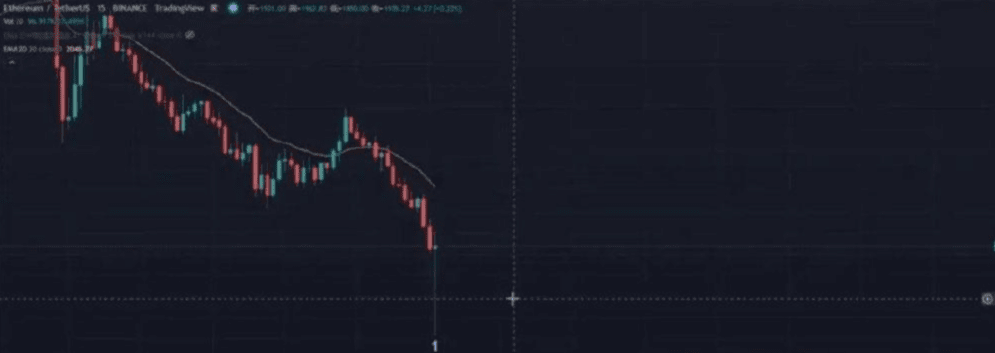
From Figure 2, we can see that the recently emerged 1st candlestick is a volume cross star. A cross star appearing during a downtrend does not indicate much, but if it is a volume cross star, it may indicate a potential reversal (volume-price analysis knowledge point). From the perspective of volume-price analysis, the 1st candlestick is a stopping action.
At this moment, we need to pay special attention; it does not mean a reversal will appear immediately, nor can we immediately 'go all in' upon seeing the 1st candlestick. It is at this moment that we need to closely observe the market; this bearish momentum may be pausing.
Next, let’s look at the 2nd candlestick in Figure 3. The 2nd candlestick is still a cross star with a long upper shadow; can it be counted as higher 1?
Figure 3
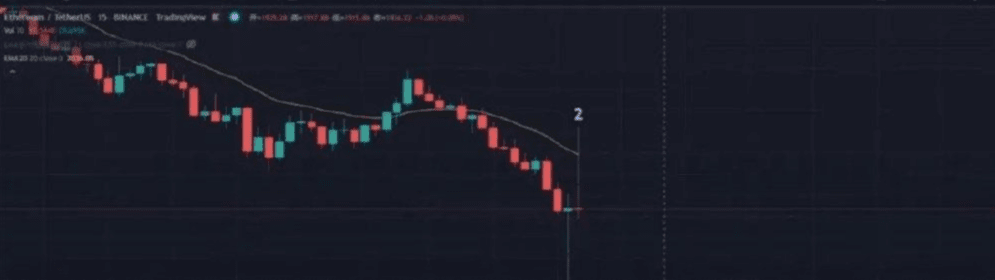
The 1st candlestick is a bullish signal candlestick, and the 2nd candlestick is indeed higher 1 because the high point has broken through. However, the 2nd candlestick is a non-trending candlestick, not a bullish trend candlestick.
A bullish signal candlestick must be followed by bullish trend candlesticks, so the 2nd candlestick is an invalid higher 1. According to price action, the 2nd candlestick is not a good entry candlestick, so we will not enter and will continue to wait.
Next, we look at the 3rd candlestick in Figure 4.
Figure 4
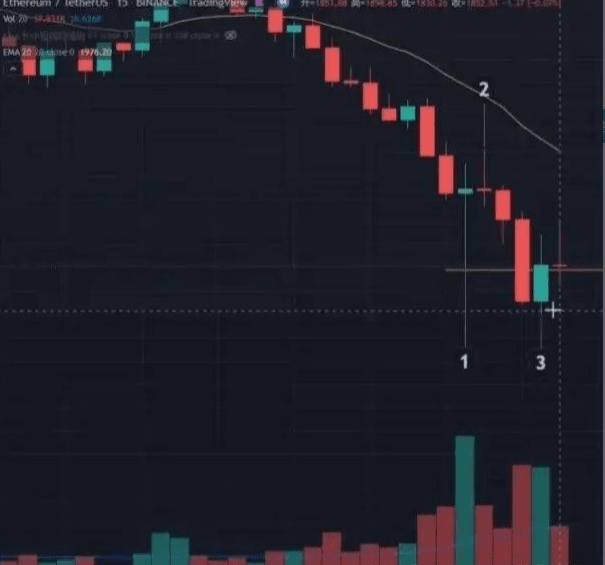
The candlestick after the 3rd candlestick also formed a high point breakout, but it is not an entry candlestick and is also invalid. Moreover, the 3rd candlestick and the previous one do not form a bullish candlestick.
Next, the 4th candlestick appears in Figure 5. The 4th candlestick is a strong bullish trend candlestick, engulfing the previous three bearish trend candlesticks and almost breaking through the highest point just rebounded from before. Thus, this 4th candlestick is both a signal candlestick and an entry candlestick.
Figure 5
First, the 4th candlestick and the previous candlestick form a bullish engulfing pattern, and the high point of the 4th candlestick breaks through the high point of the previous candlestick from a distance. Therefore, the 4th candlestick is both a signal candlestick and an entry candlestick.
If we only regard it as a signal candlestick, it is safer to wait for another bullish trend candlestick to act as the entry candlestick.
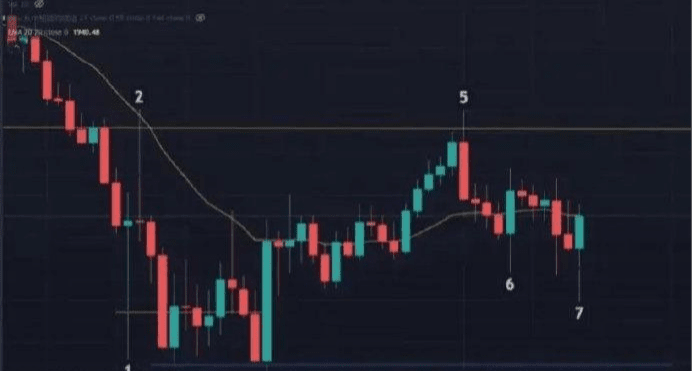
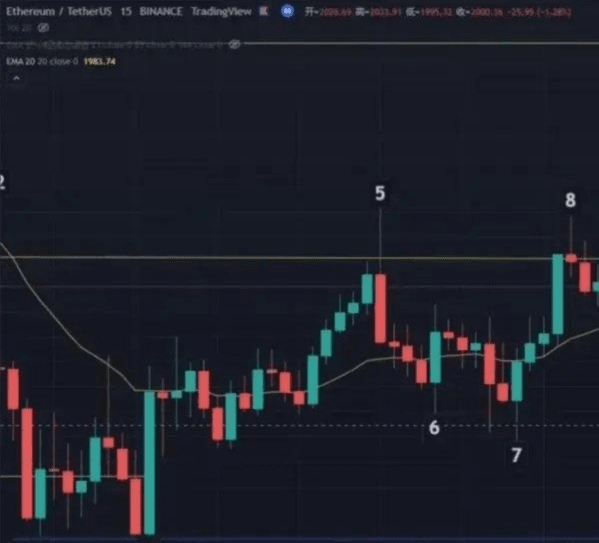
Next, we look at the 5th candlestick in Figure 6. Why does such a large bearish candlestick appear at position 5?
Figure 6
Because the yellow line in the figure has consensus, smart money knows that taking profits is at this position, so it is very important to take profits in the short term; we are following the footsteps of smart money. Therefore, the 5th candlestick is the first short signal.
However, according to my own trading habits, I would not enter here. I would wait for the second signal to appear.
Next, we look at Figure 7. Is the cross star behind the 5th candlestick low 1? Is it the entry candlestick we expect?
Figure 7
Using naked candlestick knowledge to interpret, it indicates that the bears are continuing to exert force and have broken the low point of the previous bearish trend candlestick (the 5th candlestick), attempting to extend the bear's power. However, it halted after this one candlestick. Therefore, it is not a good entry candlestick; it is not a bearish trend candlestick.
Next, we look at the 6th candlestick in Figure 8. After the appearance of the 6th candlestick, can we consider the decline from the 5th to the 6th candlestick as a simple pullback from the 4th to the 5th candlestick?
Figure 8
Yes, but caution is needed.
The 6th signal candlestick is very long, so we either wait for a good entry candlestick or place a limit order. The take profit can only see the previous high point, and there is no space above; the take profit can only see the high point of the 5th candlestick. We can only see the next take profit line after it strongly breaks through the 5th candlestick.
Next, let’s look at the 7th candlestick in Figure 9.
Figure 9
Now, the decline from the 5th candlestick to the 7th is a two-part adjustment that creates lower lows. So can we consider it a complex pullback from the 4th candlestick to the 5th? See Figure 10.
Figure 10
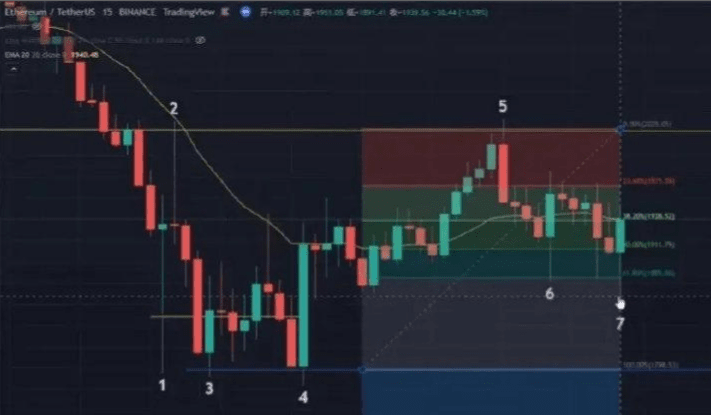
The 7th candlestick is a short-term one and has not exceeded 61.8%, so it can be regarded as a complex pullback. Next, let’s look at Figure 11.
Figure 11
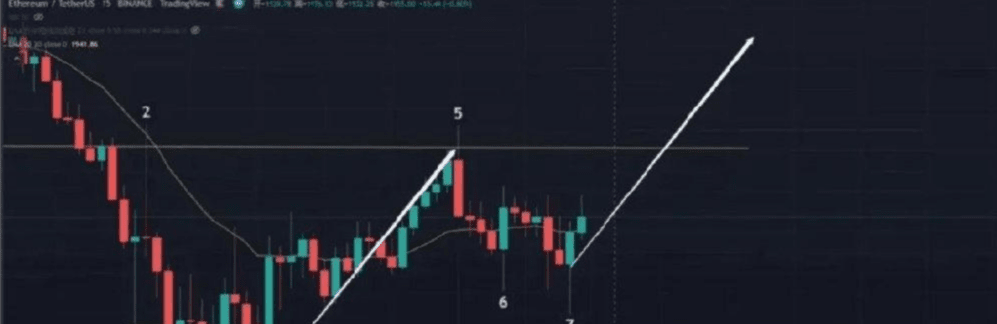
The 7th candlestick plus the following candlestick tells us that this complex pullback has ended, and the entire trend 2.0 is about to start. Ideally, it should follow an equidistant path.
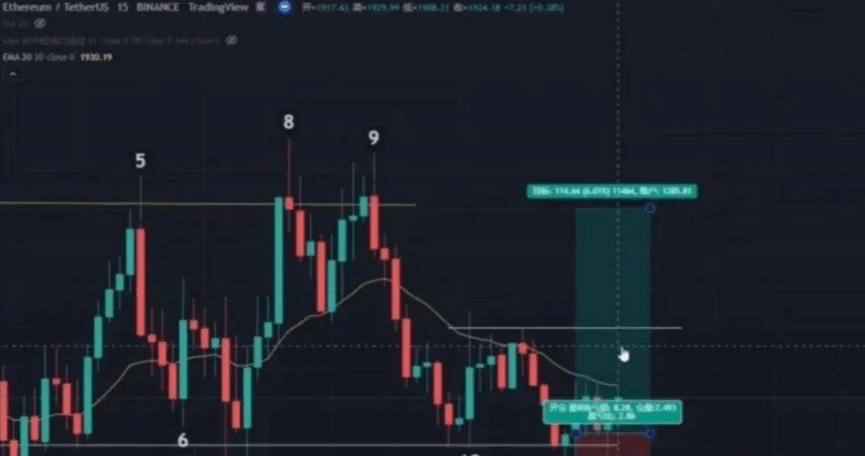
Next, let's look at the 8th candlestick in Figure 12. The rise from the 7th candlestick to the 8th candlestick is the 2.0 era of the trend from the 4th to the 5th candlestick. But has this 2.0 era failed?
Figure 12
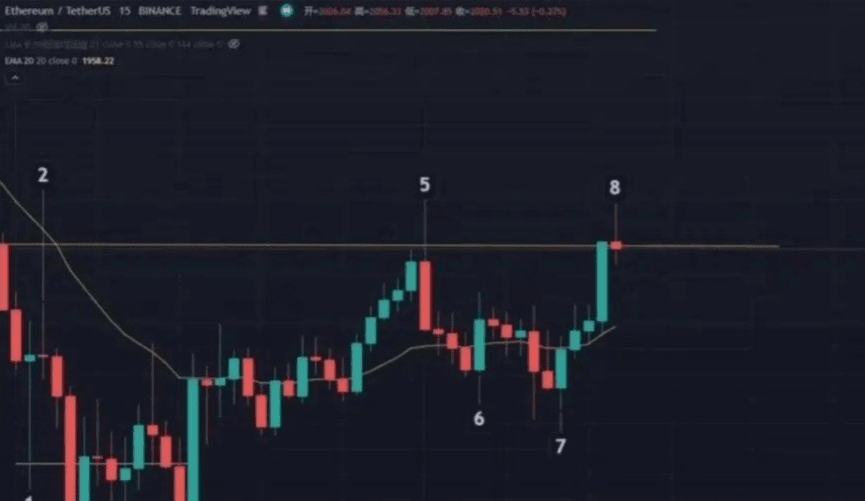
Actually, it is too early to say so. But we can make a preliminary conclusion that it may have failed, and we need to wait for verification.
Still, the smart money knows when to take profits at the position to take profits; this will certainly bring a wave of supply force, and it is inherently a big bearish trend.
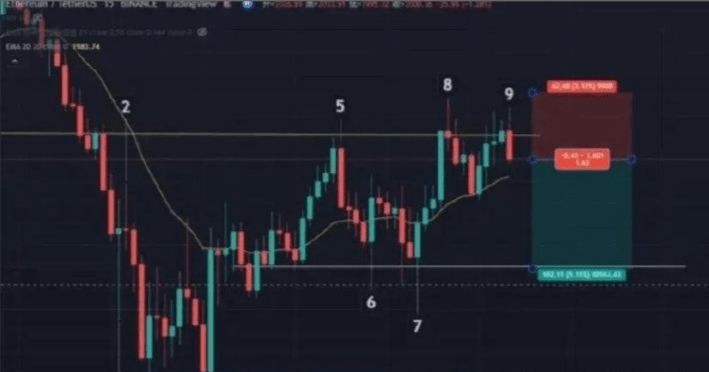
When we see the 9th candlestick in Figure 13, is it not certain that this trend 2.0 has failed?
Figure 13
Indeed, it has been confirmed to have failed. In the segment from the 8th to the 9th candlestick, the 8th candlestick is the first short signal, and the 9th candlestick is the second short signal.
If you favor right-side trading, it is more prudent to wait for another bearish trend candlestick; if you lean towards left-side trading, you can enter the market at the current price.
Logically, the 9th candlestick is both a bearish signal candlestick and a bearish entry candlestick.
If we are going short now, the stop loss and take profit should be placed at the position shown in Figure 14.
Figure 14
Next, we look at the 10th candlestick in Figure 15. The 10th candlestick is, likewise, the first signal for going long.
Figure 15
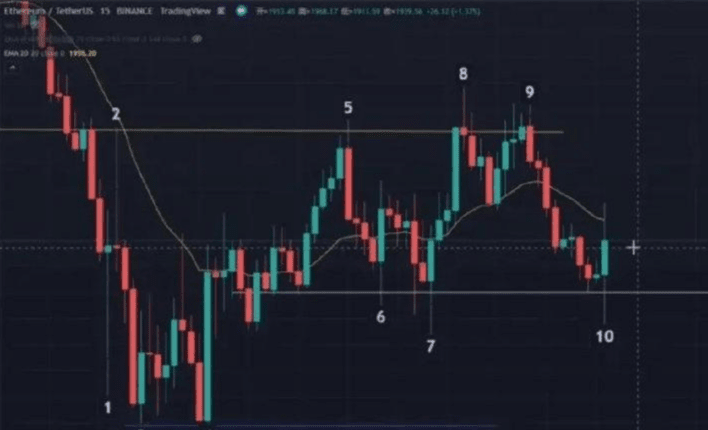
Either place a limit order to enter the market or wait for another good entry candlestick.
Next, let's look at the 11th candlestick in Figure 16. At the 11th candlestick, a very good Pinbar was formed, which is a bullish signal candlestick that made a false breakout of the 10th candlestick. If we close a higher 2 now, can we enter? (Because a bullish signal candlestick appears for the second time, so it is a higher 2.)
Figure 16
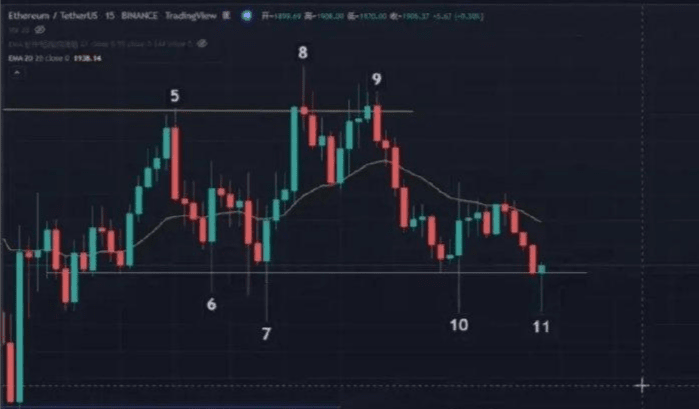
Similarly, left-side traders can enter the market now, while right-side traders wait for the appearance of higher 1. However, higher 1 does not have a risk-reward ratio; both cannot be obtained, so it is up to one’s choice.
So, does the 12th candlestick in Figure 17 count as a new bullish signal candlestick?
Figure 17
Both the 10th and 11th candlesticks are bullish signal candlesticks. The 10th candlestick is the morning star of the 12 golden candlesticks, and the 11th candlestick is the hammer line of the Pinbar. The 12th candlestick is also at the white key point, and a new trading range has taken shape.
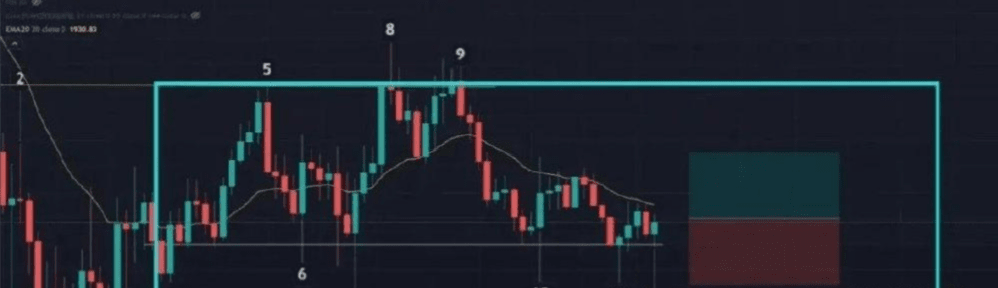
The original trading range is the upper and lower bands, as shown in Figure 18.
Figure 18
Now, a new trading range has been created at the mid-band, as shown in Figure 19.
Figure 19
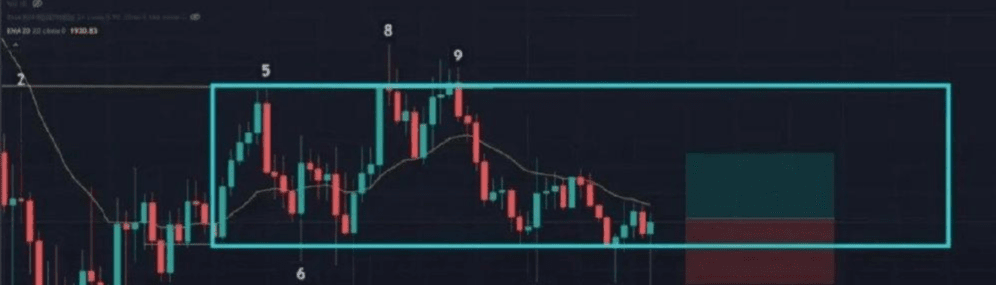
Then we can only treat it according to the new trading range.
The 11th and 12th candlesticks in the small cycle of Figure 20 form a wave.
Figure 20
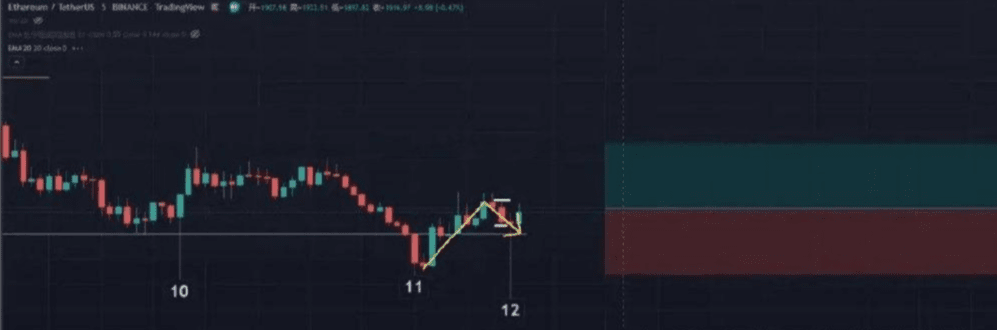
It has formed lower lows and lower highs. So we can count again.
Assuming we enter long at the position of the Pinbar at the 11th candlestick, our take profit should be placed at the position shown in Figure 21.
Figure 21
Of course, wherever it is placed has its own basis, but placing it here has a very good risk-reward ratio, and combined, it has a mathematical advantage.
We look at Figure 22. When the market reaches the position of the white line, supply appears, and many people take profits and exit. However, the demand side continues to exert force, raising the price again. The bulls keep pushing, and from the price action perspective, the three candlesticks in Figure 22 represent a simple pullback, or an FB structure.
Figure 22
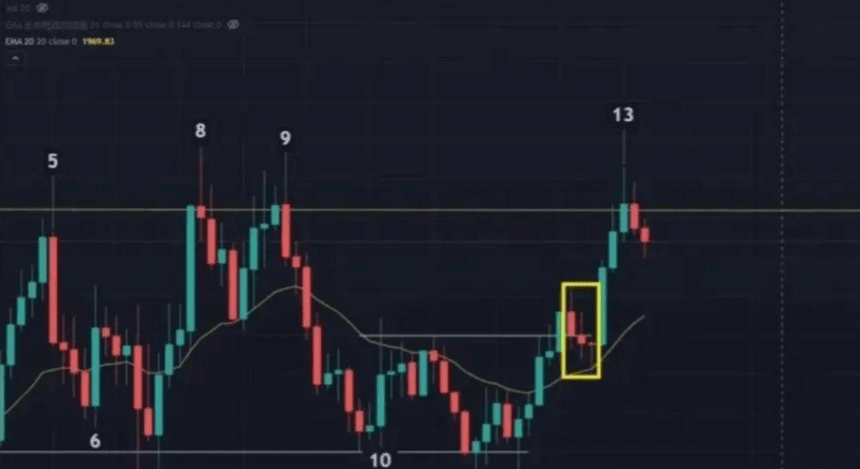
Currently, the market has reached a critical resistance level at the previous high. The 13th candlestick is the first short signal.
To be prudent, in the first opportunity, we do not enter the market but wait for the second entry opportunity, going in when we see a small double bottom or a small double top.
Next, when the market reaches Figure 23, the 14th candlestick appears, which is another bearish signal candlestick.
Figure 23
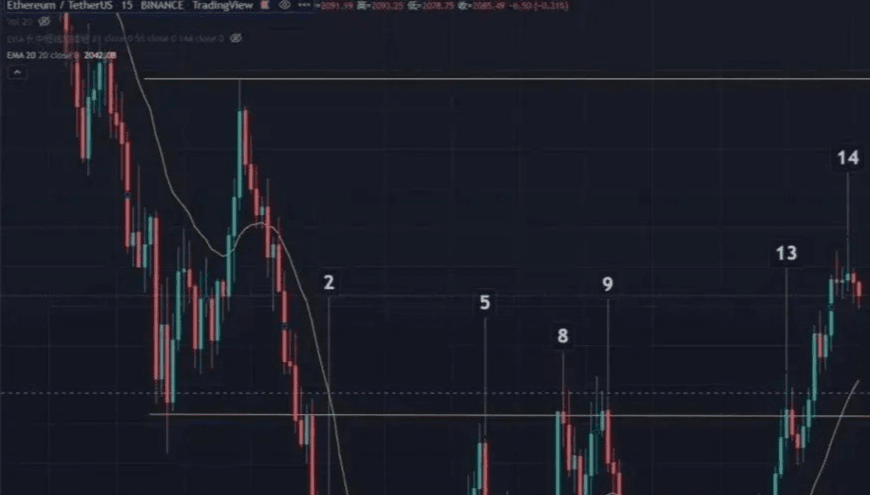
Later, there indeed occurred low 1 or low 2, but it is not a very good bearish trend candlestick. Furthermore, a real breakout has occurred, breaking through the pressure level of the 1st yellow line, so we need to find the next pressure level, which is the upper 2nd yellow line.
After the appearance of the 15th candlestick in Figure 24, it forms a dusk star with the previous one, providing a second opportunity to short.
Figure 24
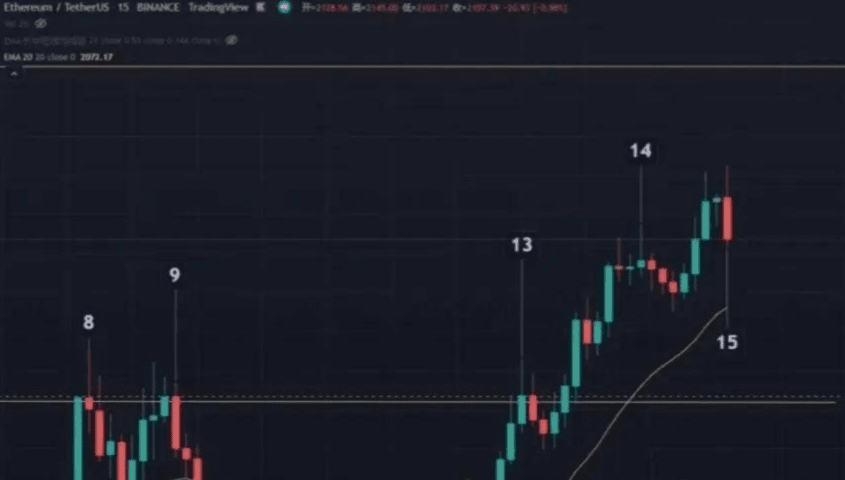
If a bearish trend candlestick forms after the 15th candlestick, we can confirm that the previous position was a true breakout, but the 15th candlestick is a false breakout of the 14th candlestick.
Then the 14th and 15th candlesticks can form a small double bottom, which is an entry opportunity. Therefore, our take profit should be placed at the previous low, which is the position of the previous 1st yellow line.
The 15th candlestick is also not the entry candlestick we expect; it is a non-trending candlestick.
In fact, the methods I use in candlestick-by-candlestick analysis are all content we have learned. The purpose is not to have everyone trade exactly as I describe but to understand why I analyze this way and to learn analytical thinking and techniques.
Today, the article mentions a lot about (left-side trading and right-side trading), (simple pullback and complex pullback), (small double bottom and small double top), (volume-price analysis – volume cross star), (12 golden candlesticks – morning star). To learn trading techniques, it requires not only a lot of practical experience but also reading books to find your own trading path. I hope everyone can simplify complex issues.
In trading, after strictly implementing stop losses, how to deal with the problem of frequent stop losses?
The so-called 'Strict Entry, Loose Exit' simply means strict buying and loose selling.
➤ Buying must be 'strictly entered'
When opening a position, it must comply with our trading system's entry rules, including trading direction, entry signal, entry stop loss, and take profit target. Try to ensure that the entry is well-founded, detailed, and strictly executed.
➤ Selling must be 'loosely executed'
Once the price leaves the entry cost area and has a certain profit space, the selling conditions do not need to be too harsh, leaving space for normal price fluctuations. As long as there are no obvious reversal trends, there is no need to panic and exit.
'Strict Entry, Loose Exit' has two principles.
First principle: Try to protect our principal from damage as much as possible.
Errors in judging the direction of the trend, not entering according to signals, setting the stop loss too small or too large, and frequent trading that does not follow entry rules can all easily lead to our trading failure, resulting in capital loss. Therefore, we should try to preserve the capital as much as possible before discussing profits.
Second principle: Hold on to profitable trades as much as possible and let profits run.
The trend operates in a wave-like manner, and price fluctuations need to breathe. Therefore, our stop loss does not need to be too tight; otherwise, it is easy to be scared off by pullbacks or stopped out, potentially missing trending markets.
'Strict Entry, Loose Exit' is mainly distinguished by the stop loss settings. Next, we will discuss the stop loss techniques of 'Strict Entry, Loose Exit.'
First, we divide 'Strict Entry, Loose Exit' into two phases:
Phase one: The 'Strict Entry' phase.
Phase two: The 'Loose Exit' phase.
'Strict Entry' phase is our entry phase, where the stop loss setting requires strictness. The 'Loose Exit' phase is where we track trends and exit, and the stop loss setting will be much looser.
In these two phases, there are four commonly used stop loss settings:
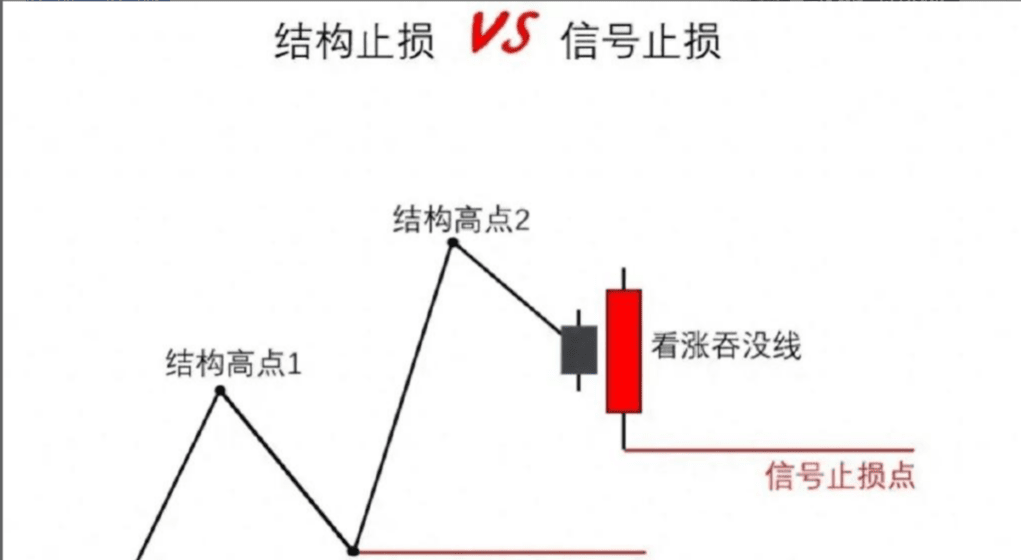
1. Signal stop loss
2. Structural stop loss
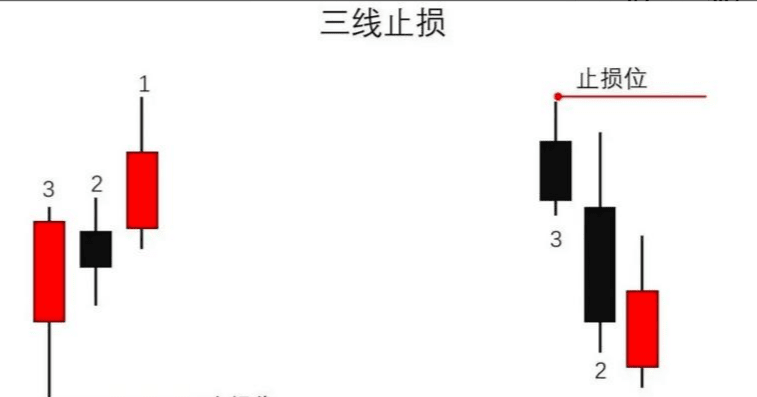
3. Three-line stop loss
4. Break-even stop loss
Signal stop loss is based on the candlestick pattern of the trading signal.
Structural stop loss, using the important key nodes of price trend structure as stop loss points. These structural points are generally significant swing lows and highs within the trend.
Three-line stop loss uses the latest closing of three candlesticks, choosing the lowest price of the three candlesticks as the long stop loss or the highest price as the short stop loss.
Since the trend structure is more significant than the candlestick pattern, structural stop loss should be more reliable than signal stop loss and three-line stop loss. Therefore, generally, it is advisable to choose structural stop loss as our primary entry stop loss.
Break-even stop loss, which means moving the stop loss line to our opening point so that the principal will not incur losses. This method of stop loss generally waits until the price leaves our cost area and has a certain profit space before choosing the operation skill.
Combining the characteristics of price trend movements, generally, in the latest price movements, candlestick patterns lead structural trends. Therefore, in the 'Strict Entry' phase, we can generally adopt signal stop loss, three-line stop loss, and break-even stop loss. In the 'Loose Exit' phase, we mainly use structural point stop loss.
So the question arises: how to distinguish whether the current price trend is in the 'Strict Entry' phase or the 'Loose Exit' phase?
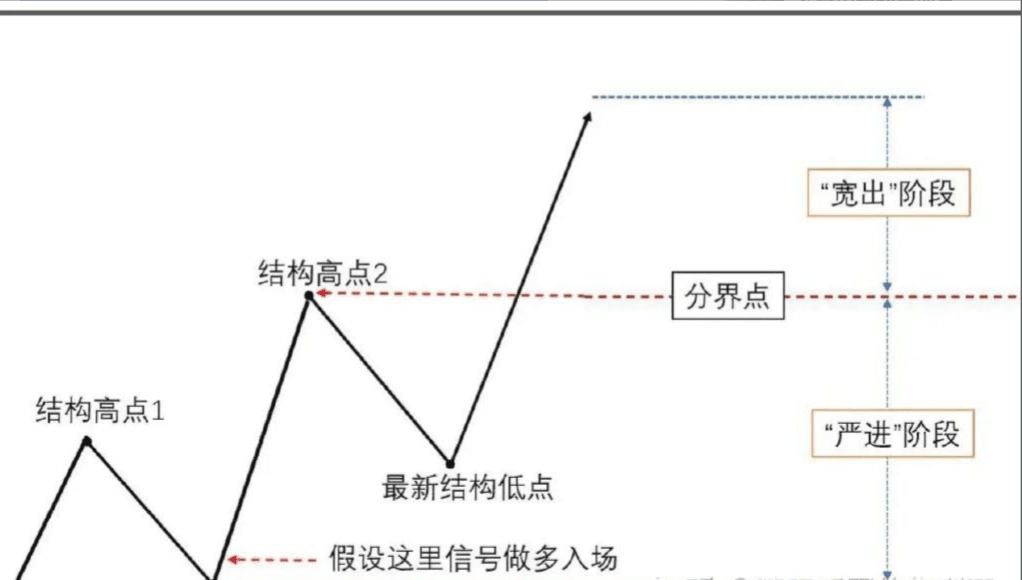
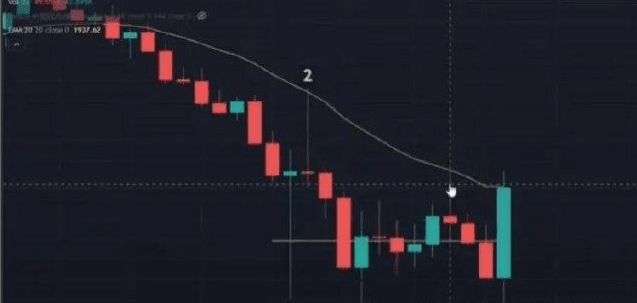
'Strict Entry' phase mainly refers to our entry stage. Assuming we are going long, we are still in the entry stage if the first latest structural low point has not formed after opening a position. Generally, when the price breaks through structural high point 2, the latest structural low point is established. The range from structural low point 1 to structural high point 2 in the figure belongs to the 'Strict Entry' phase, and the price breaking through structural high point 2 is categorized as the 'Loose Exit' phase; thus, structural high point 2 is a boundary point.
Next, we will deepen our understanding of the application of the stop loss technique of 'Strict Entry, Loose Exit' through case reviews.
The bullish engulfing line signal closes the market to go long. The entry stop loss can be chosen just below the signal's lowest point. Since structural low point 1 is relatively close to the signal, we can also choose below structural low point 1 as the best entry stop loss.
When the price reaches K3, it has already left our opening cost area and has a certain profit space. We will consider moving the stop loss to the opening point or using the three-line stop loss, moving the stop loss line below the lowest price of K1. This type of stop loss is relatively aggressive and may easily be stopped out, missing the trending market that exists later. However, during the 'Strict Entry' phase, our goal is to ensure that our capital is not damaged as much as possible.
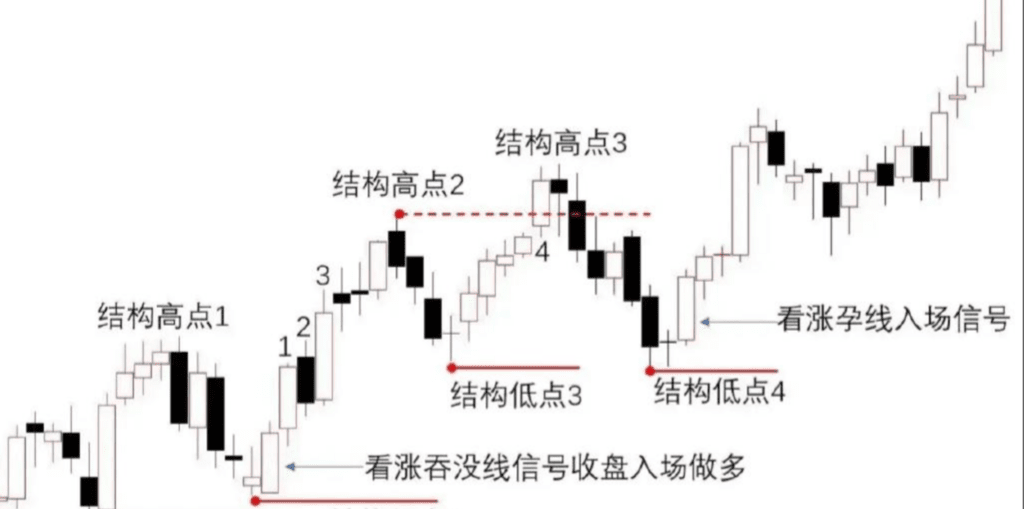
Structural high point 2 is the boundary point between the 'Strict Entry' phase and the 'Loose Exit' phase. When the price breaks through structural high point 2 and establishes structural low point 1, which is the first latest structural low point formed after entry, the price enters the 'Loose Exit' phase. We move the stop loss point to structural low point 3. Although the price has fallen from structural high point 3 just touching our stop loss point to exit, this is a normal price behavior, and there is no need to feel regret. Subsequently, the bullish engulfing line signal at structural low point 4 can re-enter.
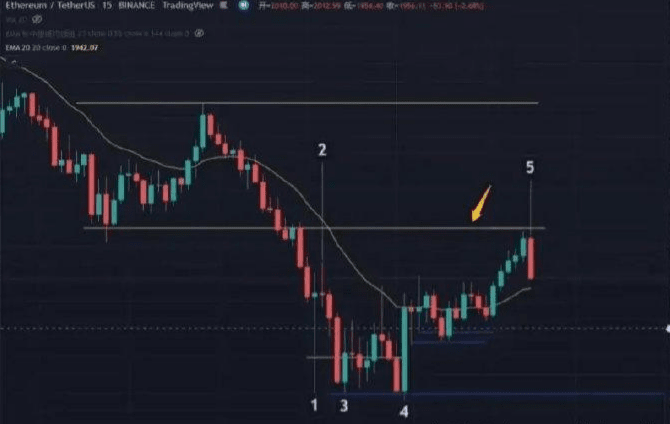
A bullish engulfing line signals a long entry. The entry stop loss is relatively close to the signal, so we use the relatively stable structural low point 1 as the entry stop loss.
When the price reaches K3, it has already left our entry cost area with a certain profit space. At this point, we can move the stop loss to the opening point for break-even or use the three-line stop loss method to move the stop loss to below the lowest price of K1. This way, we can ensure that the principal is not damaged and lock in some profit space.
When using the three-line stop loss method, it is important to note that if the latest three candlesticks are merely narrow small bearish, bullish, or doji candlesticks, there is no need to use these three candlesticks as stop loss, as they can easily be stopped out. Ideally, at least one of the three candlesticks should have a certain amplitude and trade direction opposite.
When structural high point 2 is broken, the first latest structural low point 3 is established after entry, and the price also enters the 'Loose Exit' phase we defined. At this time, we can move the stop loss to just below structural low point 3.
After moving the stop loss to structural low point 3, we preserve the principal and lock in part of the profit space. The future price movement is merely a matter of earning more or less, so there is no need for tight stop loss operations following price movements. Just track and observe price movements, judge whether the trend is reversing, and whether it is necessary to reduce positions and take profits.
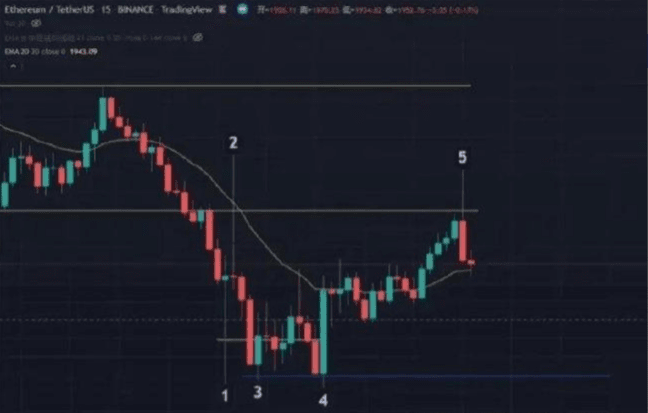
In the 'Loose Exit' phase, position reduction, profit-taking, and exiting mainly focus on key reversal structural points and strong reversal signals. In the loose exit phase, if we move the stop loss closely following the structural low points, it is easy to be stopped out because the closer it gets to high points or oscillation areas, the more likely the price is to falsely break the latest structural low points, causing us to be passively stopped out.
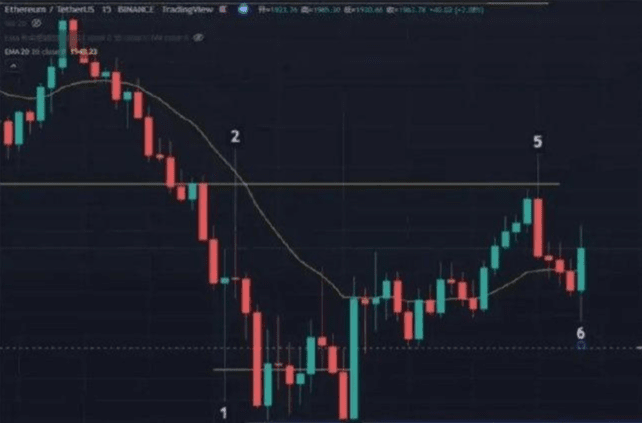
Returning to the gold case review, the high point 4 has not broken through high point 3, which may form a small M top. The key level of the neck line for low point 4 is considered a minor structural low due to the small range of movement. When the price breaks below low point 4, we can consider manually reducing our position or taking profits.
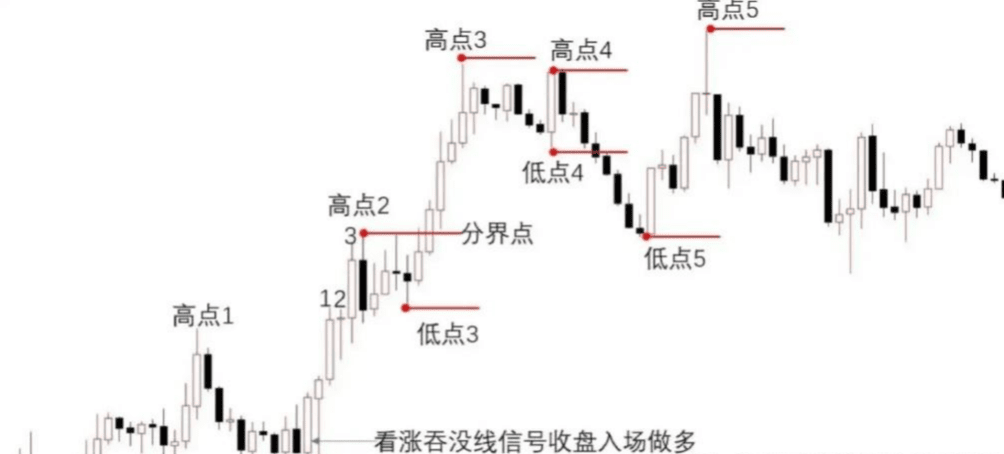
The price falls to low point 5, but it still has not touched our stop loss point low point 3, so if we still have a position, we can continue to observe the price movement. High point 5 tests the resistance levels of high point 3 and high point 4 but does not break through, only forming a long shadow hammer line, which is a strong bearish reversal signal; at this time, we see a signal to exit and take profits.
In conclusion, the trading philosophy of 'Strict Entry, Loose Exit' means that the stop loss used during the entry phase will be relatively aggressive, somewhat violating the normal price fluctuation rules, but the goal is to ensure the safety of the capital as much as possible. The stop loss strategy in the exit phase is actually a method that follows the normal price fluctuation rhythm, which can better capture the trend.
The 80/20 rule in the cryptocurrency market: how to become one of the few who make money?
In the cryptocurrency market, there is a well-known '80/20 rule'. This rule tells us that in any group of items, the most important part accounts for only a small portion, about 20%, while the remaining 80%, despite being the majority, is secondary. This rule is vividly reflected in the investment field: 20% of investors make money, while 80% lose money. So how can we become one of the 20% who profit in this turbulent cryptocurrency market?
First, you need to have a deep understanding of the market. The cryptocurrency market is unlike traditional investment areas; it has greater volatility and uncertainty, requiring investors to have a higher risk tolerance and sharper market insight. Before entering the market, you need to have an in-depth understanding of blockchain technology, the issuance mechanisms of digital currencies, market trends, etc. Only when you have a comprehensive understanding of the market can you remain calm amidst market fluctuations and make rational decisions.
Secondly, you need to have a unique investment strategy. The volatility of the cryptocurrency market offers huge opportunities for investors but also comes with significant risks. To become one of the few who make money, you need a unique investment strategy and cannot follow the crowd blindly or trust hearsay. You can develop a strategy suitable for yourself by observing market sentiment, analyzing project value, tracking capital flows, and so on. Remember, investment is a zero-sum game; only by being smarter and more perceptive than most can you stand out.
Furthermore, one must have a strong investment conviction. In the cryptocurrency market, investors often face various temptations and challenges, such as greed during a market surge and fear during a market crash. These emotions can often interfere with your investment decisions, leading to poor judgments. Therefore, you need to have a strong investment belief, trust your investment strategy, and not easily be swayed by market emotions.
Finally, you need to keep learning and accumulating experience. The cryptocurrency market is unpredictable, with new projects and technologies emerging constantly. To establish yourself in this market, you need to maintain a continuous learning attitude and constantly accumulate experience. You can do this by reading relevant books, participating in online courses, and keeping up with industry trends to improve your investment skills and cognitive level.
In short, if you want to become one of the few who make money in the cryptocurrency market, you need to deeply understand the market, develop a unique investment strategy, maintain a strong investment conviction, and continuously learn and accumulate experience. Only then can you stand invincible in the cryptocurrency market and become one of the 20% who profit.
However, it is also necessary to remind that investment has risks, and caution is needed when entering the market. While pursuing wealth, we must also remain rational and not blindly chase high returns while ignoring potential risks. After all, only stable investments can bring long-term profits.
Even the most diligent fisherman would not go out to sea in stormy weather but would focus on protecting his fishing boat. This season will pass, and a sunny day will surely come! Follow me for both fish and fishing techniques; the door to the cryptocurrency world is always open. Acting in accordance with the trend is the only way to have a life in harmony with the trend. Save it and remember it!
BTC ETH USDC
