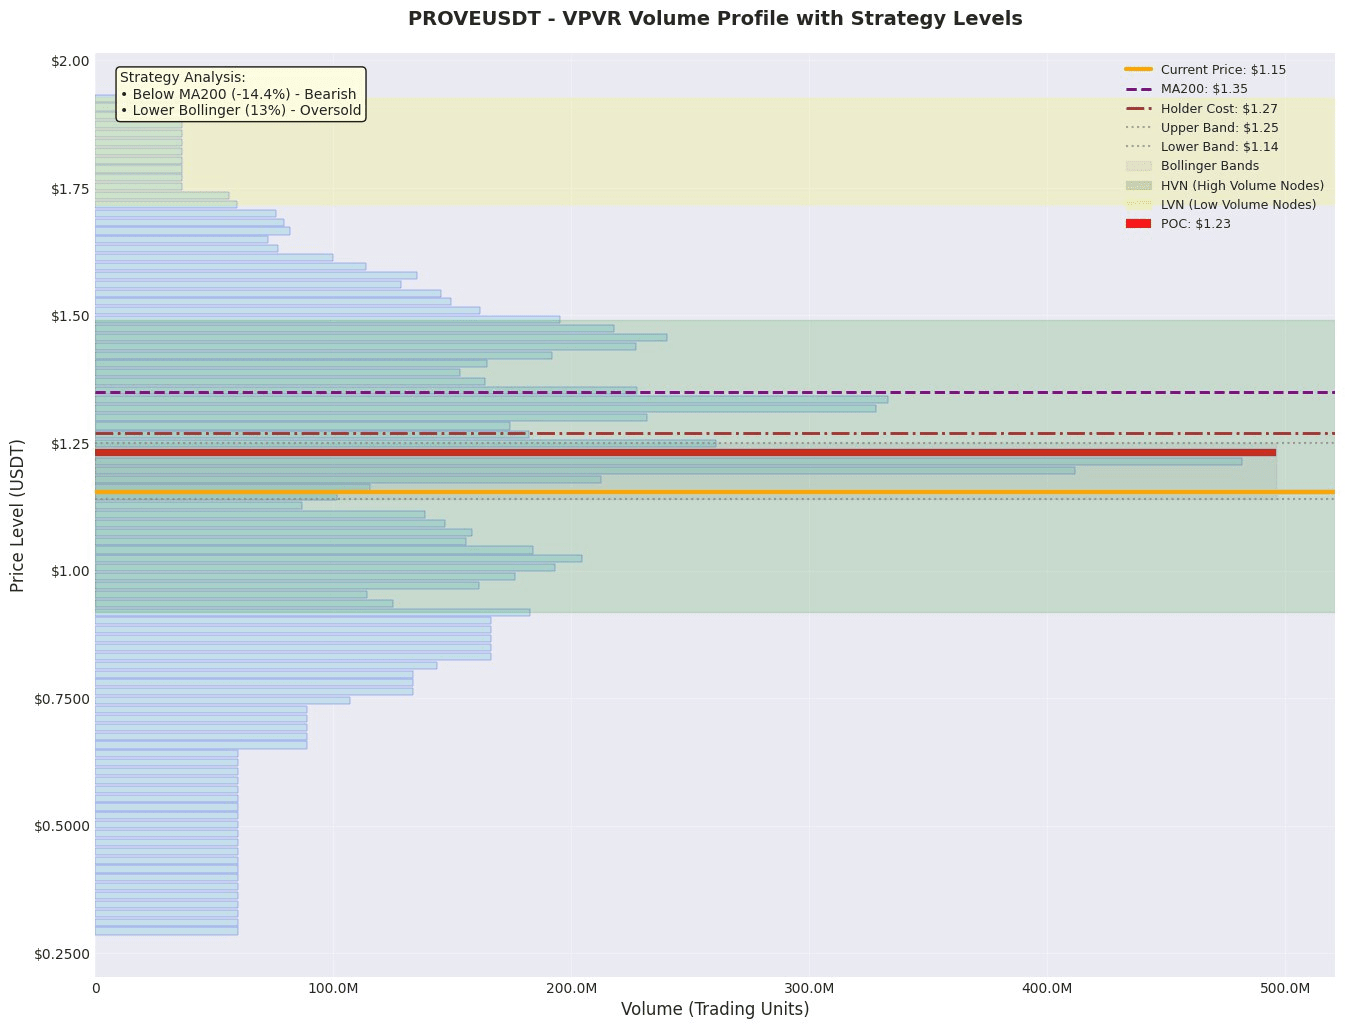
PROVE has collapsed 43% from the high of 2.02 in two weeks, currently priced at 1.155, which falls exactly between the lower band of the Bollinger Band and the lower bound of the 70% trading volume range. Short-term funds are quietly 'picking up the pieces,' but the huge wall of POC at 1.23 has not yet been breached, and whether it rebounds or continues to drop depends critically on the volume-price coordination.
[Key Interval Structure]
1. Value Anchor (POC): 1.231 (496M transactions), the most intense trading area for bulls and bears in the past two weeks; a breakout will confirm the phase bottom.
2. High Volume Node (HVN):
• 1.197~1.205 (412M) - A pullback that does not break can be seen as a bullish springboard;
• 1.335~1.344 (333M) - The first heavy resistance, also a take-profit reference.
3. Low Volume Node (LVN):
• 1.743~1.761 (36M) - A vacuum zone for short covering; if it breaks above 1.75 with volume, it will trigger a rapid short squeeze.
4. 70% Trading Volume Coverage Area: 0.762~1.579; the current price is at the lower bound 13% quantile, technically oversold.
[Momentum Verification]
• POC area Up/Down≈59:41, not yet absolutely bullish, but a net inflow of 79k contracts at the 15m level suggests short-term buying pressure is rising.
• The trading volume in the LVN area below 1.15 is only 36M, with thin short positions, favorable for a rapid rise.
[Auxiliary Indicators]
• MA200: 1.349, deviating -14.4%, still bearish on a larger scale;
• Bollinger Band 1h: The lower band at 1.140 has been reached, with the middle band at 1.195 acting as short-term resistance;
• Contract holdings decreased by 6.7% over 24h, funding rate -0.043%, short positions have not been significantly covered, beware of false bullish signals.
[Order Book Anomalies]
The buy orders on the order book exceed 19k USDT, but the distant sell walls at 1.84/1.95/2.09 total over 2.5 million USDT, limiting rebound potential.
[Market Cycle]
In the consolidation bottoming phase after the 'mid-bear market sharp decline,' if there are no macro negative signals, the 1.10~1.25 range may repeatedly test the bottom for 2~5 days.
[Trading Strategies]
• Aggressive: Enter at 1.150~1.155 for a spike, stop loss at 1.140 (0.5×ATR≈0.01 below the lower band), target at 1.231 (POC), risk-reward ratio ≈6.1:1.
• Conservative: Wait for a pullback to 1.197 HVN without breaking + a 15m bullish candle with volume (UpVol>60%) before entering, stop loss at 1.187, target at 1.335, risk-reward ratio ≈4.8:1.
• Cautious: Enter after breaking 1.231 and closing above it on 1h, stop loss at 1.220, target at 1.335, risk-reward ratio ≈3.9:1.
Risk Warning: If the lower band at 1.140 is breached or contract holdings increase downwards again, the strategy will fail, and immediate stop loss is required.
[LP Market Making Recommendations]
It is recommended to concentrate market making in the range of 1.140~1.250:
• The lower bound of the range at 1.140 is the lower band of the Bollinger Band + a dense buy order area, providing support;
• The upper bound of the range at 1.250 corresponds to the upper 70% trading volume + short-term holding peak, providing selling pressure;
• The range width of 0.11≈9.5% annualized fee income, and the volatility is at a two-week low, with controllable impermanent loss.
Like and follow for real-time updates!
Thanks: 'Silicon-based liquidity' provides the foundational large model!
Use the invitation code to get 20 million tokens: 6uXvHFfr
$PROVE@Succinct #SuccinctLabs