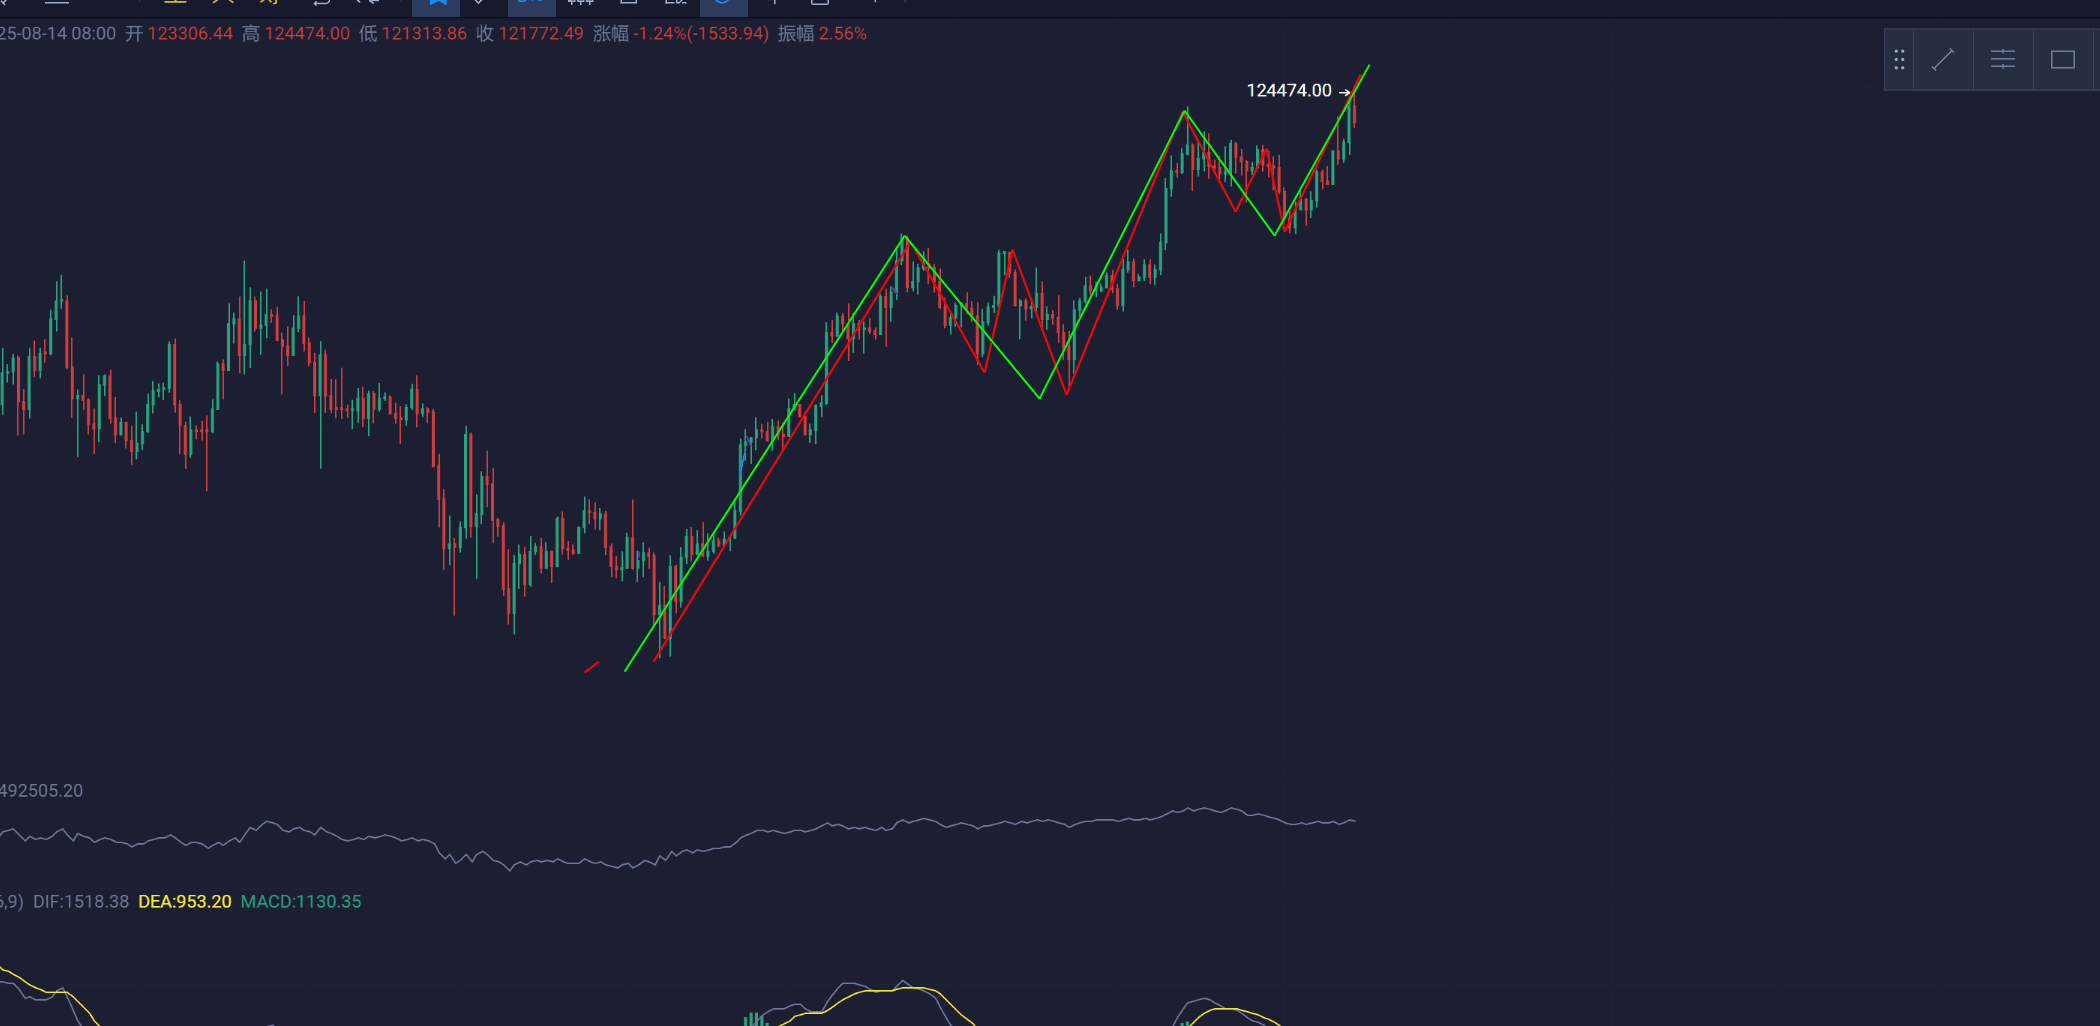
On August 4th, I published the first piece of copy on Binance, with the content being a two-way movement type. Movement 1 is the wave 5-3 plan that breaks the previous high, and movement 2 is the wave 4 plan that ends wave 5-3. The boundary for choosing strength and weakness is set at 115,800 USD, which is the 4-hour EMA at that time. Above the average line is bullish, below it is mainly bearish.
As the market evolves with the movements, the structure becomes more and more complete. The final choice is the continuation plan of wave 5-3.
The overall structure of wave 5-3 is a wedge, specifically manifested as an initial surge, followed by a decline, and then exhaustion.
As shown in the figure:
During the evolution of movements, I always think about a question: does Bitcoin's movement depend on the ETF or does the ETF follow the evolution of Bitcoin?
This question has not received an answer for a long time. However, the answer was obtained at the previous high of 110,000 USD a month ago.
According to top-down thinking, the high point of 110,000 is viewed as the end of wave 5 since 15XXX. There may be strong B later, but it is difficult to have a more complete driving rise.
According to ETF movements, the position of 110,000 is merely the top of wave 3. In this stage of divergence, the ETF ultimately overcomes the movement of the large pie.
Thus, we can conclude that the movement structure of Bitcoin ultimately depends on the completion of the ETF.
Therefore, the hypothetical wave type ending wedge (weekly level) on the 5th and 4th is actually not very established. (According to Bitcoin's movement, it is established). Here we do not exclude but do not prefer this movement.
The following copy is based on the analysis and prediction of ETF movements.
As shown in the figure: MicroStrategy
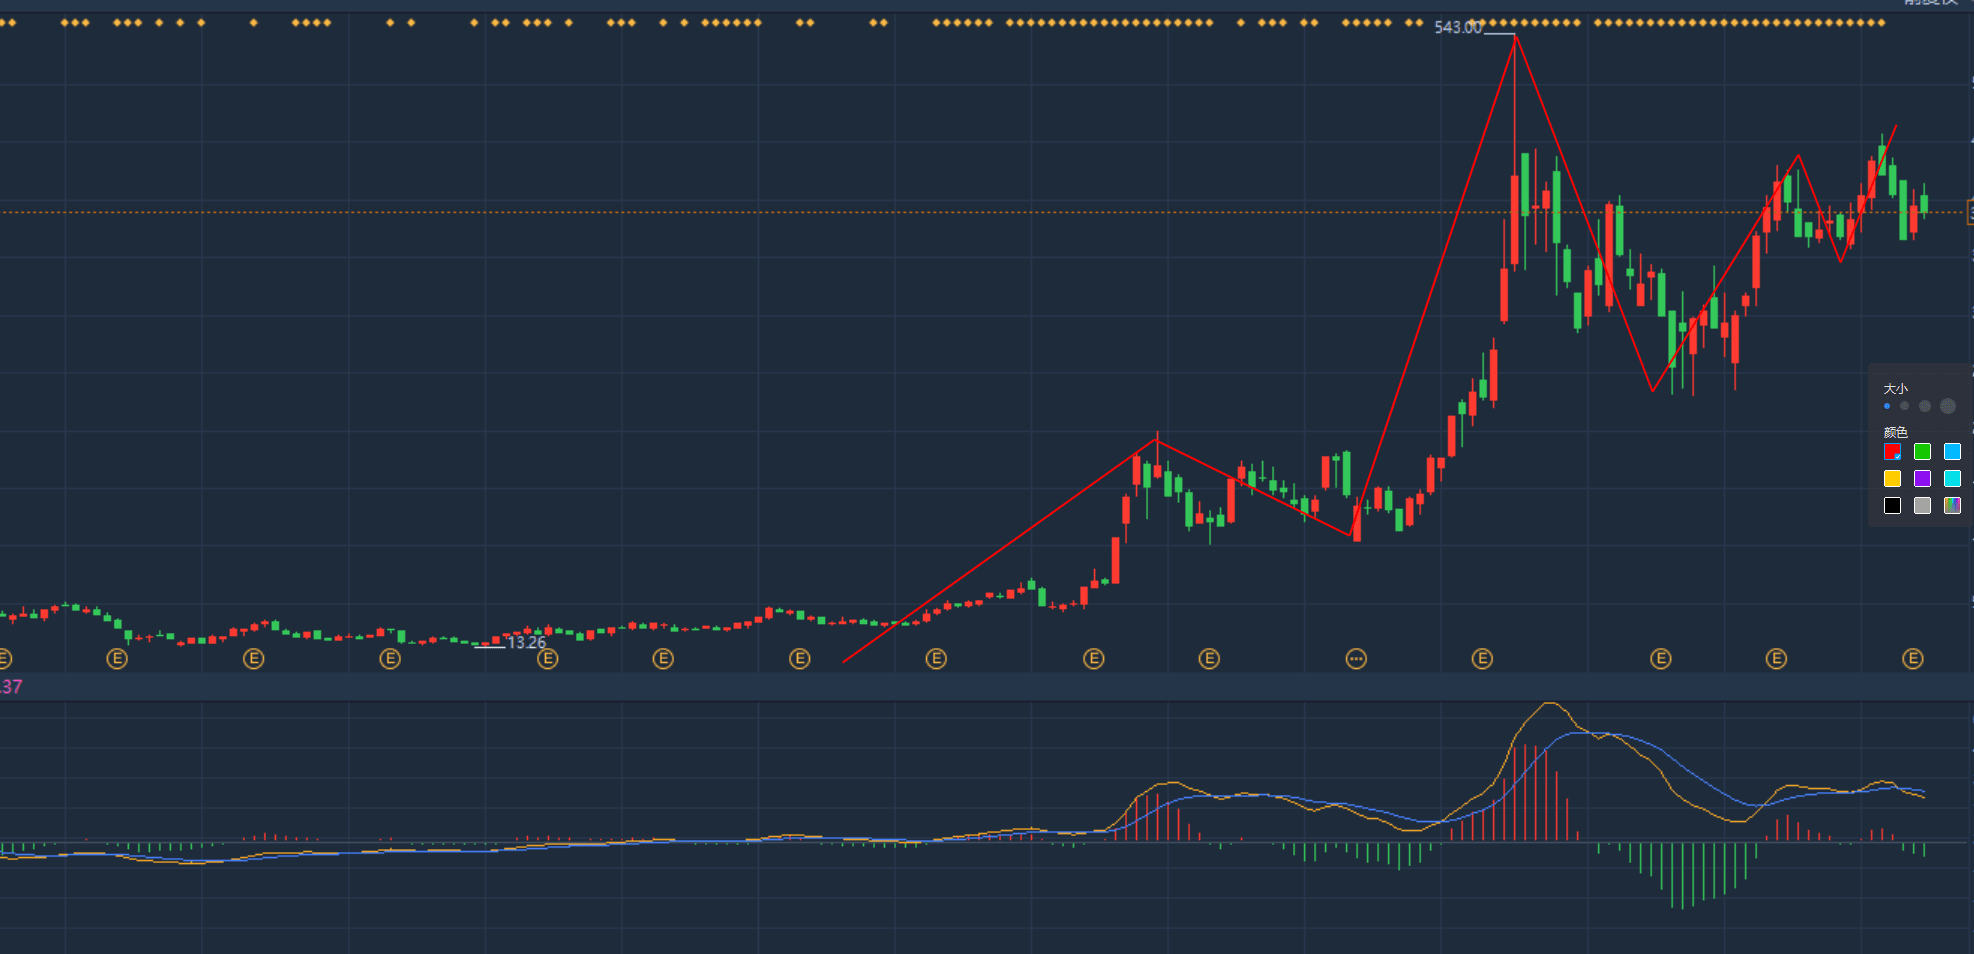
The movement type chart of MicroStrategy very completely shows that Bitcoin's movement lacks upward momentum.
During the stage of Bitcoin continuously reaching new highs, MicroStrategy has only formed the right shoulder.
As shown in the figure: IBIT (Bitcoin ETF)
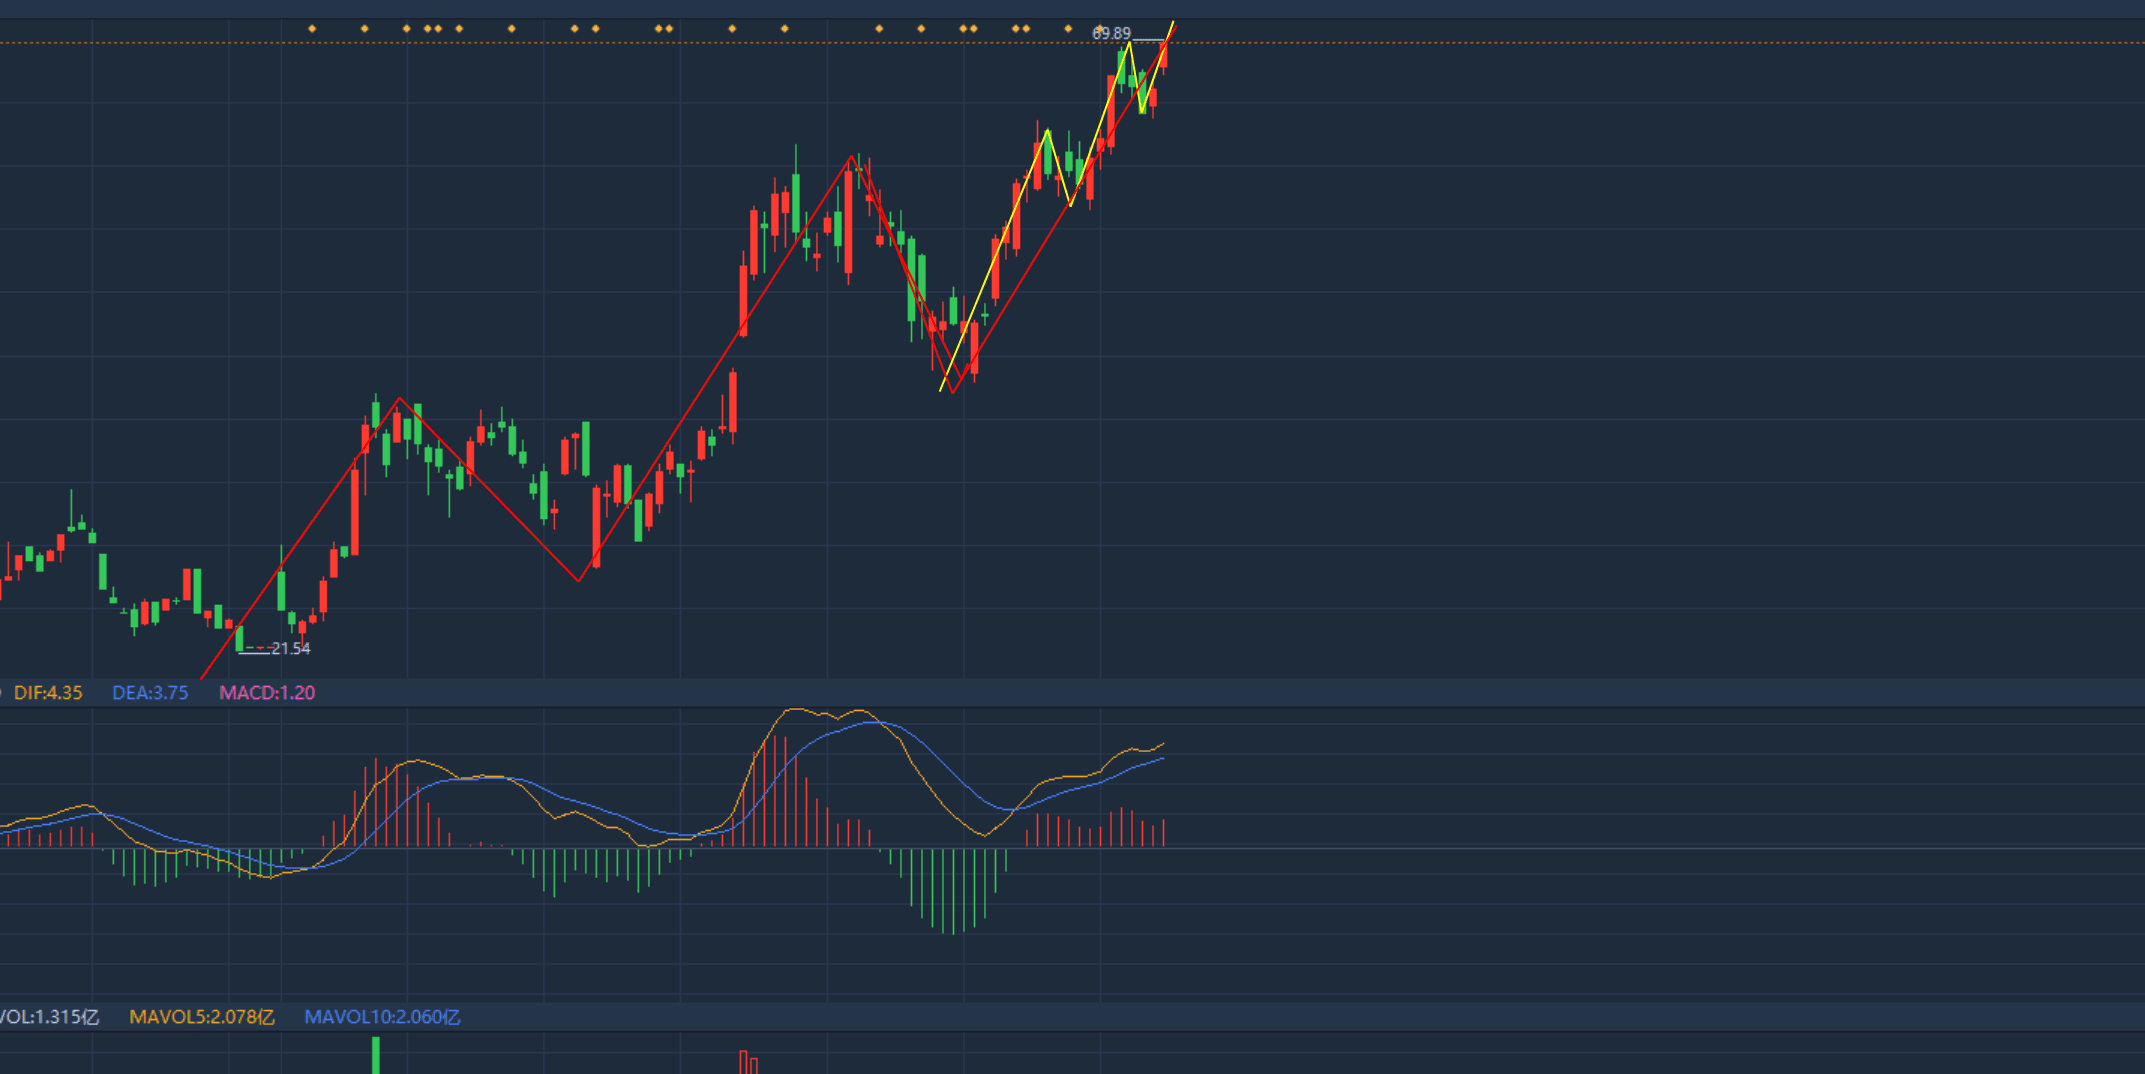
According to ETF movements, it could end at any time, welcoming the end of this round of rise.
Let’s turn our focus back to Bitcoin. In the divergence of movements, we can draw two conclusions.
1. Actually, from this round of bull market starting from 15XXX, it can basically be assumed to have peaked. New highs of a smaller level cannot be ruled out, but from the daily line perspective, this move from 118XXX could end at any time, and after it ends, it will be the high point of this bull market. (15XXX-1???????) Based on the principle of conservation of energy, this move's height is limited and may have already ended.
The previous bull market overall dropped over 70%, so this round taking 61.8% is not excessive, right? The 618% position is at 57XXX.
2. (Based on Bitcoin's own movement type) Here is the end of 5-3, followed by a 5-4 retracement with the target of 5-4 being around 94XXX USD. The value is based on linear coordinates and trend line support.
Summary: Whether it is the end of a bull market or the end of a wedge 5-3, there is a drop here, only the targets are different. But no matter what, it is very dangerous here! So it echoes the opening sentence: this is a great retreat. One can't always be the one to foot the bill for every feast!