In the ever-volatile world of crypto trading, $ENA
ENA/USDT just flashed a textbook bullish breakout pattern that caught the attention of smart money. What began as a consolidation phase has now turned into a strong uptrend, hinting at a potential long-term rally.
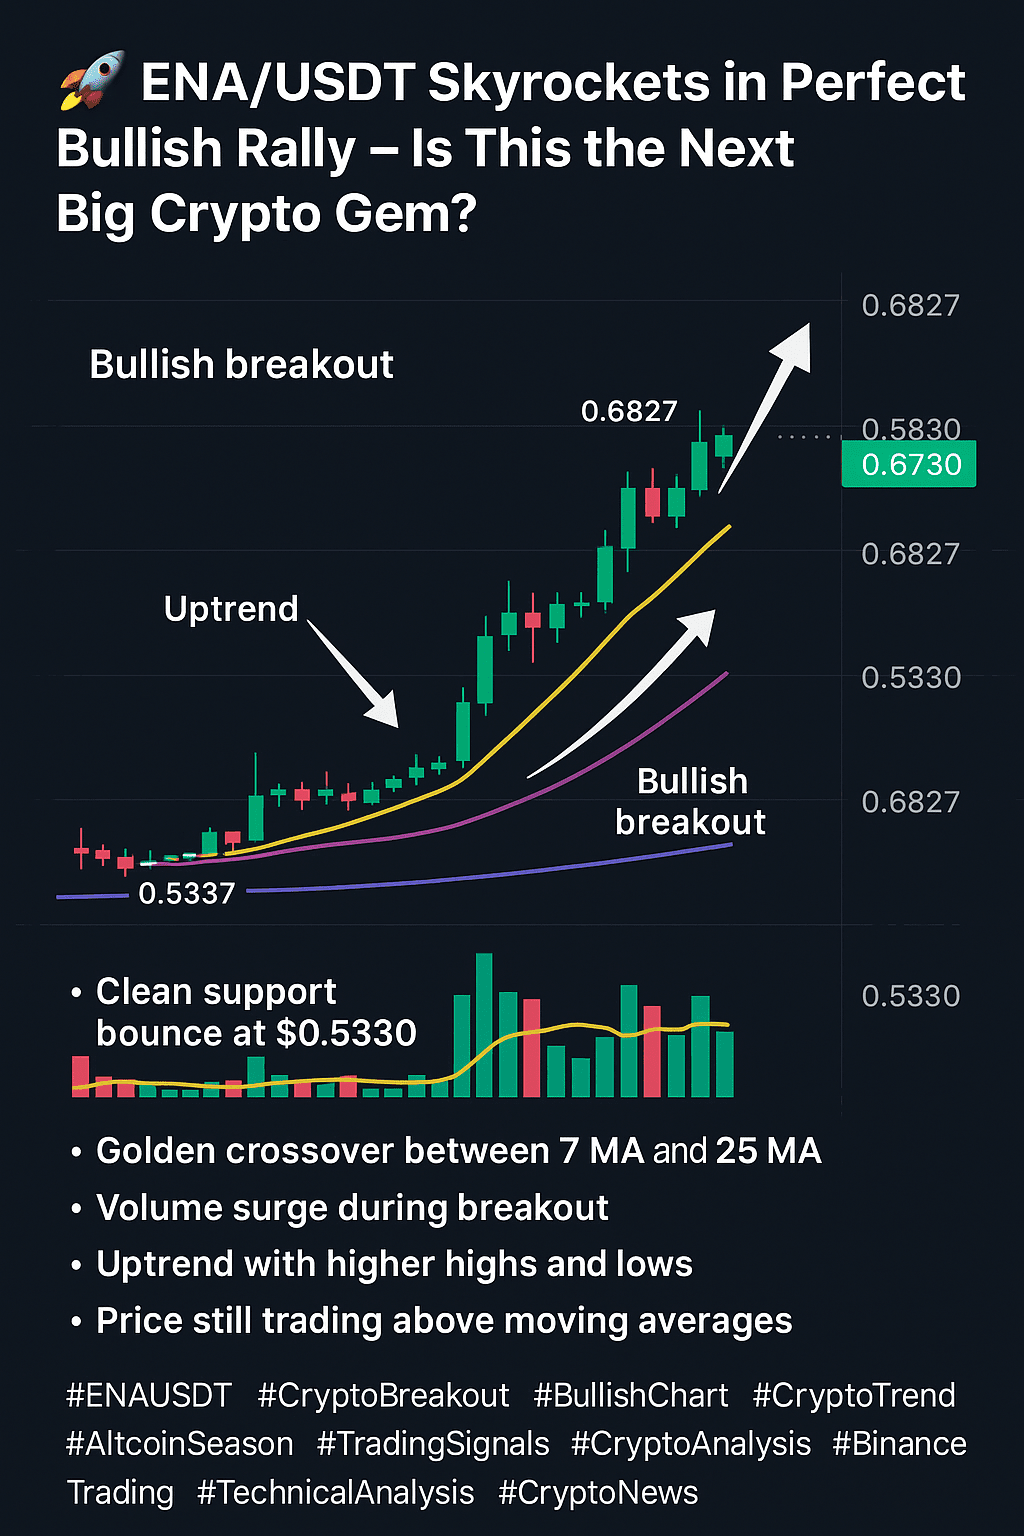
🔍 Chart Breakdown:
The 15-minute $ENA /USDT chart clearly shows:
Clean support bounce at $0.5330, followed by rapid green candles.
Golden crossover between the 7 MA (yellow) and 25 MA (pink), signaling a bullish reversal.
Volume surge during the breakout – a classic sign of institutional interest.
Recent high at $0.6827, showing a potential for retesting or even a breakout continuation.
Price still trading above moving averages, meaning momentum is intact.
🎯 Why This Setup is Special?
Unlike meme coins that pump and dump, $ENA /USDT is respecting technical structure – something serious traders and algorithms both love. When structure and volume meet momentum, big moves happen.
📊 If you're a price action trader, this is your playground.
💡 Pro Tip:
Keep an eye on the 0.6570 - 0.6600 range. If the price holds above it and volume increases, the next target zone could easily push toward $0.7000+.
#ENA #crypto #bullish #Binance #CryptoNews