What we’re witnessing on the $FORM

FORM/USDT 15-minute chart is nothing short of a trader’s dream — a perfect V-shaped recovery, a bullish breakout, and now a potential consolidation for another leg up.

🔍 The chart tells a powerful story:

After a long downtrend where $FORM bottomed out near $3.26, the buyers stepped in with massive volume, igniting a parabolic move all the way up to $3.84! That’s a +17.8% move in just a few candles.

💡 Key Technical Highlights:

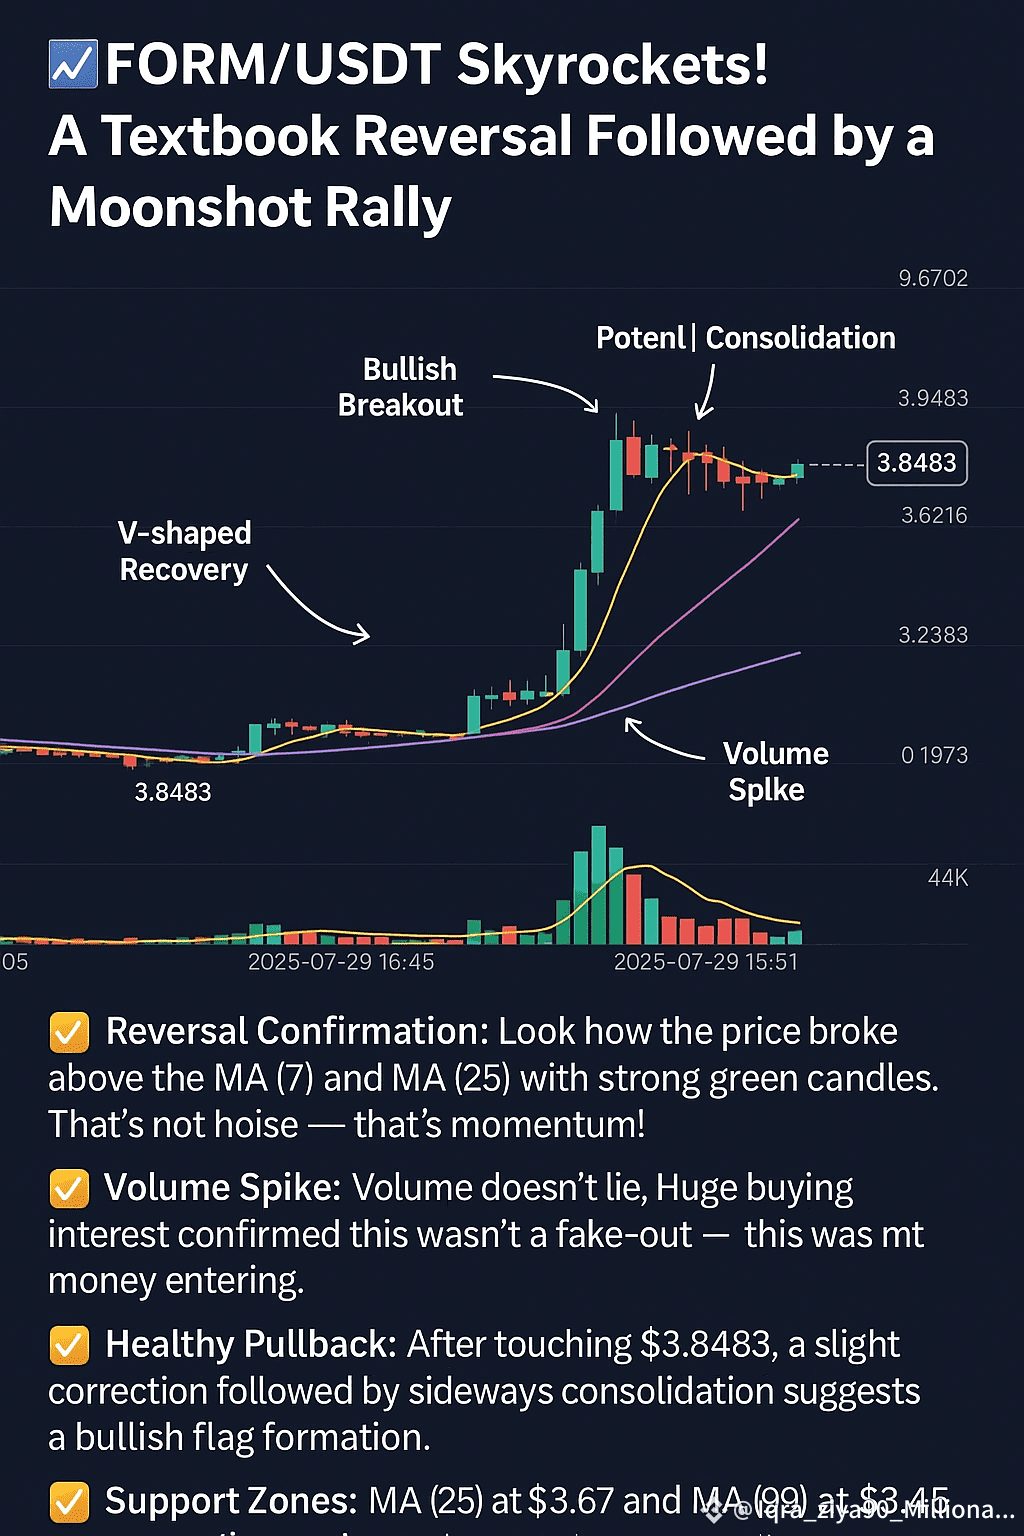
✅ Reversal Confirmation: Look how the price broke above the MA(7) and MA(25) with strong green candles. That’s not noise — that’s momentum!

✅ Volume Spike: Volume doesn’t lie. Huge buying interest confirmed this wasn’t a fake-out — this was smart money entering.

✅ Healthy Pullback: After touching $3.8483, a slight correction followed by sideways consolidation suggests a bullish flag formation. Smart traders know — this could be the calm before the next storm. 🌪️

✅ Support Zones: MA(25) at $3.67 and MA(99) at $3.45 are now acting as dynamic support levels.

📊 What Could Happen Next?

If $FORM breaks out of this consolidation zone with volume, we could see a retest of $3.84 — and potentially aim for new intraday highs.

🧠 Traders Tip: Watch for a breakout candle above the flag range on volume. That’s your cue. Don’t chase pumps — ride the waves strategically. 🏄‍♂️

🔥 Conclusion

This chart is a beautiful combination of technical clarity and trader psychology. It’s not just about lines — it’s about momentum, volume, and timing.

📣 Have you traded FORM today? Or are you waiting for the next breakout? Let us know below!

#crypto #Binance #bullish #BullishMomentum #TrendingTopic