Risk continues to rise, suggesting that the adjustment period will intensify.

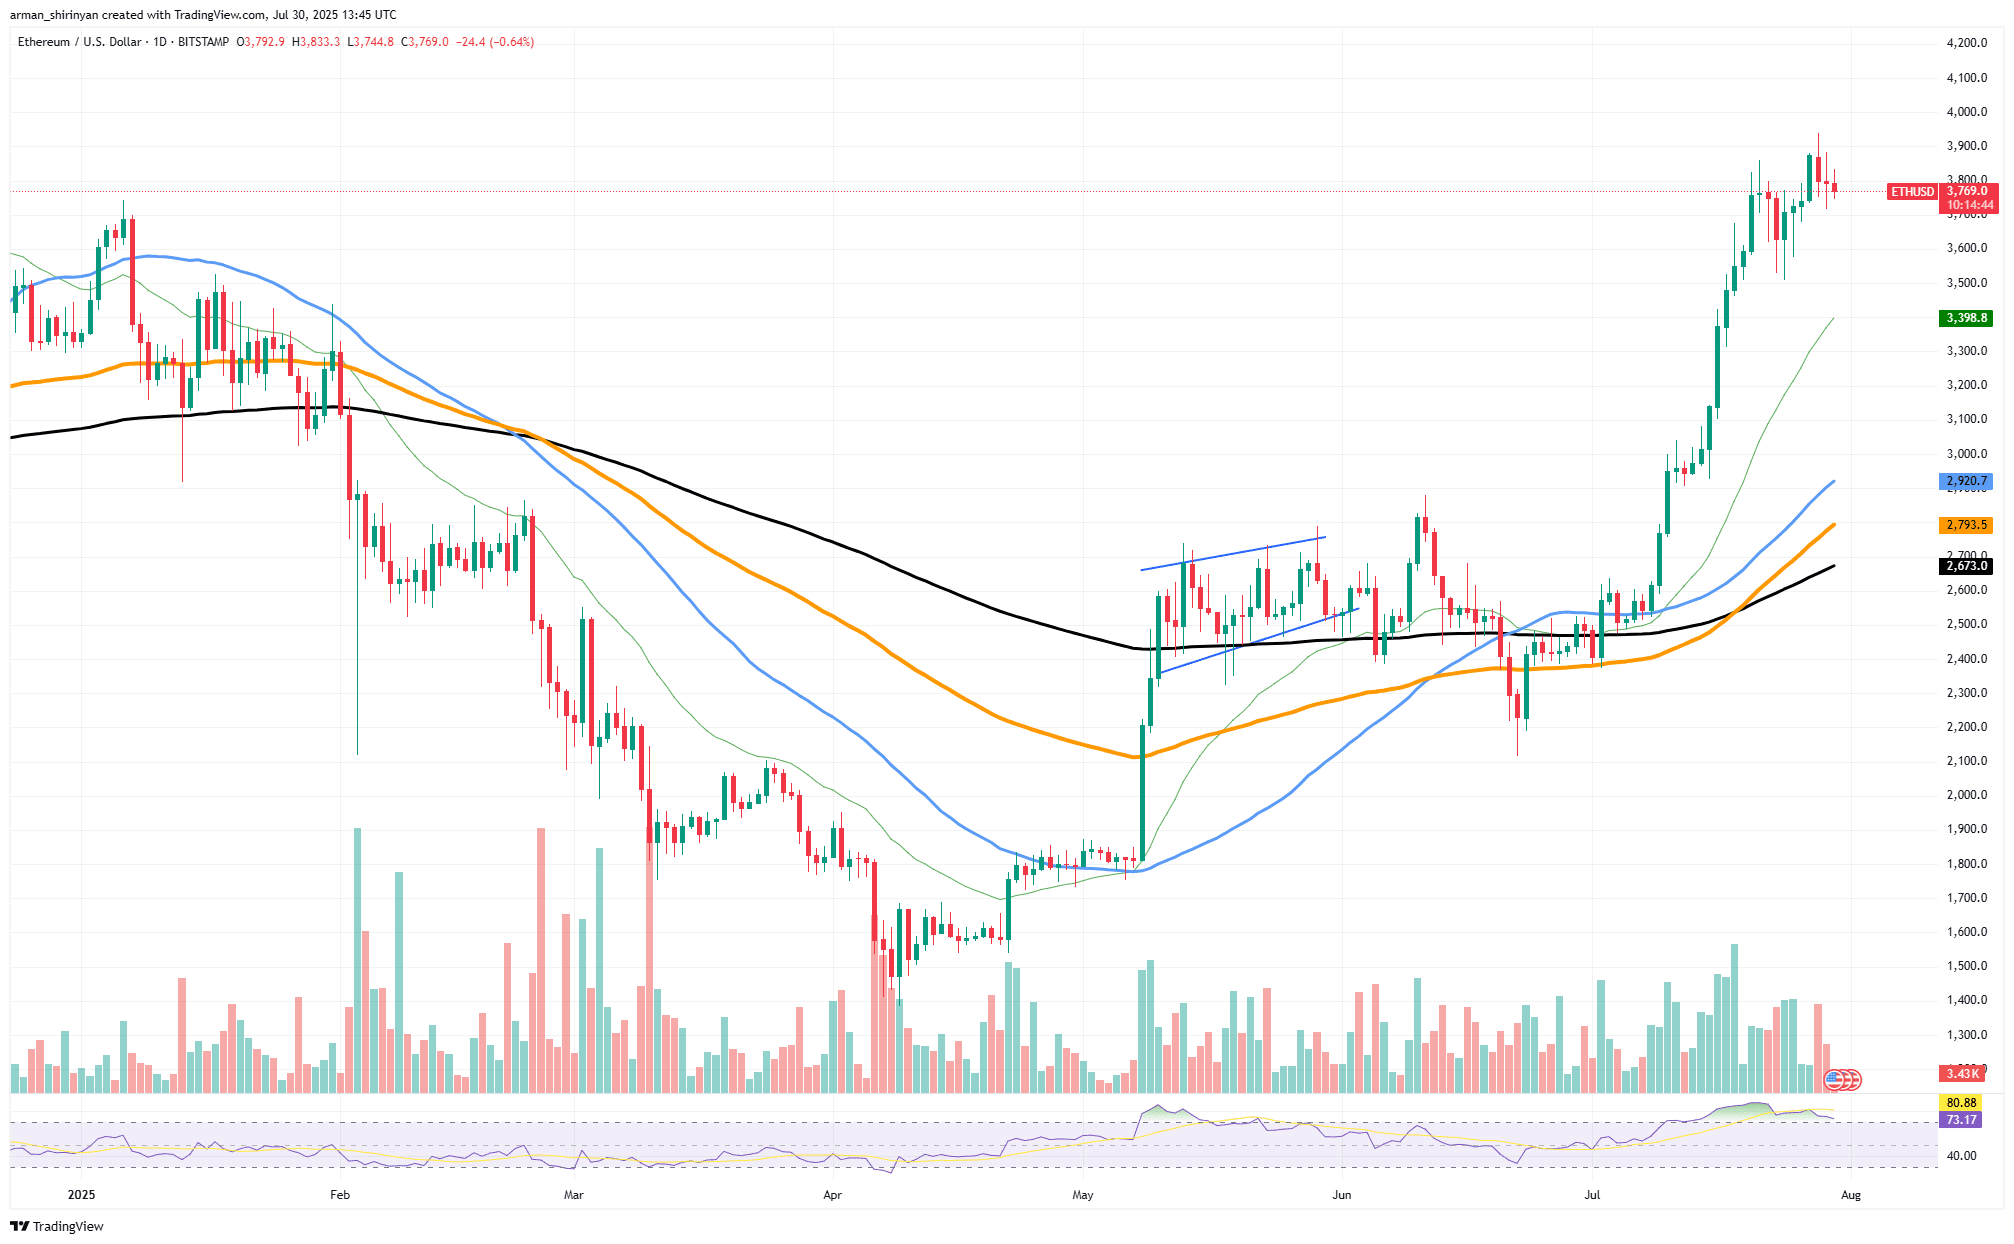
Ethereum again proves that it has not turned bearish. Since breaking cleanly above the consolidation level of around $3,000 in early July, ETH has been on a strong upward trajectory. It is currently trading slightly below the psychological barrier of $4,000. Ethereum is just a step away from testing the resistance level of $3,815, which has historically acted as a wall and a magnet.
Structurally, momentum is clearly strong. On the daily chart, the trend is clear: highs and lows are continually rising without signs of weakness. Ethereum's moving averages have unfolded into a typical bullish pattern after the breakout. The 21-day moving average acts as dynamic support, aiding price increases; although trading volume has slightly retreated, it remains stable.
However, $4,000 is by no means a minor barrier. It is a dense resistance area that has served as a distribution point in several previous cycles. Statistically, without false breakouts or retests, the likelihood of a direct breakthrough is low. The bulls may break this barrier, but in addition to a large influx of momentum traders, significant buying pressure is needed to maintain the price above $4,000.
RSI above 80 indicates that the market is severely overbought. This increases the likelihood of the market entering a cooling period, which could be sideways consolidation or a brief pullback, but it does not guarantee a sharp reversal in ETH's trend. In any case, the market often enters a consolidation phase after experiencing rises like this, and the current trend has been parabolic.
If Ethereum can hold above the support level of $3,750 and withstand profit-taking without collapsing, it may break through the $4,000 barrier. On the other hand, a pullback to $3,400 or even $3,200 would only inject momentum for a more thorough breakout later and damage the bullish structure.
XRP bets on $3.
XRP's recent price action suggests that its trend is weakening, currently teetering around the $3 mark. XRP's rise exceeded expectations, dramatically breaking through the $3.70 barrier after a parabolic breakout in July. However, momentum has since slowed, and the asset has entered a gradual pullback phase, which could reverse much of the gains made weeks ago.
XRP has seen lower highs and closing prices for several days, currently trading around $3.11, and is slowly declining without the kind of rebound activity you would expect from buying on dips. The daily chart does not show accumulation but rather distribution, which is a warning sign for bulls.
The trading volume paints a similarly frustrating picture. Not only has there been no large-scale selling, but more importantly, there are no signs that buyers are taking decisive action. The lack of volume support means that the current pullback may not yet be over and could even intensify.
The Relative Strength Index (RMI) is still high but is gradually declining, indicating that bullish momentum has dissipated due to overbought conditions. The psychological and technical significance of the $3 level is the biggest issue XRP currently faces. If it loses this support level, the next support will be in the range of $2.99 to $2.75, where the last significant consolidation occurred before the breakout. If XRP cannot stabilize soon, the bullish momentum that excited investors not long ago could dissipate.
Dogecoin cannot be ignored.
Dogecoin's recent rally has abruptly reversed, with its current trading price at a low level, posing a high risk. Dogecoin briefly broke above $0.29, then fell back to $0.22, erasing a significant portion of its gains and showing signs of investor fatigue that cannot be ignored.
The chart shows that Dogecoin fell below a key moving average after experiencing a nearly vertical significant pullback in July. When prices fail to stabilize near the top and instead form the regular pattern of lower highs and lows that we currently see, this trend usually indicates that the trend has weakened. Given the unusually high trading volume during the pullback, it seems that more traders are selling positions, while those buying on dips are fewer.
Unless Dogecoin can quickly find support (possibly around $0.21), it may fall further, as the current trend is not healthy. The Relative Strength Index (RSI) has retreated from the overbought territory and is currently trending down, indicating that bullish momentum is weakening, which further exacerbates bearish sentiment.
Due to the lack of obvious consolidation or reversal signals, Dogecoin may face further downside risk. If market sentiment deteriorates, it could test levels close to $0.20 or even $0.19. Dogecoin must rebound strongly from the current level with robust trading volume to turn the situation around.


