25/07/27 BTC false breakdown and return, ETH rises again to 3800, is the altcoin season coming in the second half of the year?
Bitcoin's weekly and monthly lines are about to close; the weekly line is likely to form a doji, while the monthly line has risen for four consecutive months, setting a new historical high. On the short term, there was a false breakdown on the daily line that recovered, which also aligns with the expectations. Previously, it was expected to drop to 114000 to fill the CME gap, but it only dropped to around 114700 before rebounding, and the current price is around 118000.
Ethereum formed a doji and has had a large bullish candle this month with an increase of over 50%. The weekly chart is likely to form a doji but the pullback is relatively weak, rising again above 3800. If it breaks through 3860, there is a chance to continue challenging the resistance at 4000 to 4100.
Bitcoin
The daily line shows increased volume in the decline, with a short-term false breakdown recovering; the lowest point was above 114700 and did not fully retest the CME gap, indicating strong performance. The daily MACD is still below the zero line with a crossover of the fast and slow lines; we are waiting for the MACD histogram to flip above the zero line.
The four-hour chart has formed a descending wedge, the triangle has converged and rebounded, coming under pressure below the descending trend line; short-term waiting for a pullback to enter long.
Support: 114700—116000
Resistance: 119000—121000—123000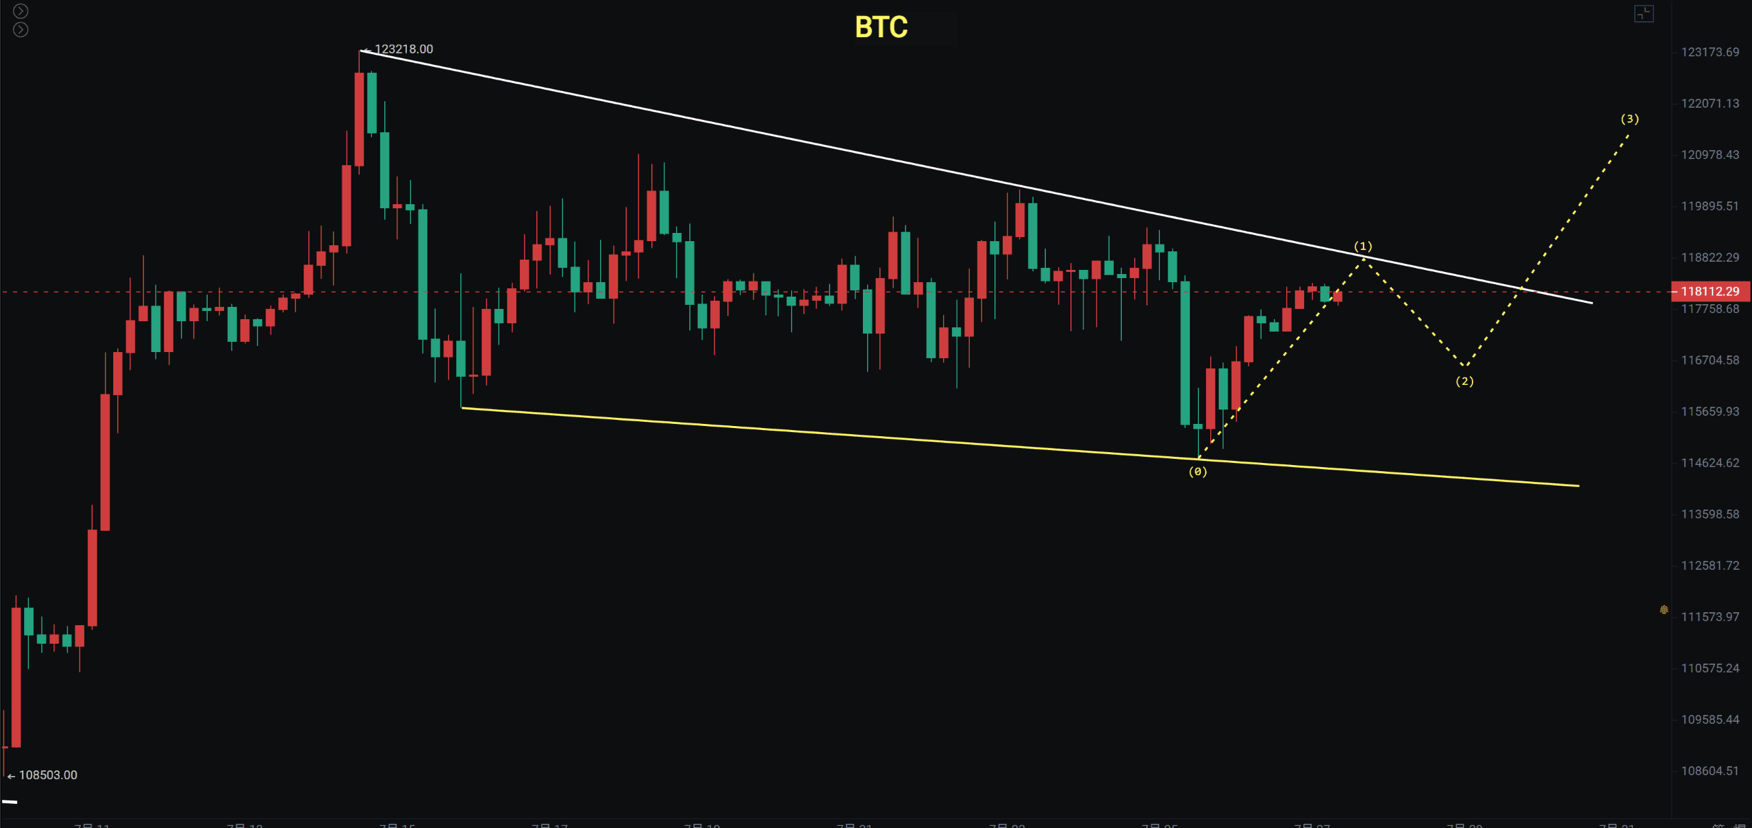
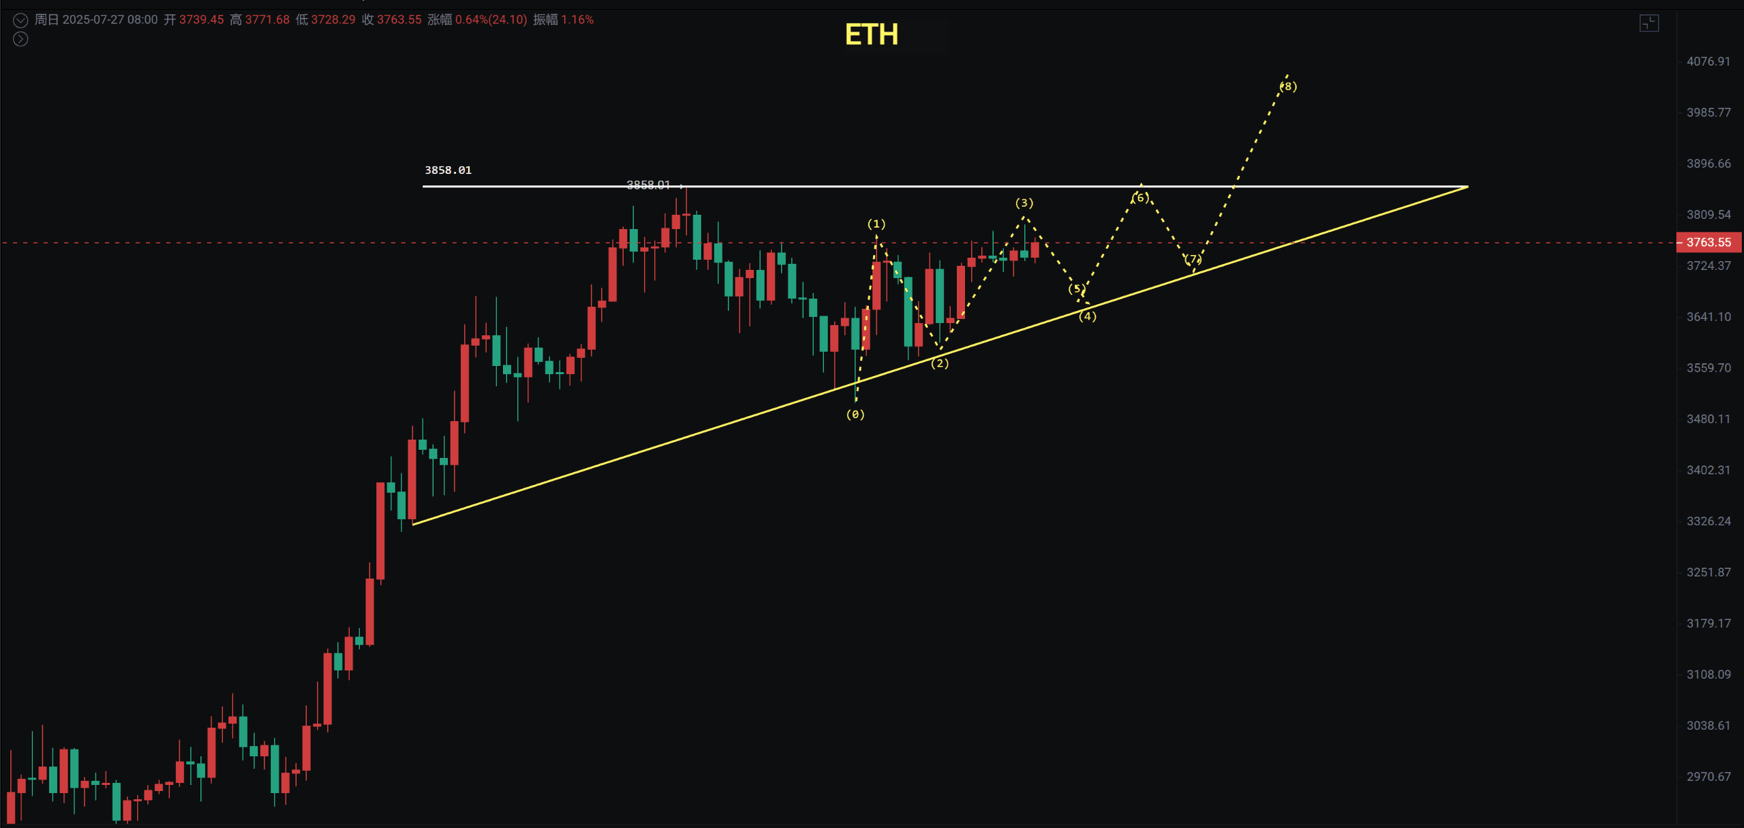
Ethereum
Ethereum has seen four consecutive bullish weeks; this week it will form a doji, and next we will see if the weekly converging triangle can break through the resistance at 4000 to 4100, which may challenge a new high of 4872 or even a new high of 6000.
Ethereum's pullback is relatively weak, and it has once again broken through 3800. The four-hour chart has formed an ascending triangle; pay attention to the breakout situation at 3860.
Support: 3500—3760
Resistance: 3860—4000—4100