Hey everyone. As we enter the final week of July, we've closed out the previous week with a clear divergence in the market. While Bitcoin has entered a resting phase with low volatility after its new high, the long-awaited move came from Ethereum, which completely dominated the week. With options expiration approaching, let's dive in and see what the data is telling us.
Bitcoin (BTC)
Last week's summary clearly shows that BTC has passed its energy and momentum to altcoins, especially ETH. The price closed the week with a slight drop of 1.5%, but the Fear & Greed Index remaining at 73 indicates that investors are still maintaining their overall bullish expectations. This sideways movement can be read as a consolidation period where BTC is gathering strength for its next big move.
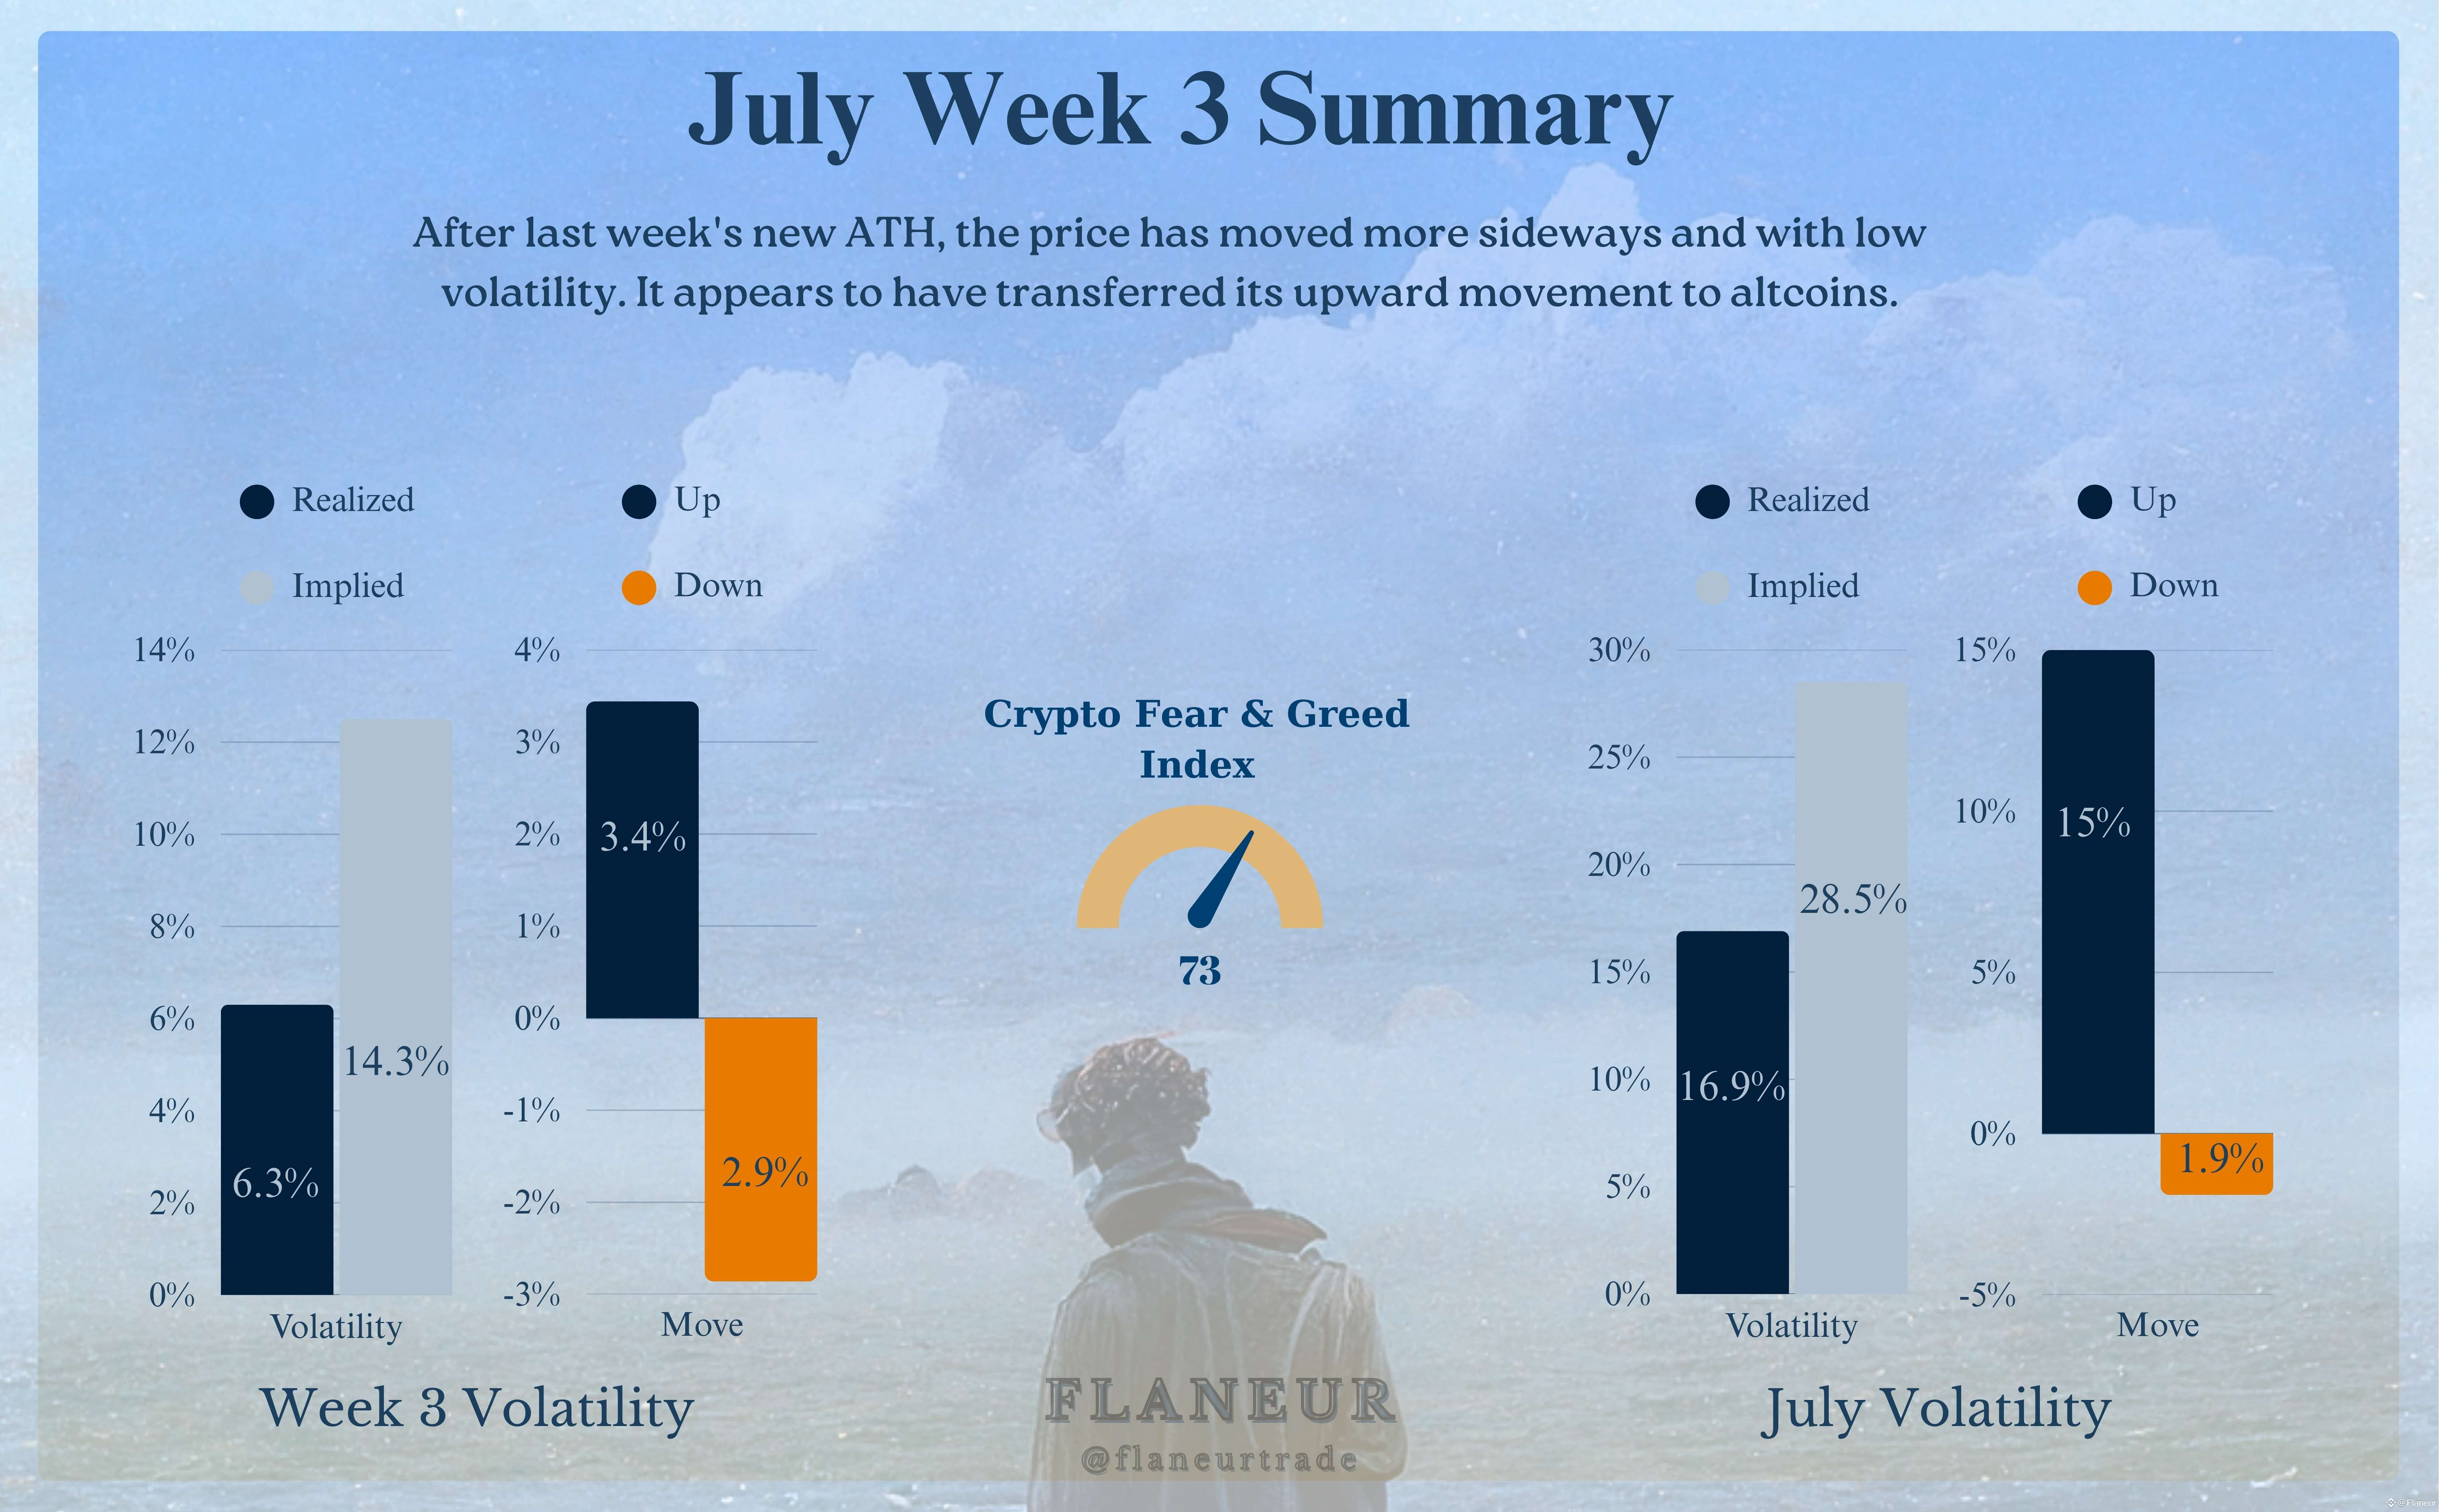
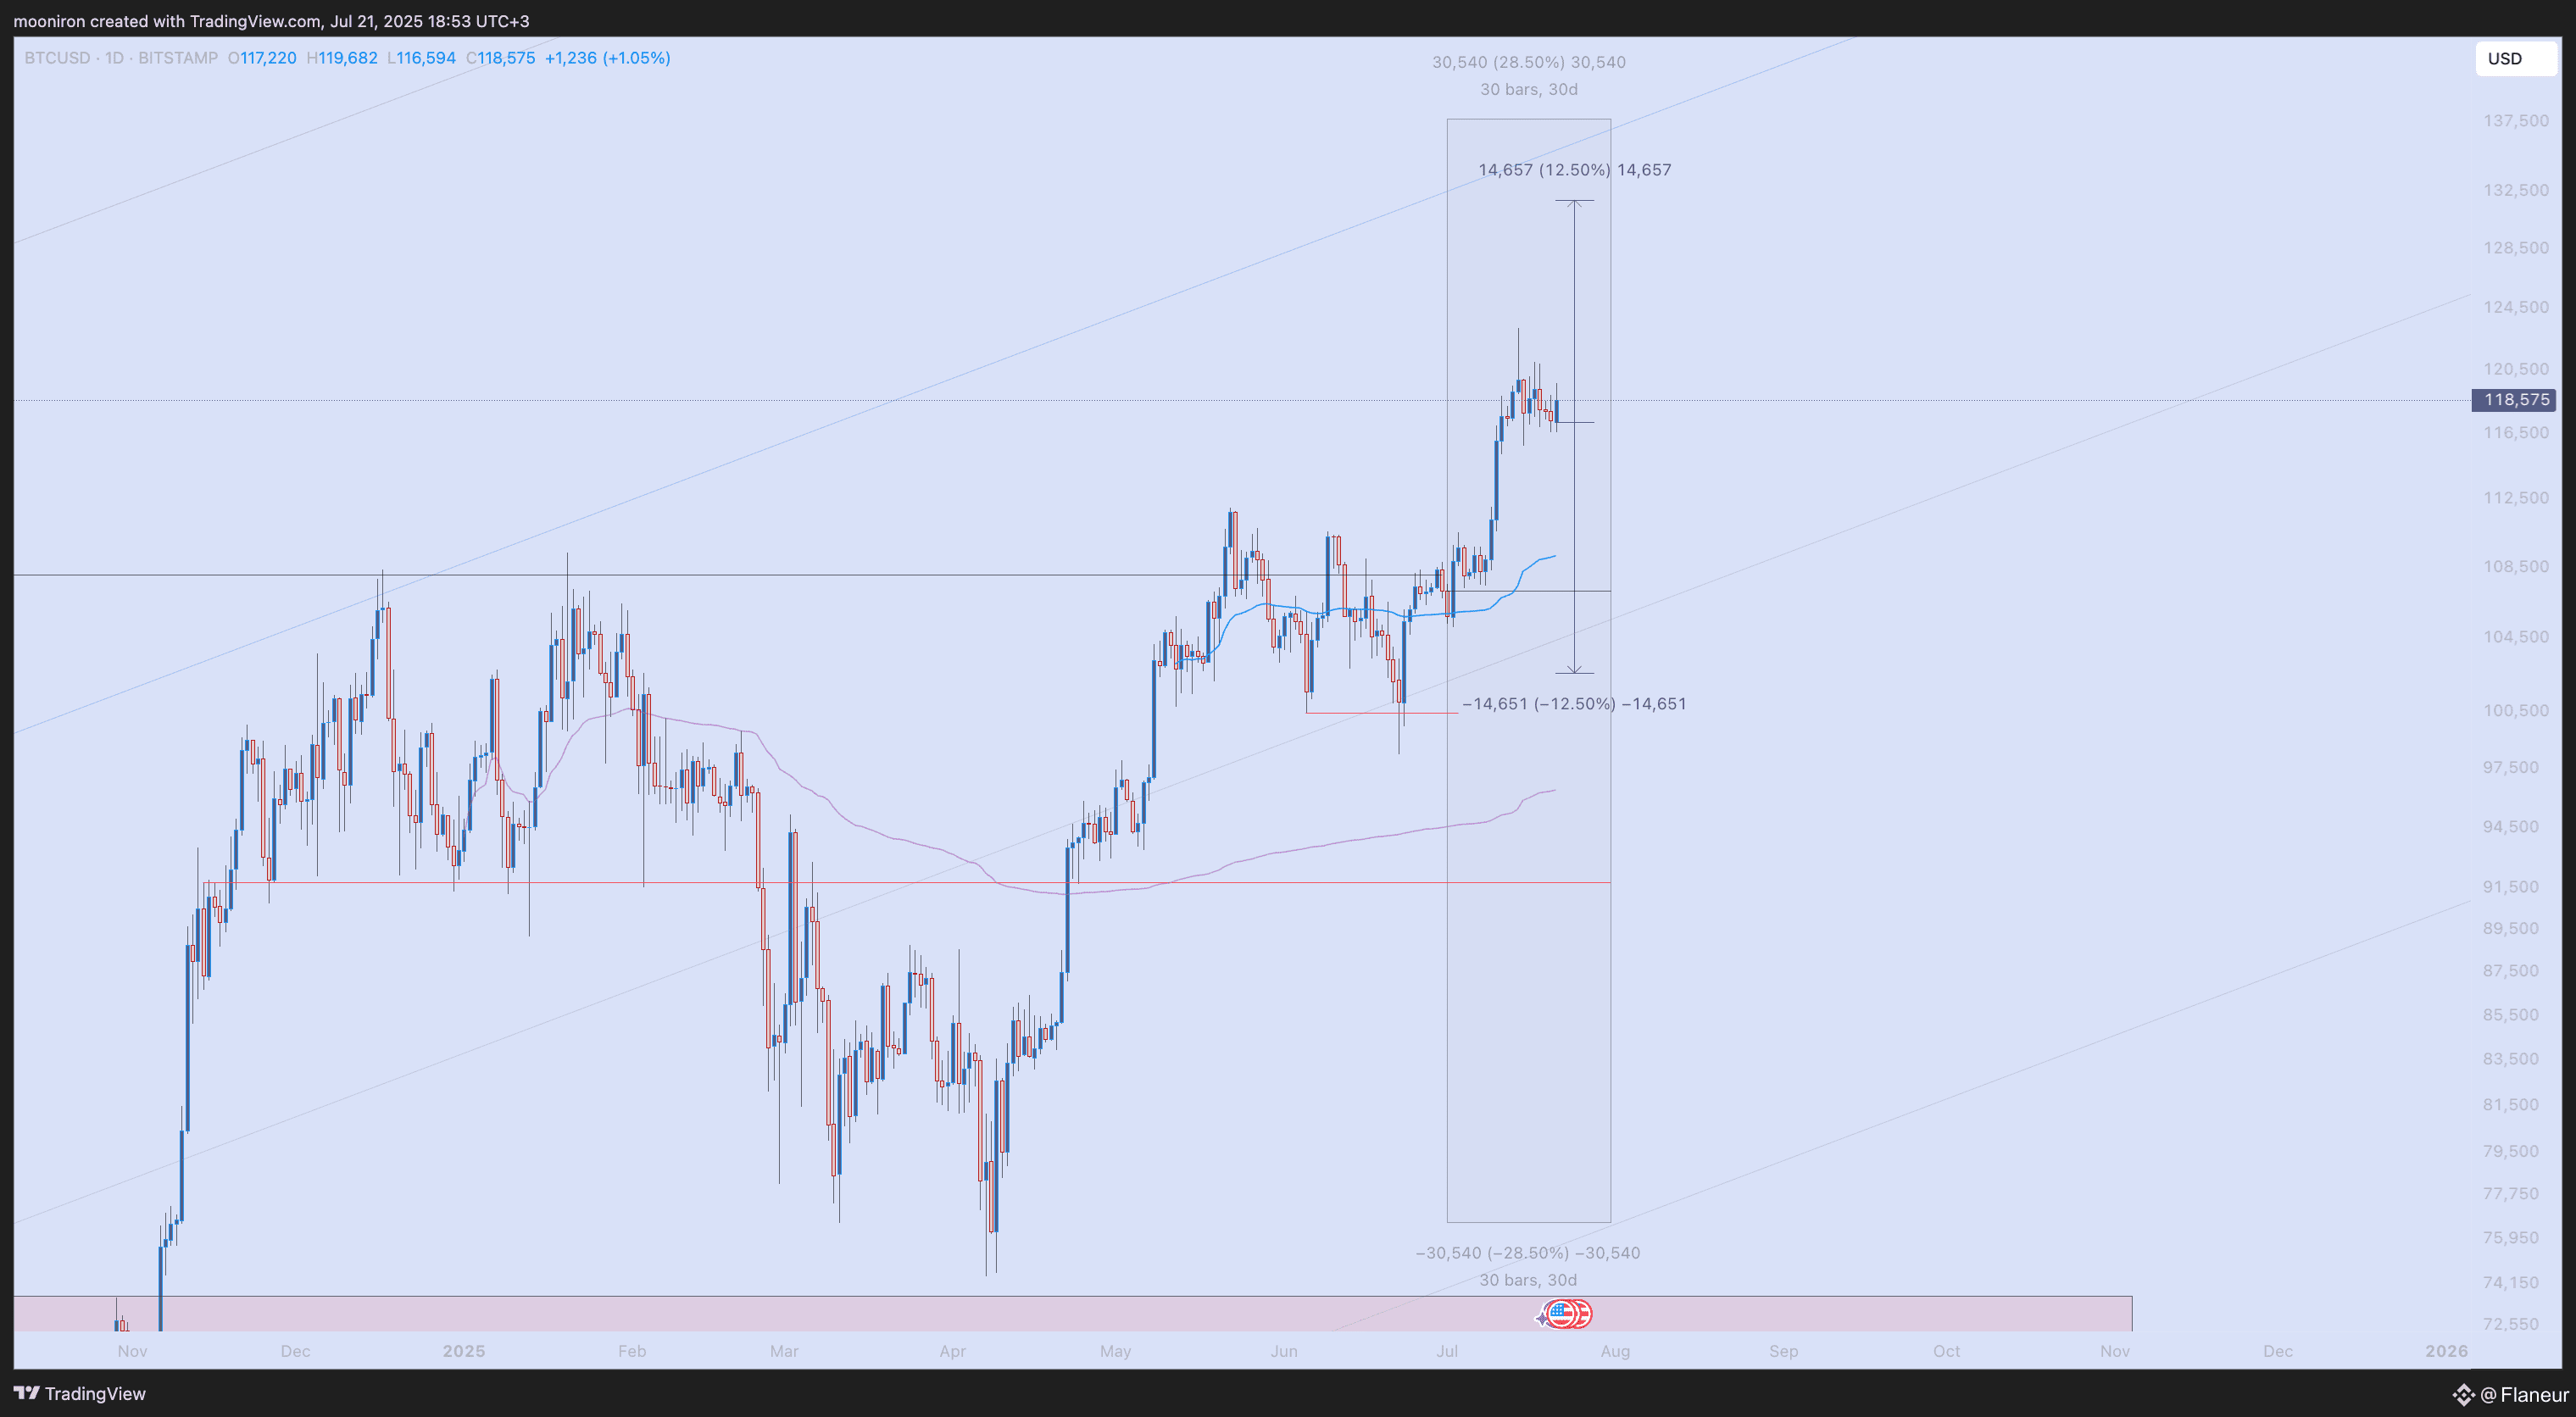
This week's expected volatility (implied volatility) range is between $102k and $132k. The price remaining in this wide range, especially if it tests the lower supports, could be seen as a buying opportunity for the next wave up.
Options Market Data:
Put/Call Ratio: The ratio, which was quite optimistic at 0.65 last week, has risen to 0.76. This indicates that some fear or at least hedging trades have entered the market due to the price stalling near its peak. It's likely that the rise in the Max Pain price to $110k is also related to this, as traders hedge their positions against a higher price target.
DVOL: Remaining stable at 39%, it confirms that the near-term expectation for BTC is still one of low volatility.

Ethereum (ETH)
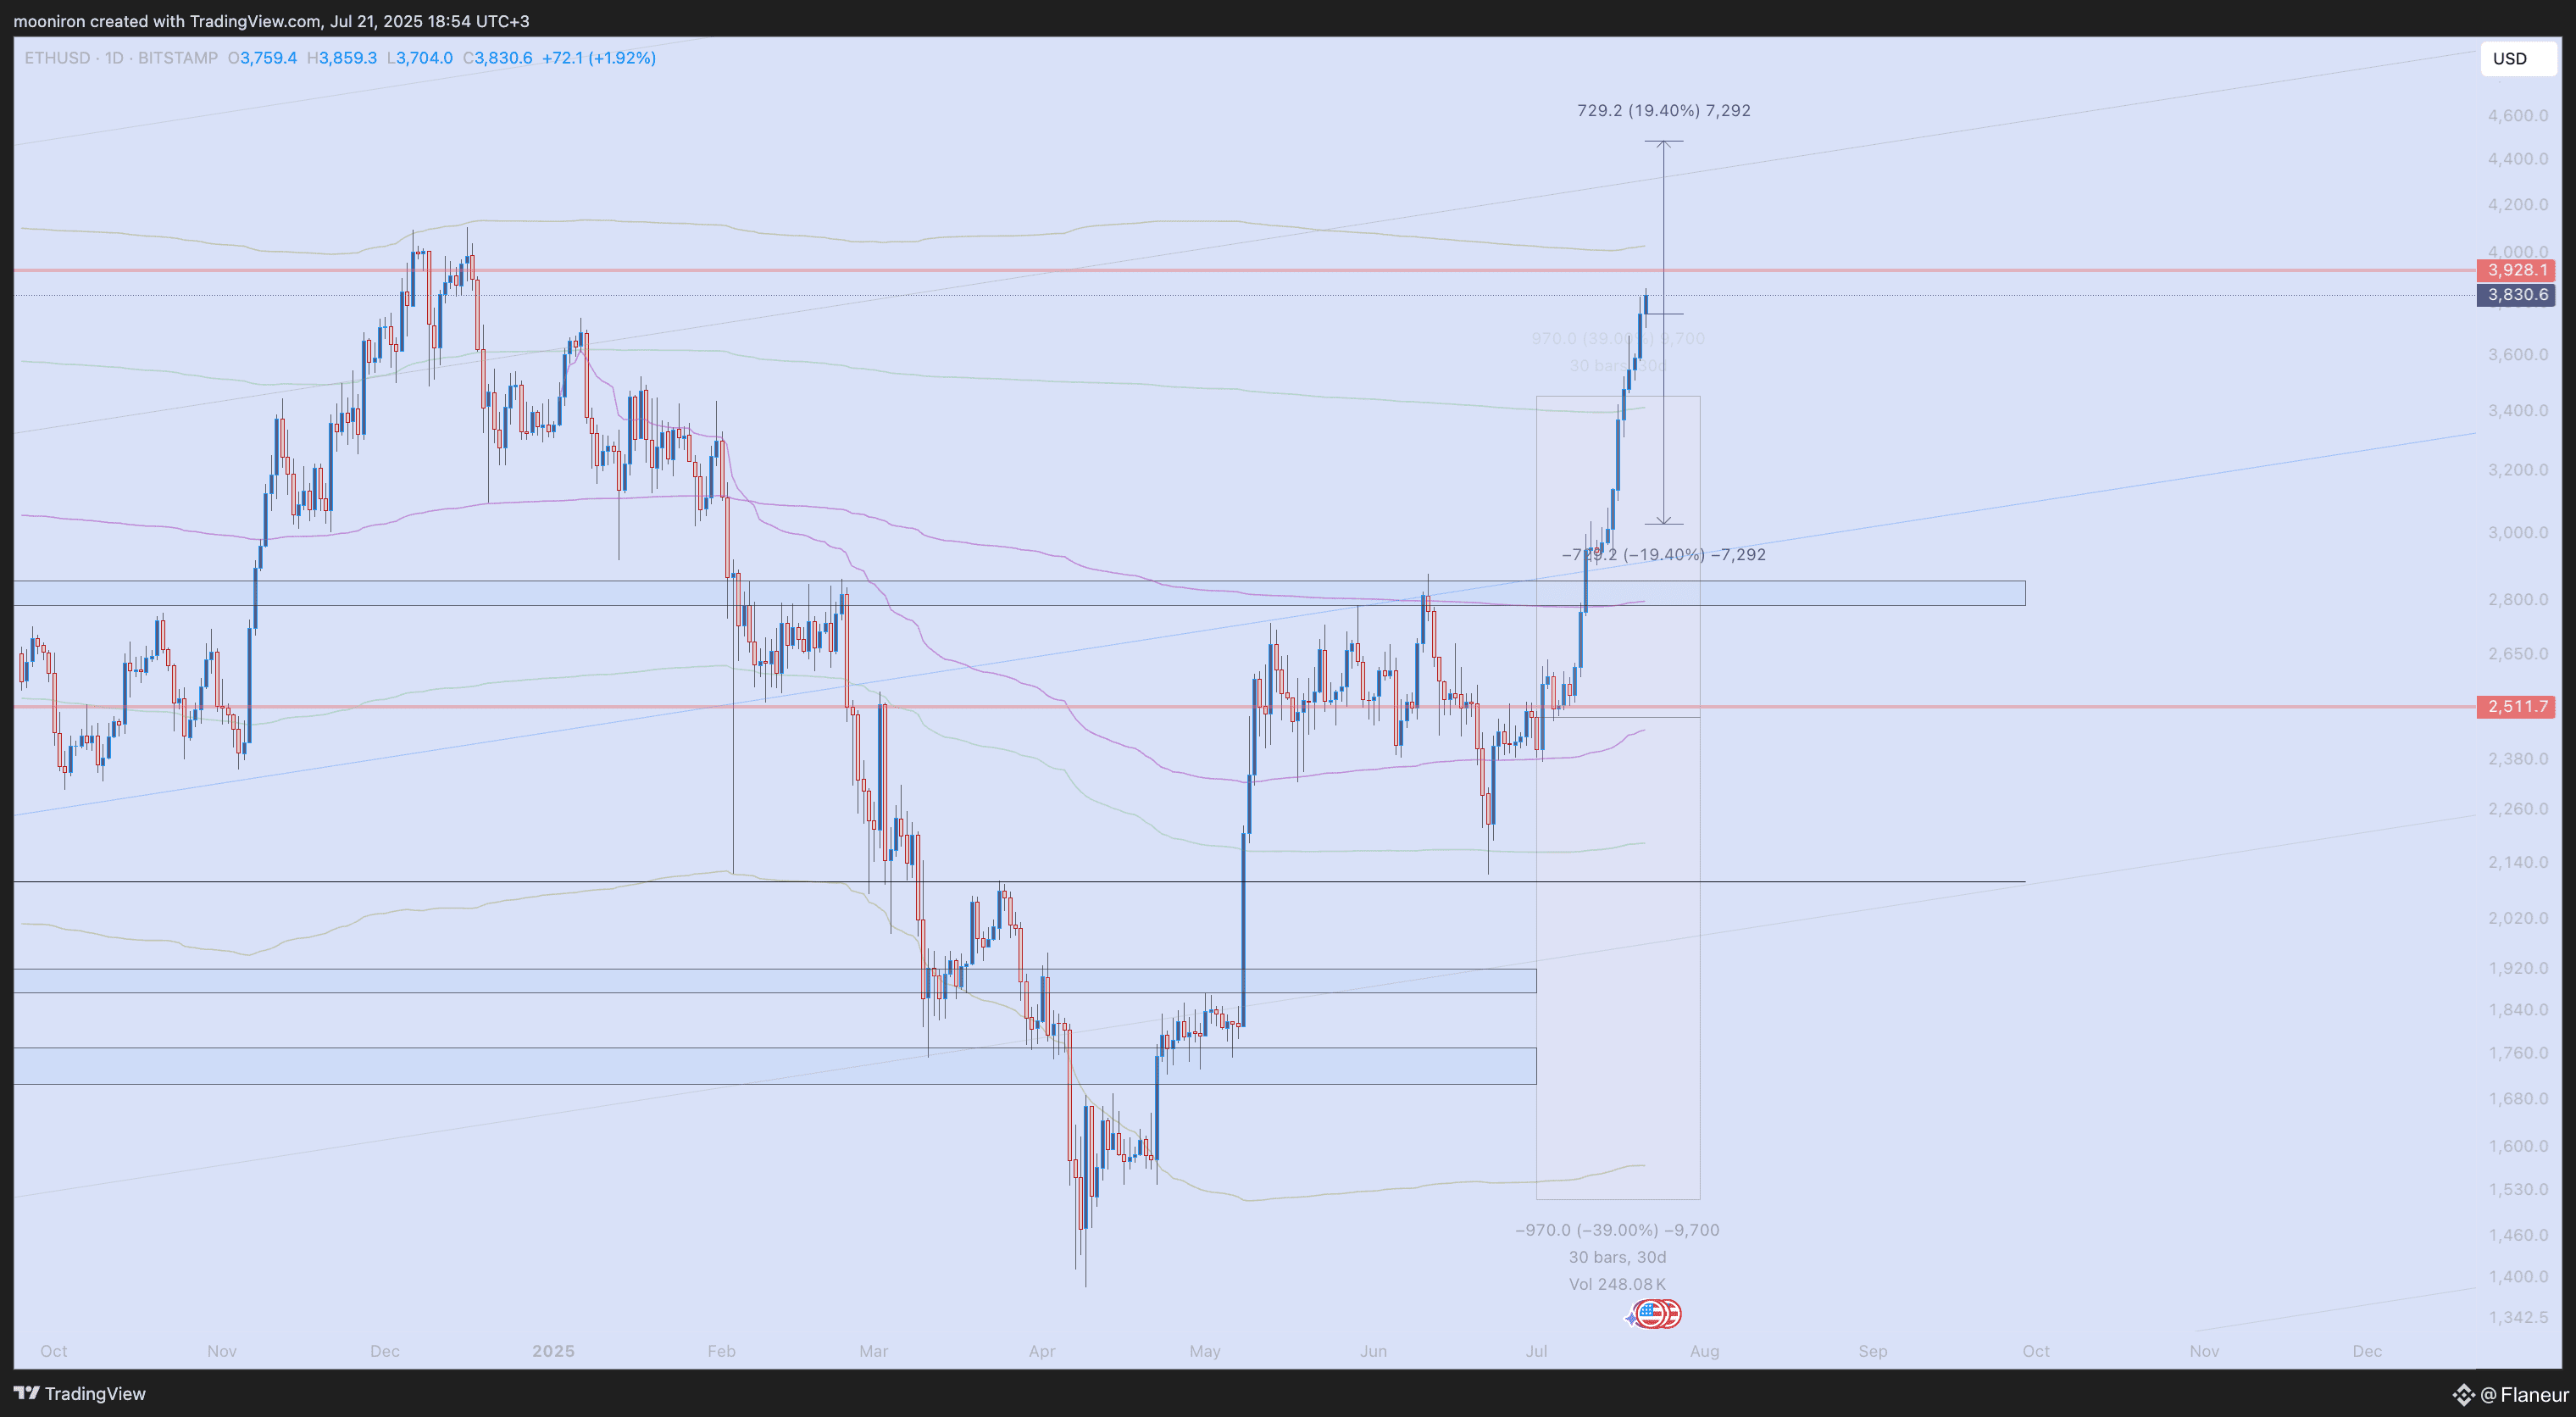
The star of the week was undoubtedly Ethereum. It broke upwards from the long-standing squeeze around the $2500 area with an incredibly powerful candle, as seen on the shared chart. With a massive weekly gain of 28.6%, the volatility that had been expected for months has finally arrived, even exceeding the monthly implied volatility. The surge in the Fear & Greed Index to 80 is also a reflection of this euphoria.
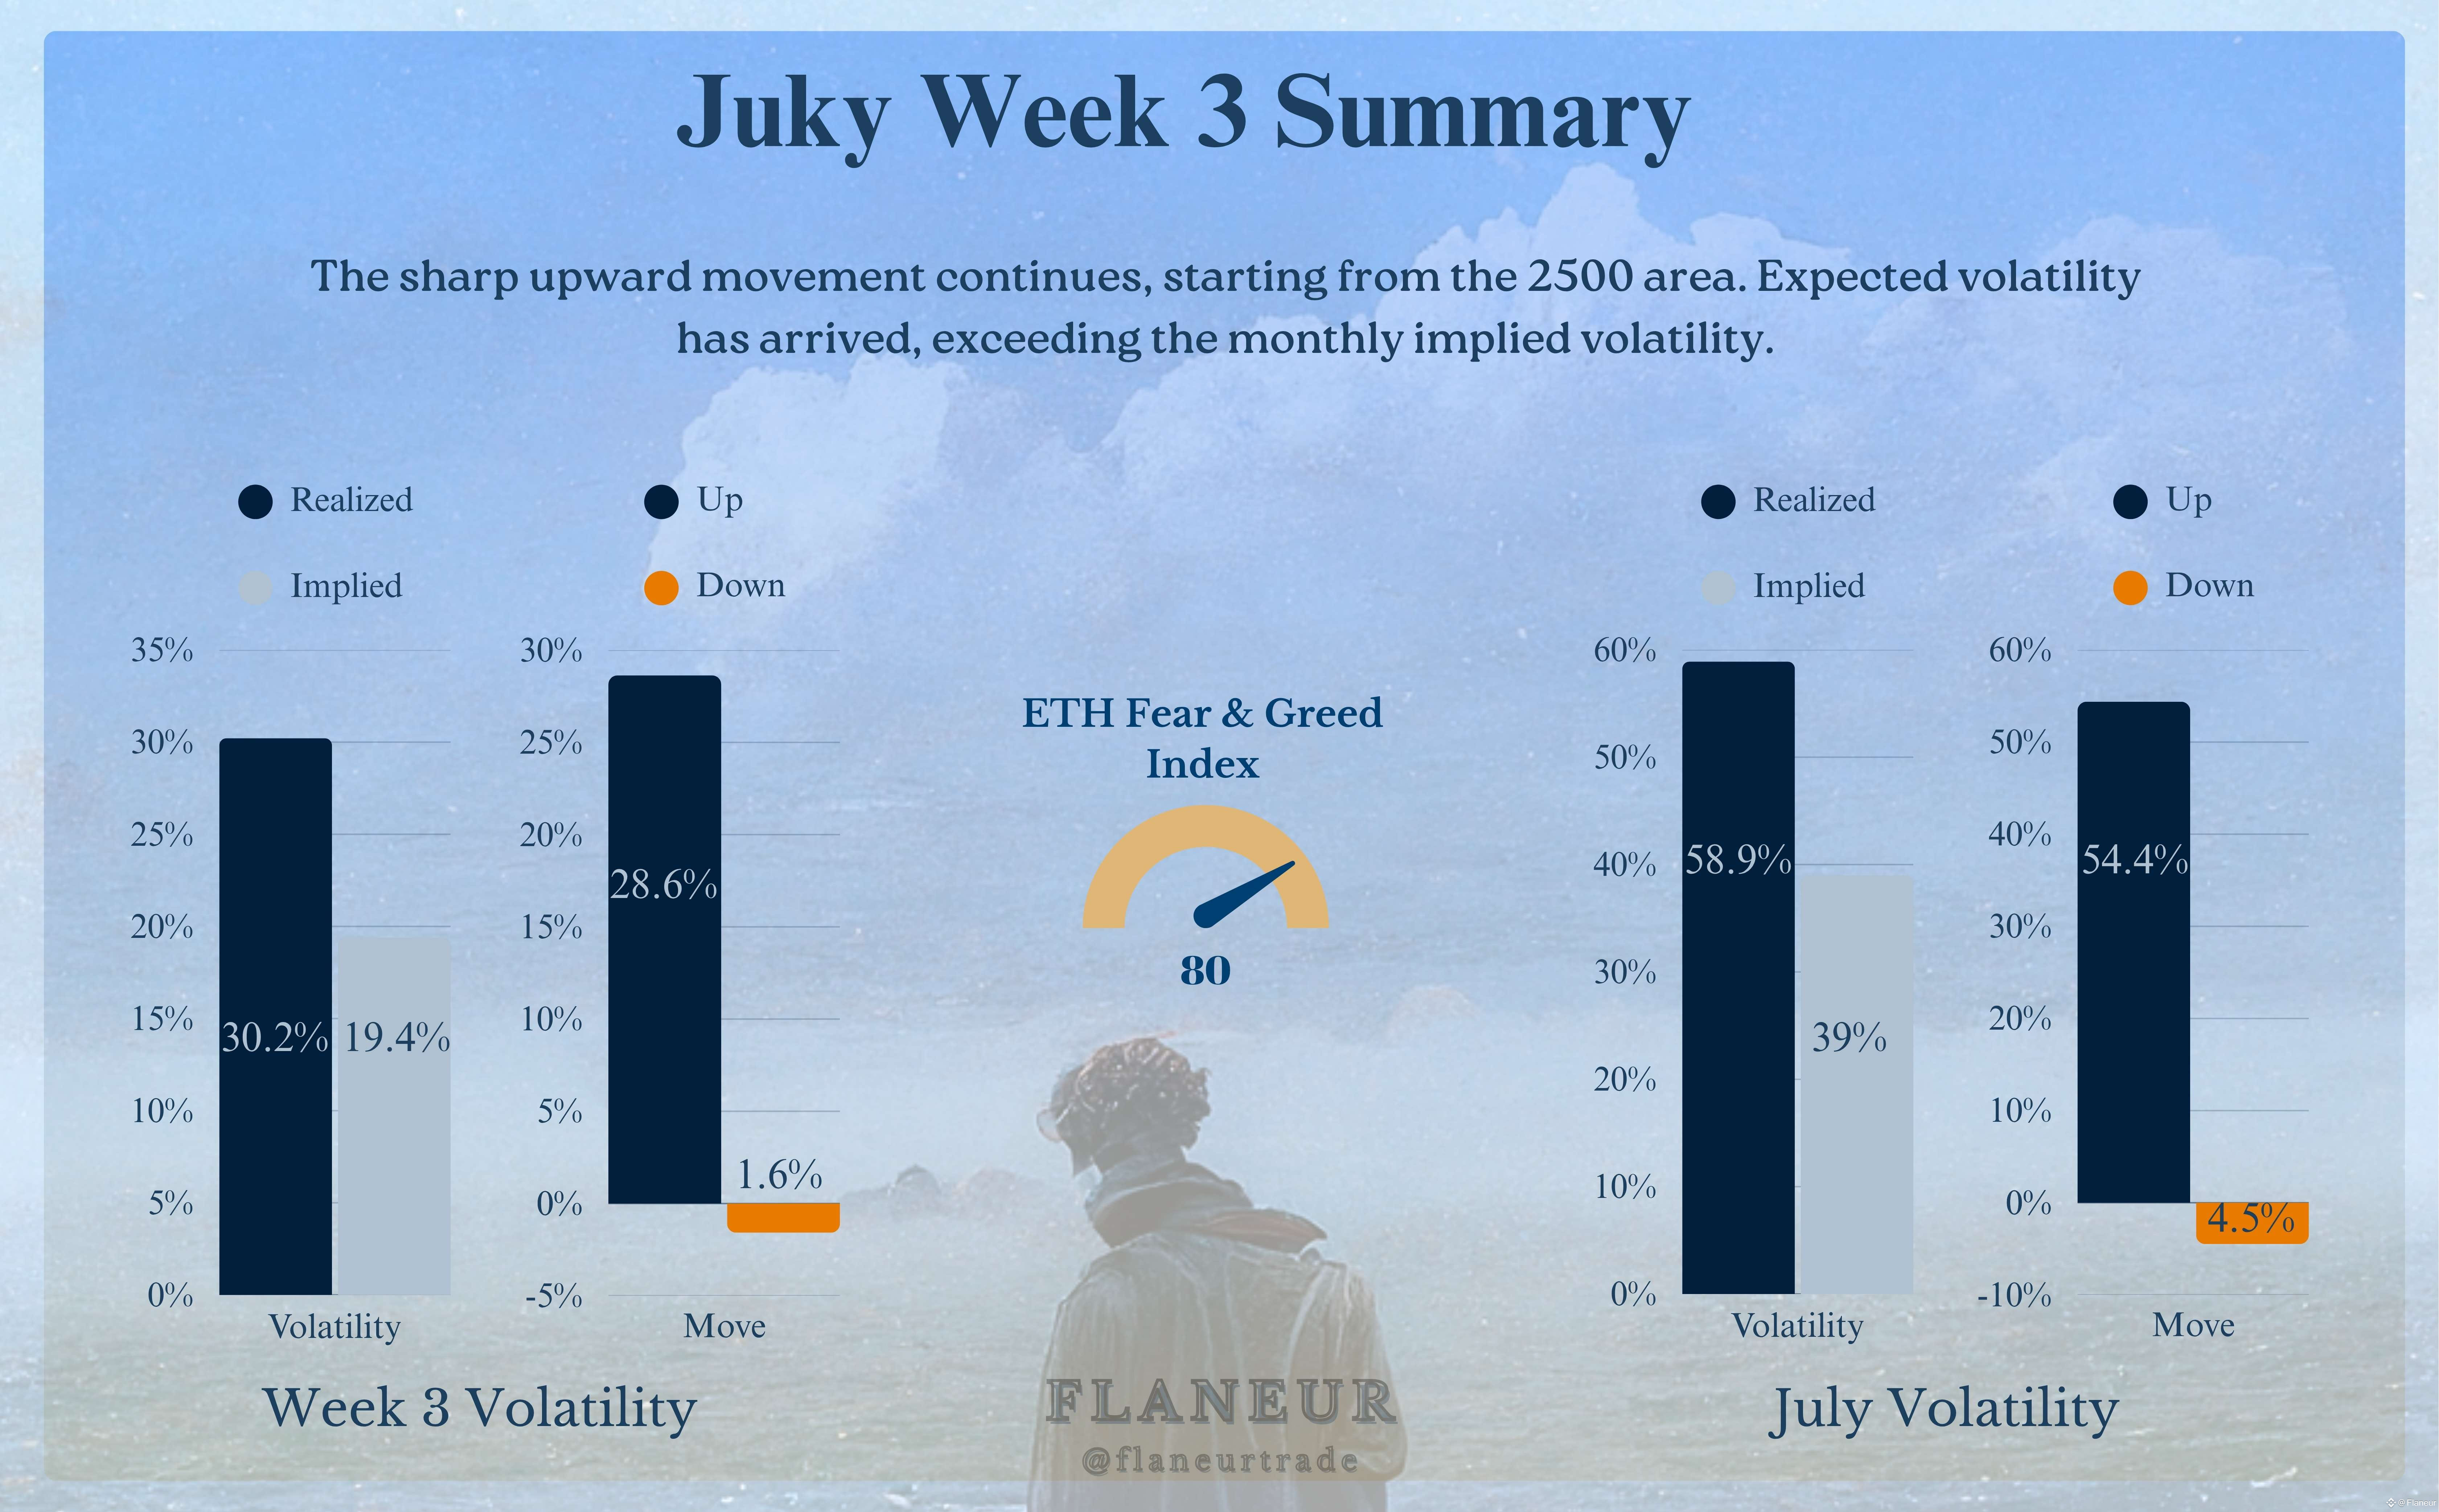
This week's implied volatility range points to a very wide zone between $3000 and $4500. With the breakout now confirmed, all eyes will be on whether this momentum can continue. A pullback towards the $3500-$3300 area and establishing stability there is critical for the continuation of the rally, and a move upwards can be expected again from these zones.
Options Market Data:
Max Pain: Following the price action directly, it jumped from last week's $2,500 level to $2,800. This shows that the market has accepted this as the new equilibrium point.
Put/Call Ratio: In a similar move to BTC, we see this ratio has also increased from 0.62 to 0.79. This could reflect some investors taking profits after the sharp rally or hedging their positions against a possible pullback.
DVOL: Rising from 66% to 70%, it shows us that after the sharp move, the expectation for future volatility has also increased.

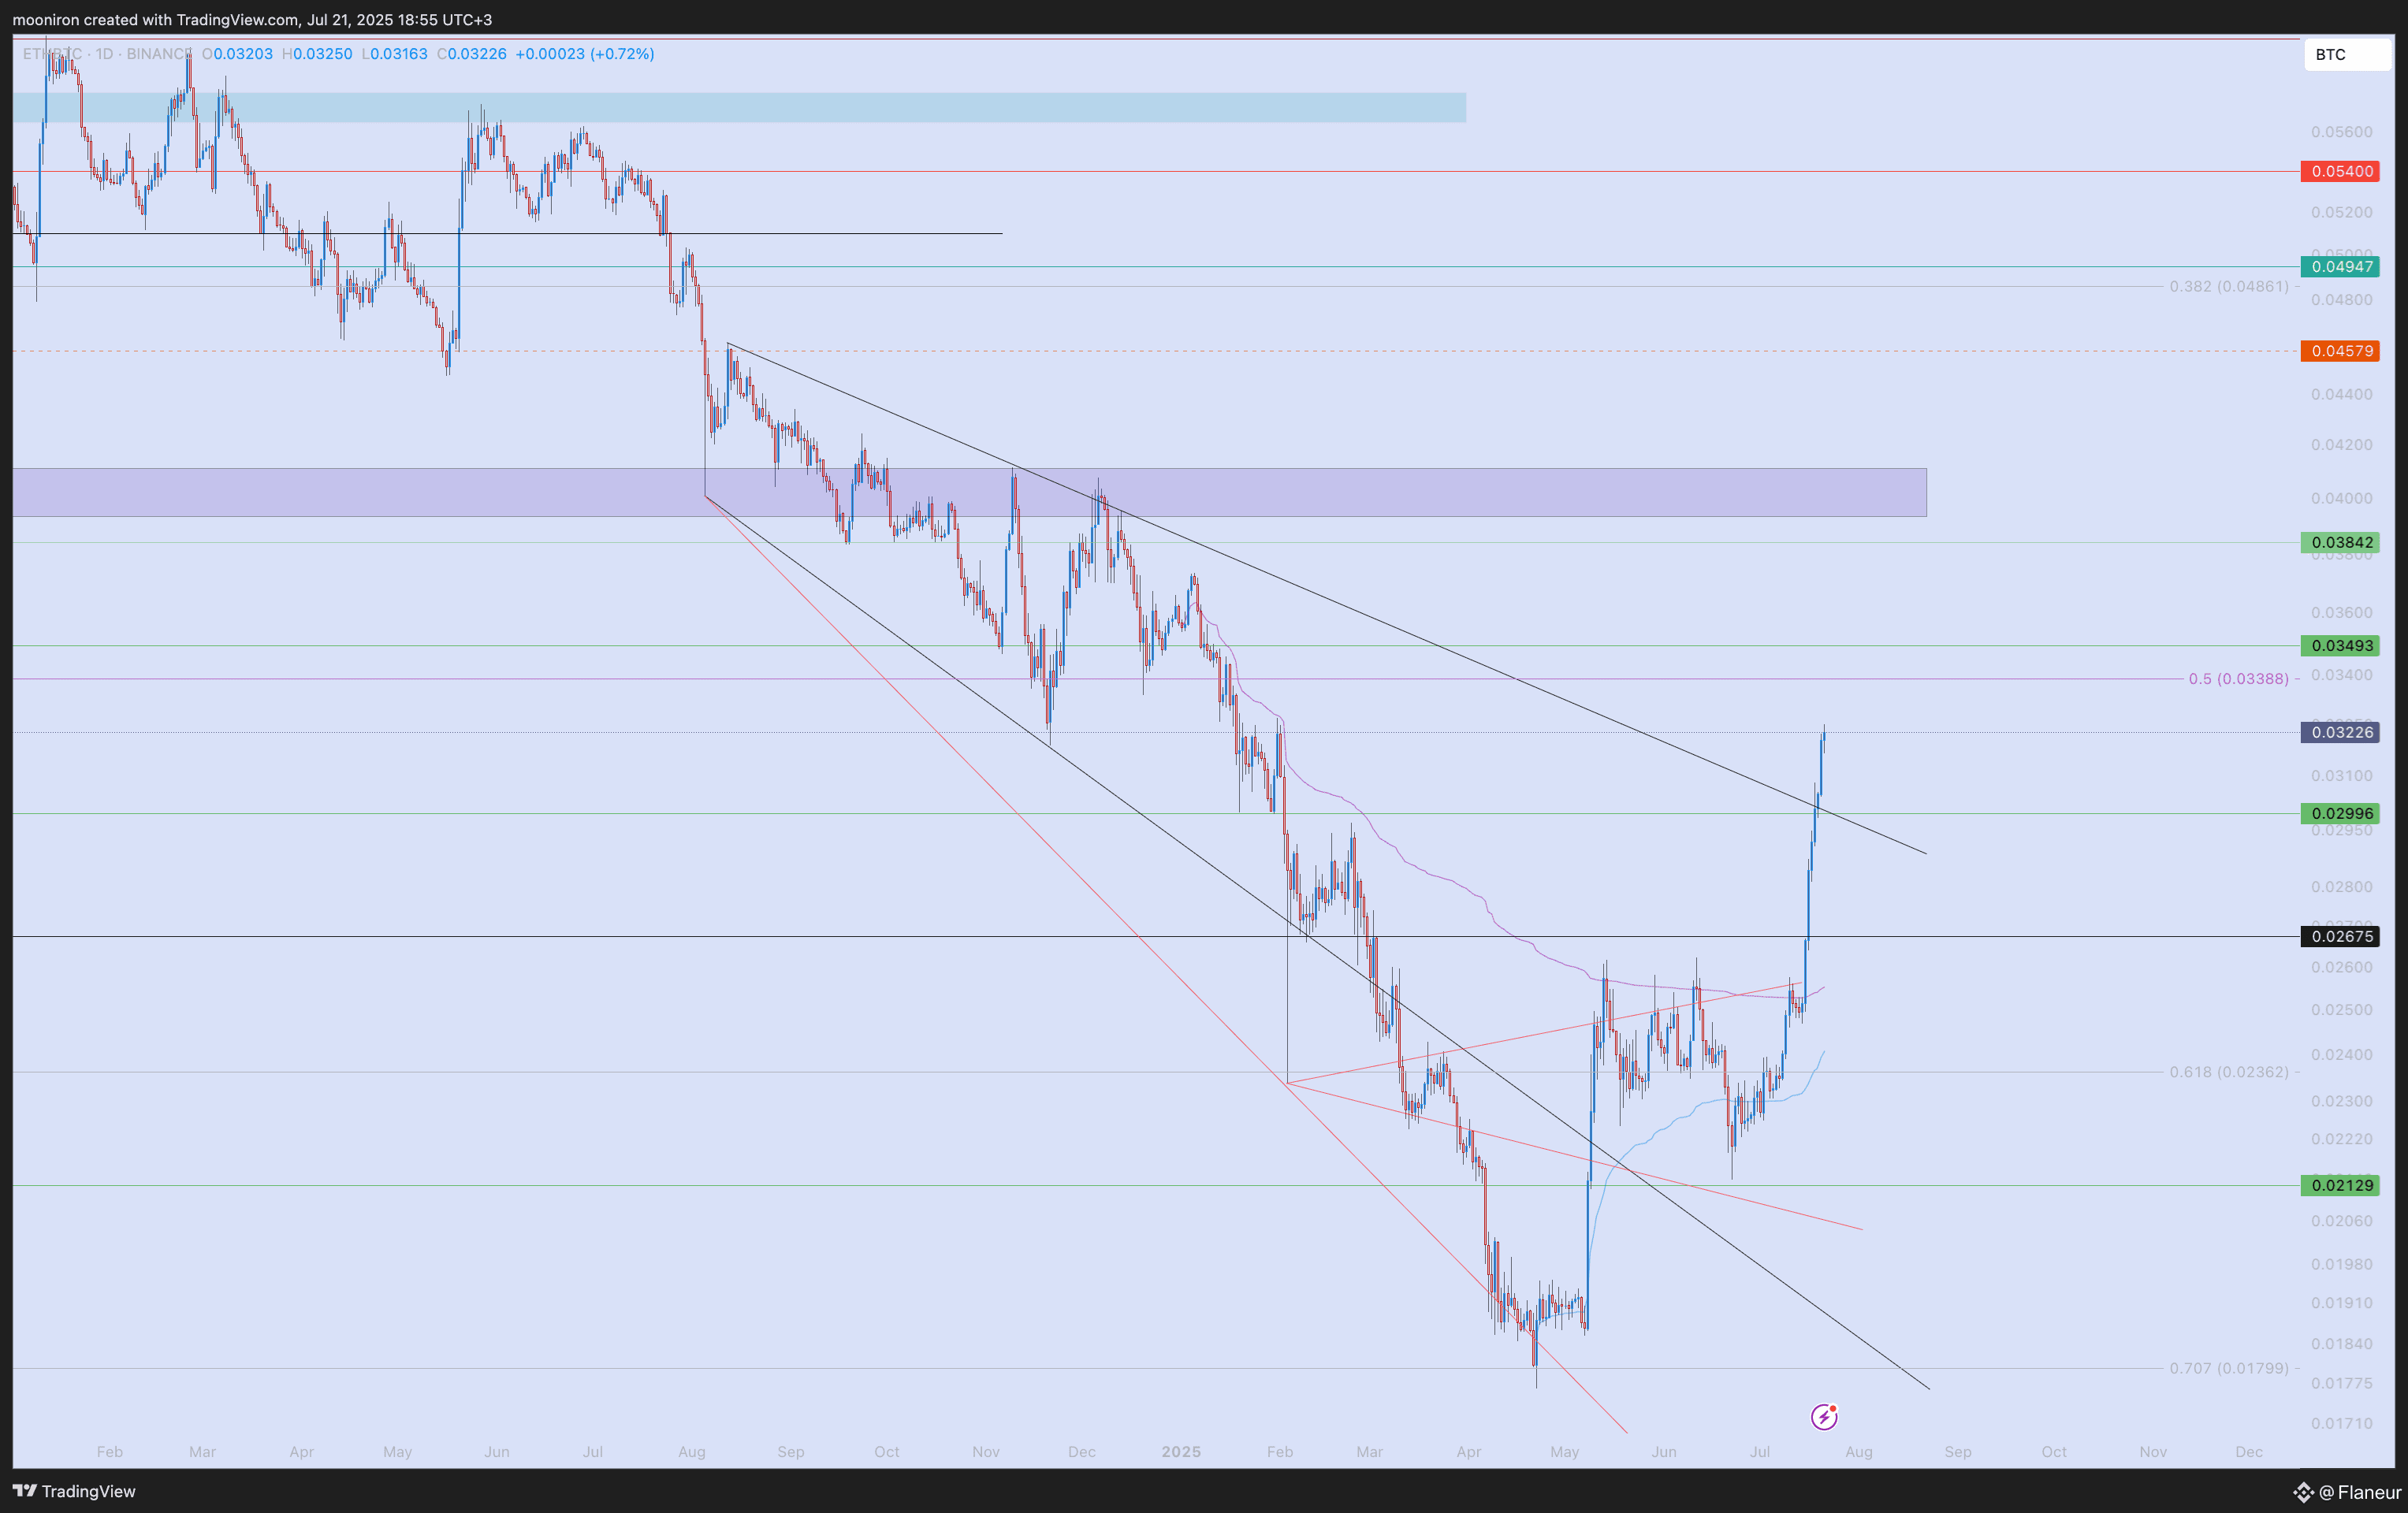
ETH/BTC
With the rally in ETH, the 0.026 and 0.030 resistance levels were broken sharply last week. We can now confidently say that this area is a bottom. Of course, this doesn't mean there won't be pullbacks. However, we have now confirmed, along with the technicals, that ETH will be stronger. For this idea to be invalidated, we would need to see closes below 0.026 and then 0.023. Otherwise, our upside targets are the purple box region at 0.04 and the 0.049-0.050 zone.
#BTCvsETH #ETHBreaks3700 #StablecoinLaw #CryptoMarket4T #AltcoinBreakout

