⏰ Update at 08:47 on 19/07/2025
Looking at chart $BTC , you can immediately see a gentle bounce but full of implications. BTC is currently hesitating around the 118,000 mark after breaking below the 120k area – a quite important psychological level. But the question now is: Has the short-term bottom been formed? Or is it just a weak bounce in a downtrend? Let's examine it more closely:
🕓 4-hour frame – Consolidating after a drop, no clear recovery signal yet
In the 4-hour frame, BTC is trying to form a bottom around the 115.678 area after the drop from the peak of 123.300. Although the most recent candle has a long lower wick and closed above MA7, showing buying support at the bottom, overall the price is still being held back by MA25 and has not broken through the resistance area of 118.5 – 118.8.
The RSI(6) indicator is at 42.9 – neutral, not showing strong buying pressure. MACD is still below the 0 line and the histogram is still negative → selling pressure has not completely ended.
➡️ In summary, the 4-hour chart is in a consolidation phase, and the market is waiting for a clearer direction confirmation.
⏱️ 1-hour frame – There is a recovery force, but it needs to break the nearby resistance to confirm
In the 1-hour frame, BTC has bounced from the bottom of 116.7 back to nearly 118.0, creating a small recovery pattern after a series of strong bearish candles. However, the bullish candle is still facing resistance at MA25 and MA99 right around 118.3 – 118.4.
MACD is showing signs of narrowing the decline, but it is still below 0. RSI(6) has risen to 54.4 – indicating that a recovery is forming, but it still needs time to confirm the trend.
➡️ For me, the 1-hour chart is recovering well, but if it does not decisively break the 118.5 – 119 area, there remains a risk of reversal.
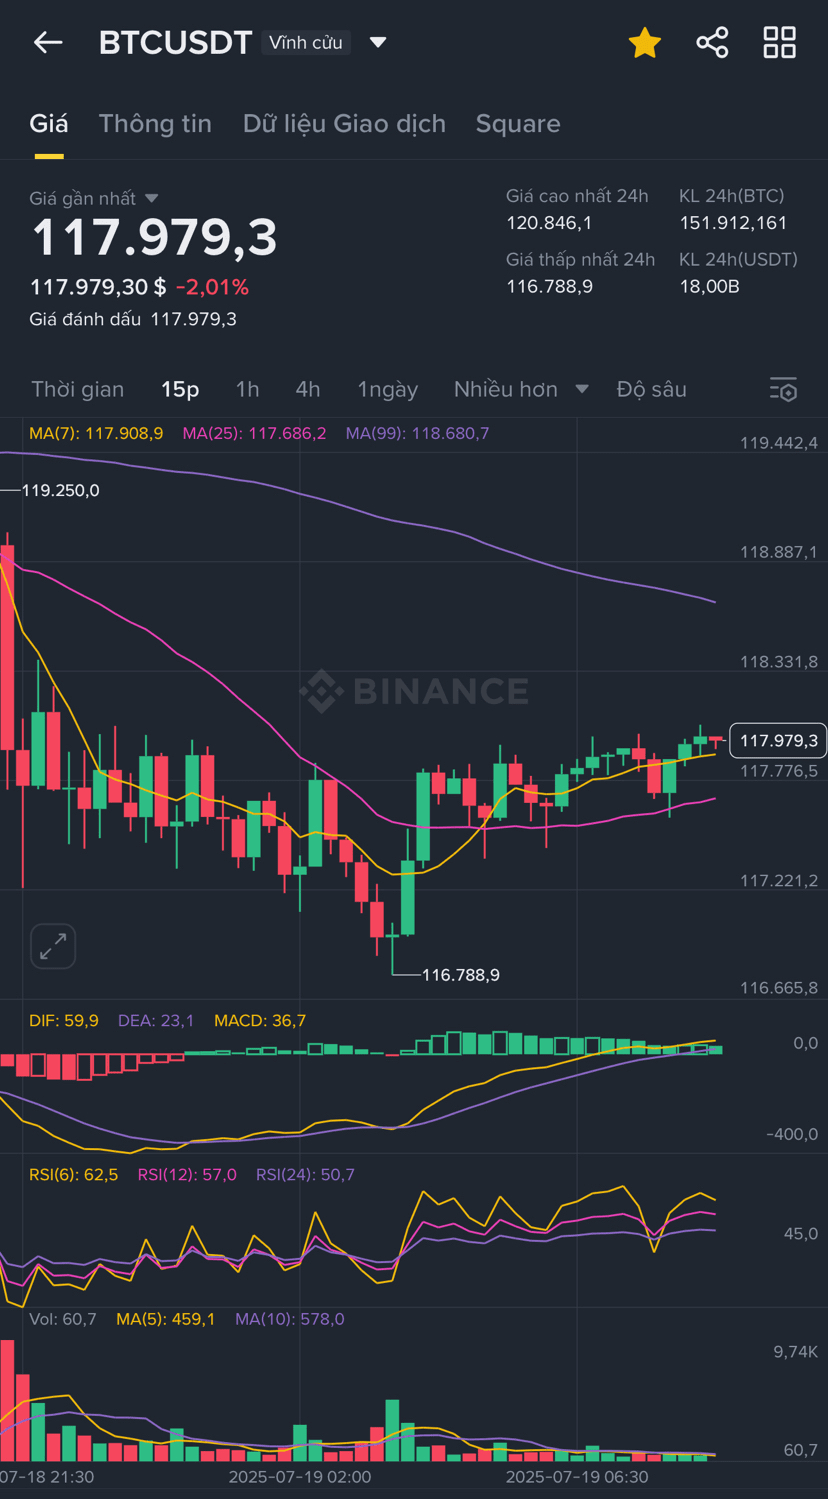
🕒 15-minute frame – Stable increase, but the force is not strong enough to break out
The 15-minute chart shows BTC recovering steadily from the bottom of 116.7 to 117.9, with MA7 crossing above MA25, indicating the short-term trend is shifting positively. RSI(6) reached 62.5 – relatively high but not overbought. MACD also shows a positive signal, indicating that short-term capital is returning.
However, the volume is not breaking out strongly, and the price remains below MA99 – a relatively significant resistance in the 118.6 – 118.9 area.
➡️ I assess that the 15-minute chart is 'slightly green' but not yet a strong bounce. It may need more accumulation or a retest of the 117.7 area before continuing to rise.
📌 Summary of personal perspective:
BTC is showing signs of forming a bottom around the 116.7 – 117.0 area and starting to bounce slightly. However, all three time frames indicate that the recovery force is not strong enough to confirm a complete reversal. If BTC breaks the 118.8 – 119 area, it will open up the possibility of retesting 120 – 121.
Conversely, if it cannot hold 117.7 – 117.5, it may retest the old bottom of 116.7.
🚀 The scenario I'm monitoring:
🔸 Bull case: Break above 118.8 – 119.2 → may retest 120.5 – 121
🔸 Bear case: Can't hold 117.5 → back to 116.7 – 116.3
👇 How are you all watching BTC in this area? Have you entered a trade or are you still observing? Let's share our perspectives!