⏰ Update at 08:07 on 19/07/2025
This morning while watching the chart $ETH , I see the market is in a rather 'sensitive' phase. After a strong surge recently to the 3,674 level, ETH has shown signs of weakening again. The price is currently fluctuating around 3,510 – 3,515, and there are no clear recovery signals yet. So is this just a short pause, or a warning sign for a deeper drop? Let's analyze each timeframe together:
🕓 4h frame – The upward momentum is slowing down, but the larger trend remains positive
The 4h chart shows that ETH has just experienced a very good increase from the bottom of 2,900 to the peak of 3,674, but then followed by 4–5 consecutive red candles, indicating that profit-taking pressure is dominant. Currently, the price has broken through MA7 and is testing the support area around 3,510 – 3,520, which is close to MA25.
MACD is crossing down and the histogram is gradually turning negative, indicating that the upward momentum has weakened. However, the price remains above MA99 (at 2,870), which means the medium to long-term trend is still positive.
RSI(24) is at 69.7, has escaped the overbought area, indicating that selling pressure is starting to regain balance with buying pressure.
➡️ Personally, I see the 4h frame is in a technical adjustment phase, not necessarily a reversal yet. If the price holds above 3,500, it should be fine, but if it breaks, it will be more concerning.
⏱️ 1h frame – Short-term trend is weakening
The 1h chart shows the adjustment trend more clearly. ETH has fallen from the 3,674 area and continuously created lower highs. Currently, the price is below MA7, MA25, and MA99, indicating that the short-term upward momentum has been broken.
MACD has strongly crossed down and the histogram has continuously turned red. RSI(6) is at 31.5, close to the oversold area → indicating that selling pressure is stronger but also beginning to show signs of 'running out of steam.'
➡️ For me, the 1h is leaning towards negative in the short term. However, such a low RSI could also be a precursor for a bounce if buying pressure appears.
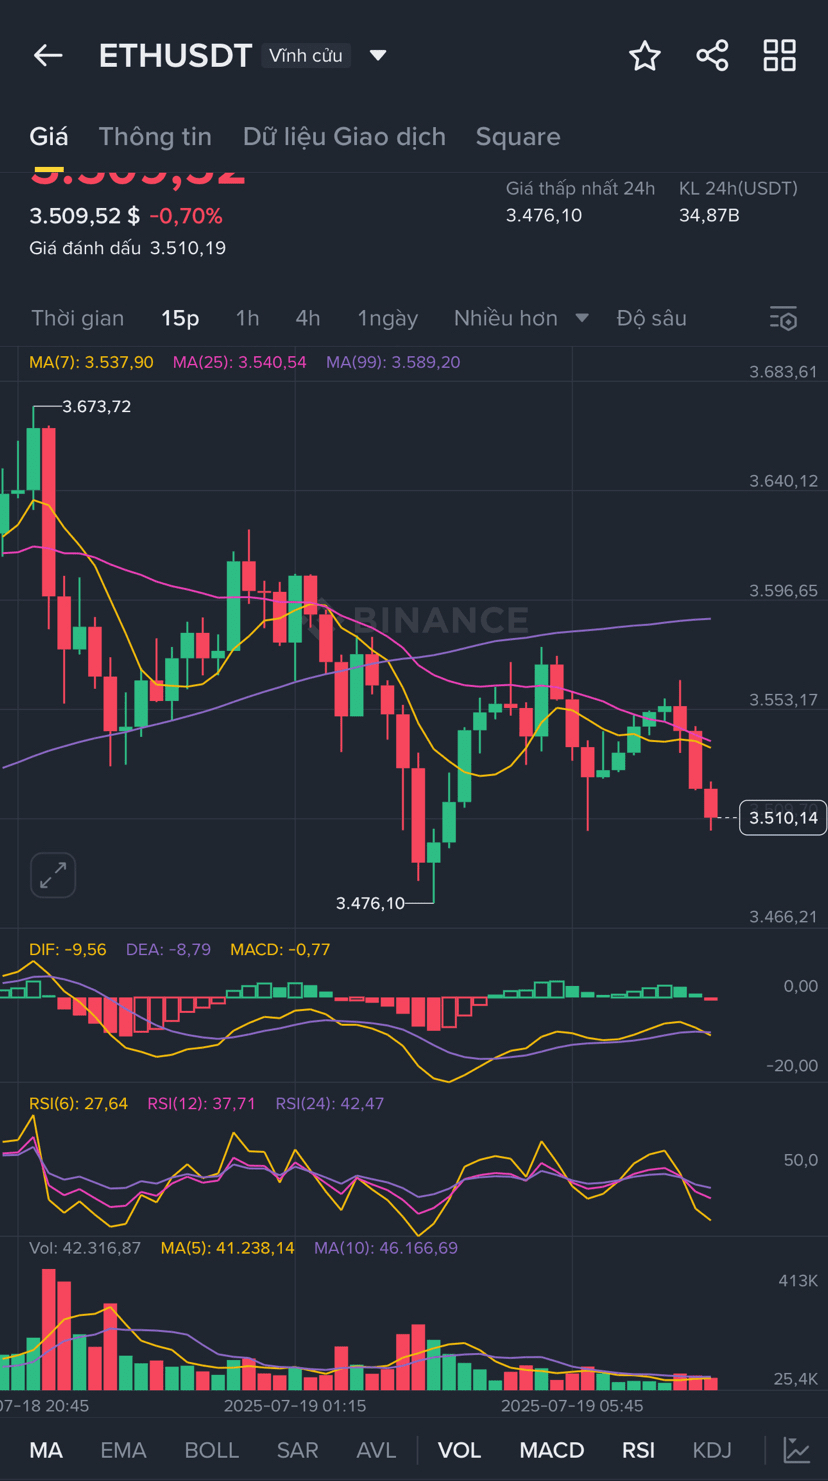
🕒 15m frame – Short-term sell-off, but starting to show signs of balance
In the 15-minute frame, ETH has had a sharp drop from the 3,553 area down to nearly 3,510, followed by a few small-bodied red candles → a sign that the selling side may be 'running out of steam.'
MACD has narrowed the red histogram, RSI(6) has touched 27.6 – falling into the oversold area and starting to recover slightly. This could signal that a short bounce is forming.
➡️ I think the 15m is trying to 'bounce back' slightly, but caution is still needed. If the 3,500 – 3,510 area cannot be maintained, it could drop deeper.
📌 To summarize my personal view:
ETH is in a technical correction phase after a hot increase. The 4h frame remains positive in terms of the larger trend, but the 1h and 15m frames are showing that the selling momentum has not yet subsided. If ETH holds the 3,500 – 3,510 area, then a recovery to the 3,540 – 3,560 area is possible. Conversely, if this level is broken, ETH could fall to the 3,470 – 3,450 range.
🚀 The scenario I am following:
🔸 Bull case: Maintain 3,510 → bounce back to 3,540 – 3,560
🔸 Bear case: Break below 3,500 → test the 3,470 – 3,450 area
👇 What do you think? Will ETH bounce back or continue to fall? Let's share our opinions in the comments!