⏰ Update at 08:27 on 19/07/2025
Looking at the chart $XRP recently, I see quite a few interesting signals. After reaching the peak of 3.6646, the price has had a correction to the 3.38 area and is currently accumulating around 3.45. Is it a 'gathering momentum' or a loss of strength? Let's analyze it further through each frame:
🕓 4h frame – Reaccumulating around the peak, but still slightly blocked at the resistance area
On the 4h chart, XRP had an impressive increase from the low of 2.55 up to the peak of 3.6646. Currently, the price is trading around 3.4557, close to MA7 (3.4630) and still above MA25 (3.1554) → the medium-term trend still leans towards bullish.
MACD is still positive, although the histogram has started to narrow. RSI(6) is at 62.1 – quite strong but not overbought yet. However, the resistance area of 3.66 has not been clearly broken → may need more accumulation power.
=> I see the 4h frame maintaining a good trend, but to go further, a clear breakout through 3.66 – 3.70 is needed.
⏱️ 1h frame – Positive recovery signal, price base is forming
The 1h chart is showing more positive signs. XRP bounced from the recent low of 3.38 back up to the 3.45 range, surpassing MA25 and approaching MA7 (3.4228). The most recent candle is clearly green and closed above a small resistance area.
MACD is gradually narrowing the negative region and approaching the zero line, while RSI(6) is at 59.5 – still room for growth. If XRP holds the 3.42 area and surpasses 3.48, the likelihood of retesting the peak of 3.66 is very high.
=> For me, this is the frame 'suggesting a bullish wave'. Those who like early entries can wait for additional confirmation signals at MA25 or breakout of the 3.48 area.
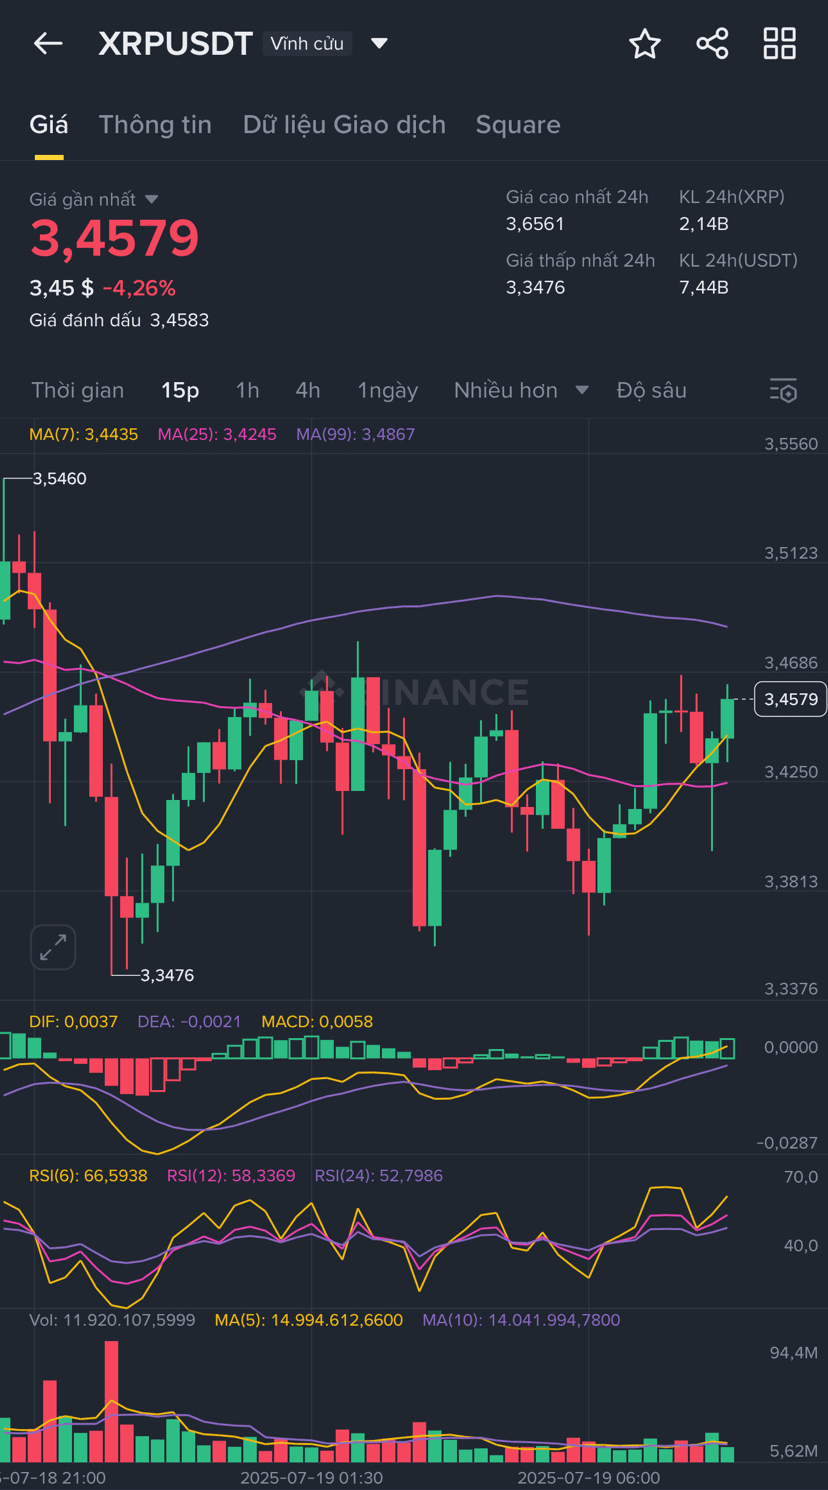
🕒 15m frame – Fluctuating but still maintaining a positive structure
In the short term (15 minutes), XRP fluctuates within the range of 3.42 – 3.46 with several failed tests of the low. Currently, the price has just surpassed MA25 and MA7, MACD has crossed into positive territory, and RSI(6) reached 66.5 – close to the overbought threshold but not diverging.
Volume is stable, with no signs of strong sell-off. I assess this as a sideways accumulation area, likely to breakout if it surpasses the light resistance zone of 3.468 – 3.47.
=> The 15m shows that selling pressure is not too strong and it might be a 'break between stages'.
📌 Summary of personal viewpoint:
XRP is accumulating again after a strong increase. Both the 1h and 15m frames show signs of buying power returning, while the 4h still maintains a medium-term bullish trend.
If XRP maintains the support area of 3.42 – 3.43 and breaks 3.66, the bullish wave could continue to push the price to the range of 3.75 – 3.80.
🚀 The scenario I am monitoring:
🔸 Bull case: XRP holds 3.42 – breaks 3.66 → moves towards 3.75 – 3.80
🔸 Bear case: Does not exceed 3.48 → adjusts to the support area around 3.38 then we will consider further
👇 Those holding XRP, what to watch for? Break or take profit? Share your perspective!