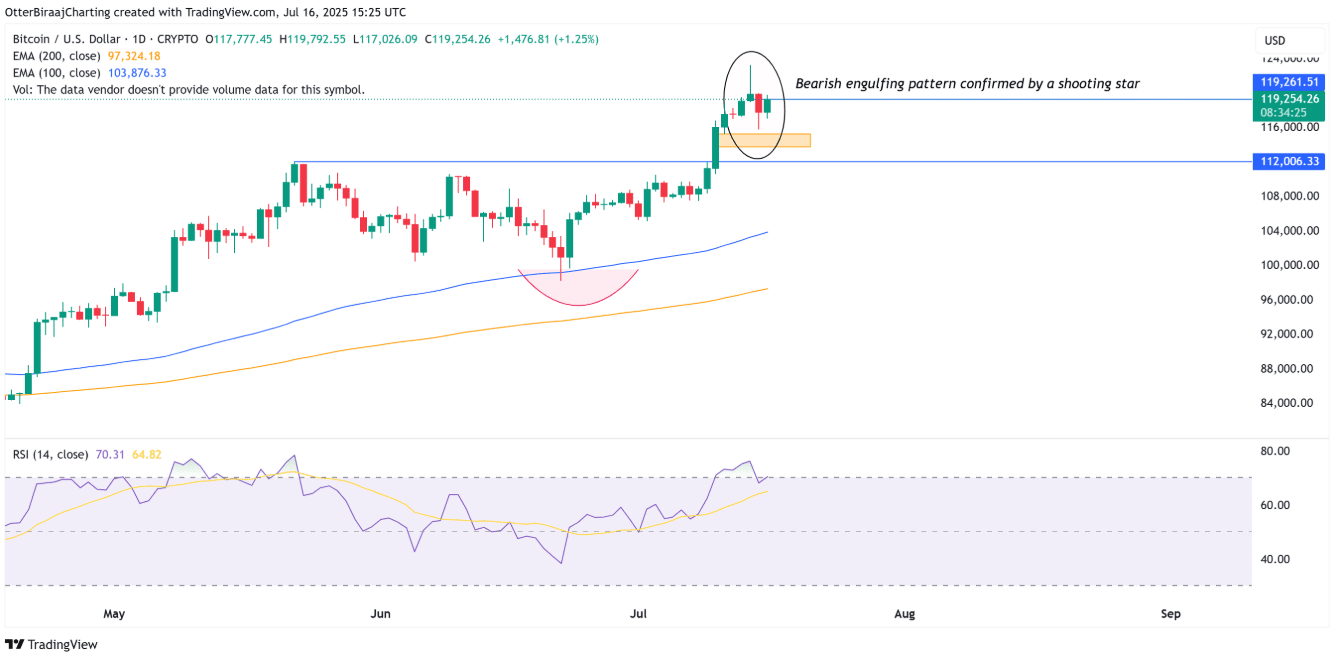
Bitcoin (BTC) has just issued its first clear bearish signal on the daily chart since early May, forming a bearish engulfing candle pattern – reinforced by a shooting star pattern. This move comes right after an impressive price increase of 19% within 21 days, suggesting that the bullish momentum may be gradually diminishing.
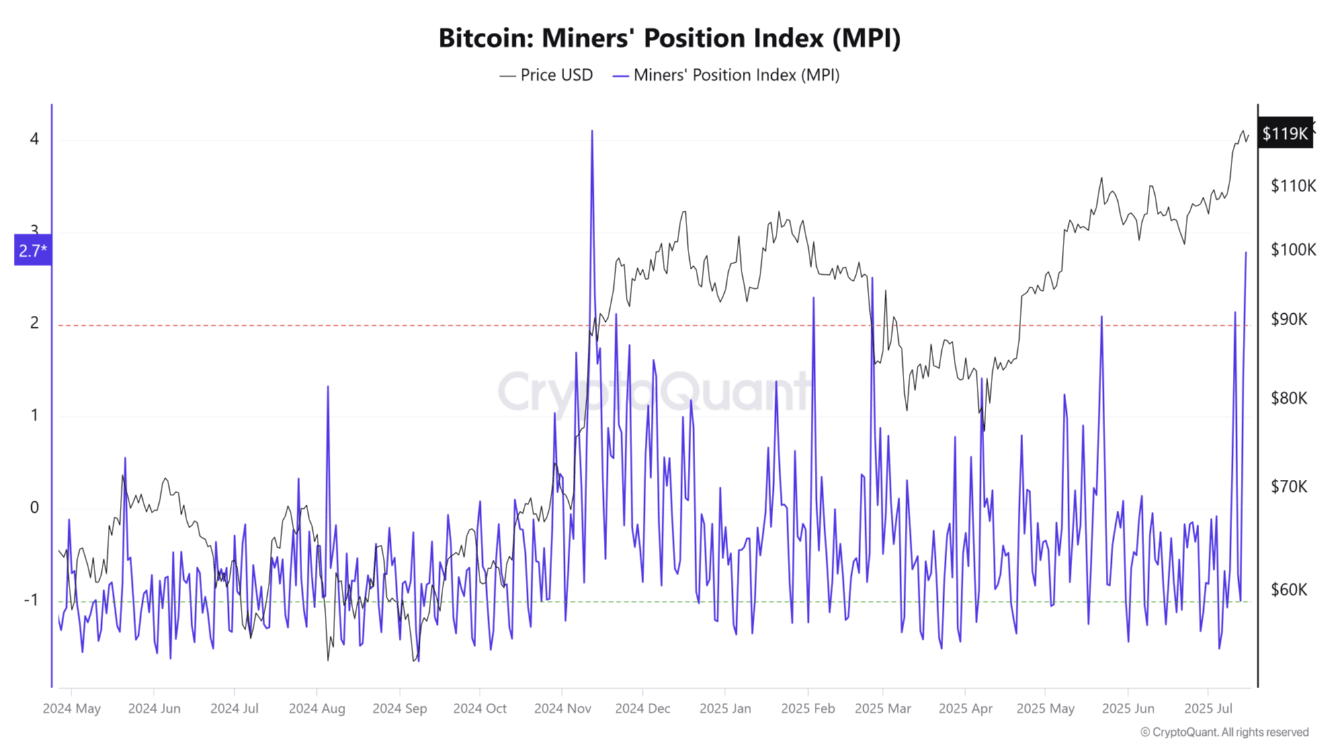
According to data from CryptoQuant, the Miners’ Position Index (MPI) has surged to 2.78 – the highest level since November 2024. This index reflects the ratio of Bitcoin transferred by miners to exchanges compared to the average over a year. When the index exceeds the threshold of 2, it is often a signal that selling pressure is increasing – a factor that could cause prices to face resistance in the short term. However, the current MPI is still quite far from the historical peaks recorded in previous bull cycles.
The technical picture becomes more cautious as the realized P&L from Bitcoin deposited on centralized exchanges has reached a record level of $9.29 billion – a sign that the profit-taking wave is occurring strongly. According to analyst Crypto Crazzyblockk, the resonance of these indicators suggests that the market is entering a high-risk zone, where short-term volatility may increase – although the long-term upward trend has not yet been broken.
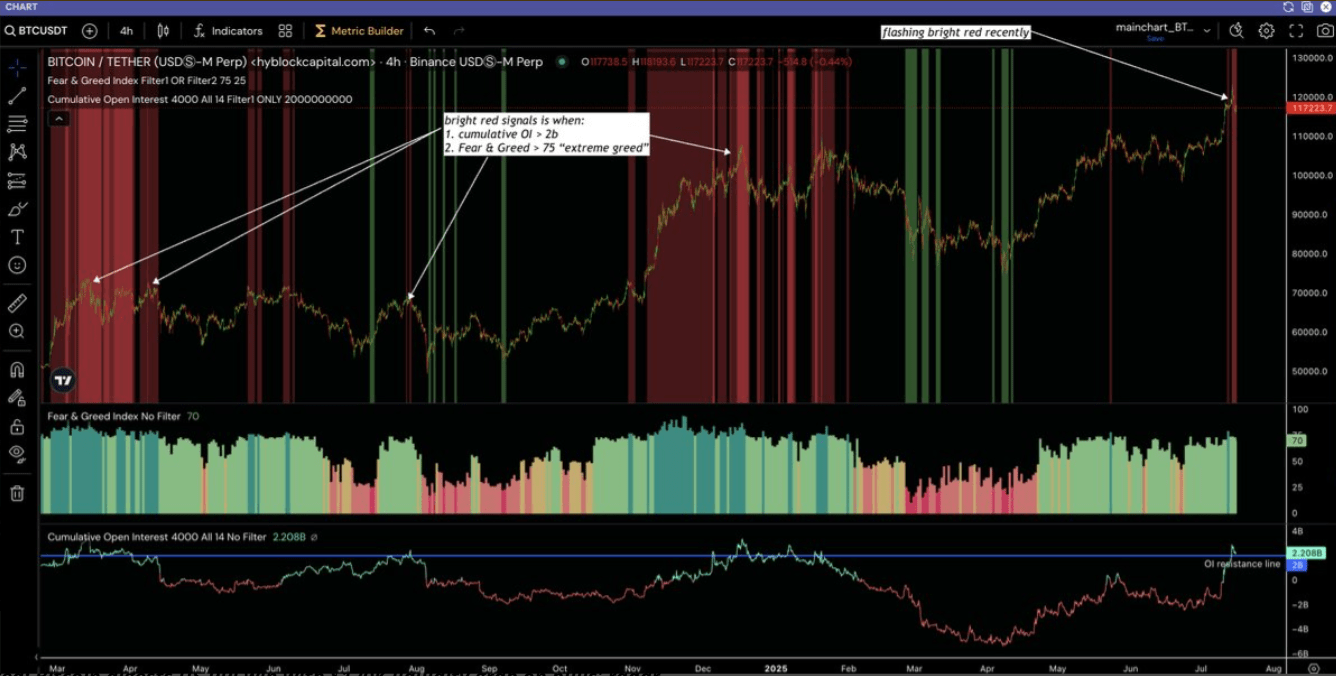
From a derivatives perspective, the Hyblock Capital platform warns that open interest (OI) in Bitcoin contracts is approaching the "bubble zone." History shows that when this occurs simultaneously with the Fear & Greed Index falling into the "Extreme Greed" zone, the market often creates local peaks and then adjusts sharply. The "strong red points" are the moments when these two signals appear simultaneously. However, these signals often hold validity over a broader time frame, so investors should not rush to make trading decisions.
Is it time for Bitcoin investors to worry or hold firm in their beliefs?
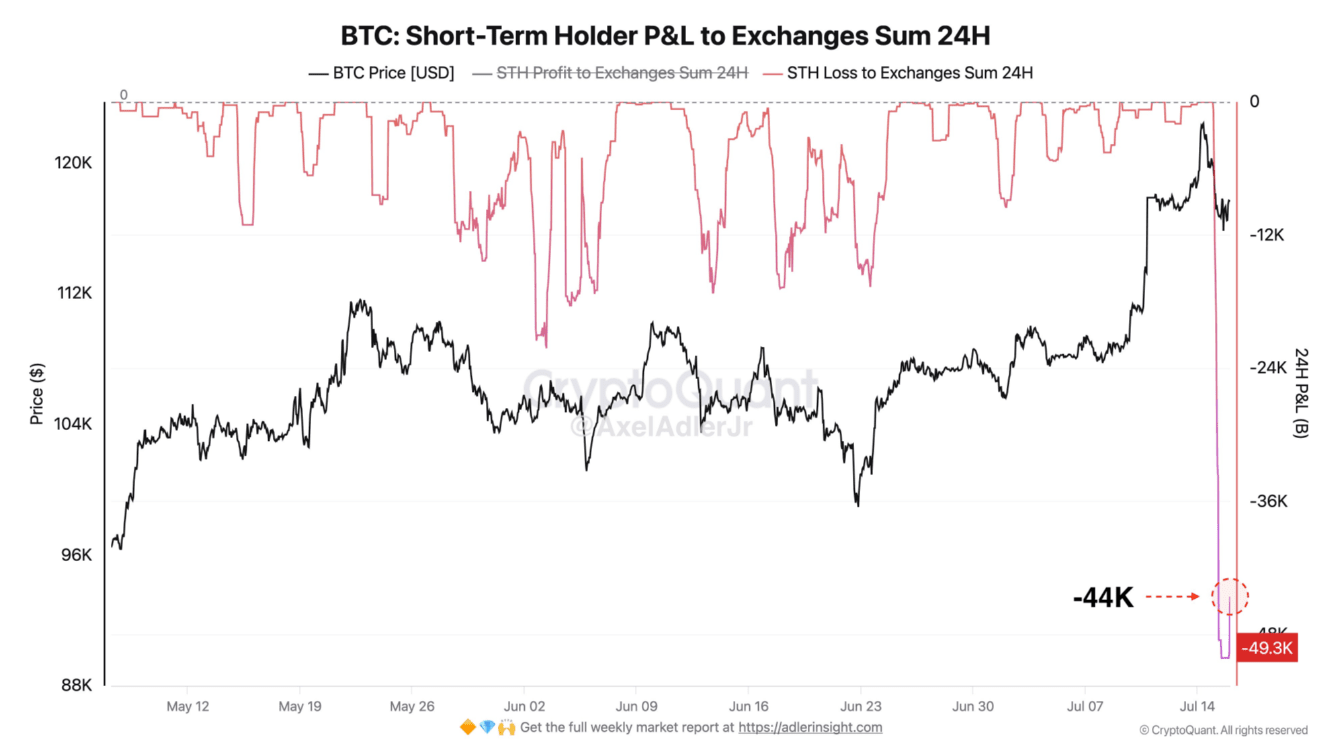
Bitcoin's recent price drop has triggered a wave of panic selling, with nearly 50,000 BTC sold at a loss in just 24 hours, according to data from analyst Axel Adler Jr. This development clearly reflects the anxiety and impatience of investors as BTC suddenly falls from recent peak zones.
However, beneath the surface of the panic lies a decisive buying force. The cost basis distribution heatmap shows that investors have taken the opportunity to accumulate over 196,600 BTC – equivalent to more than $23 billion – in the price range from $116,000 to $118,000. This is a clear sign that long-term confidence still exists, despite short-term volatility.
Technically, Bitcoin still maintains a positive growth structure as long as the price holds above the important support zone of $112,000. After a nearly 19% increase, a slight or sideways adjustment period is necessary for the market to "cool down," reduce high leverage, and eliminate impatient investors.
Although the recent bearish engulfing candle pattern may signal a temporary weakening in upward momentum or a potential short-term reversal, it is not enough to break the main trend. As long as the support zone around $112,000 is protected, the probability of Bitcoin returning to an upward trend remains high.