In the cryptocurrency market, the purchasing power driving Ethereum and Bitcoin shows significant differences. Bitcoin's market momentum relies more on the continuous entry of 'new buyers', while Ethereum's core purchasing power comes from 'faith buyers' and 'aggressive buyers', with the participation of new buyers being relatively scattered, especially in the pullback bottom range of March to April, where it is almost hard to find their trace.
From the characteristics of market initiation, ETH is often first driven by 'faith buyers', followed by 'aggressive buyers' stepping in; this contrasts sharply with BTC—BTC's pullback bottom is often a signal for 'new buyers' to actively enter.
Focusing on recent market dynamics, since July 2, 'aggressive buyers' have been continuously active in buying ETH. Although some profit-taking chips chose to cash out during this period, the current purchasing power is sufficient to absorb the selling pressure, which has also kept the price of ETH relatively stable.
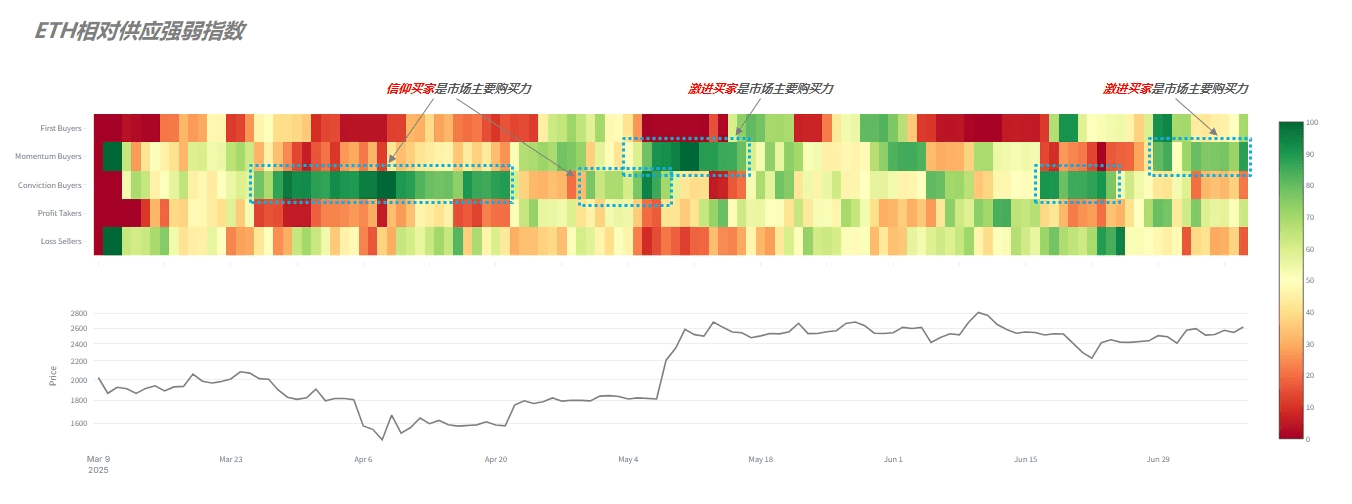
(Figure 1)
Further analyzing ETH's chip structure from CBD data reveals the capital trends at key nodes. On July 1, when ETH pulled back to $2400, the whale group with an original cost of around $2600 suddenly increased its holdings significantly. After cost averaging, it was about $2533, and this action caused the chip accumulation at this price point to increase from 1.43 million to 2.94 million. Therefore, it can be judged that around $2500, a key point with capital support has formed.
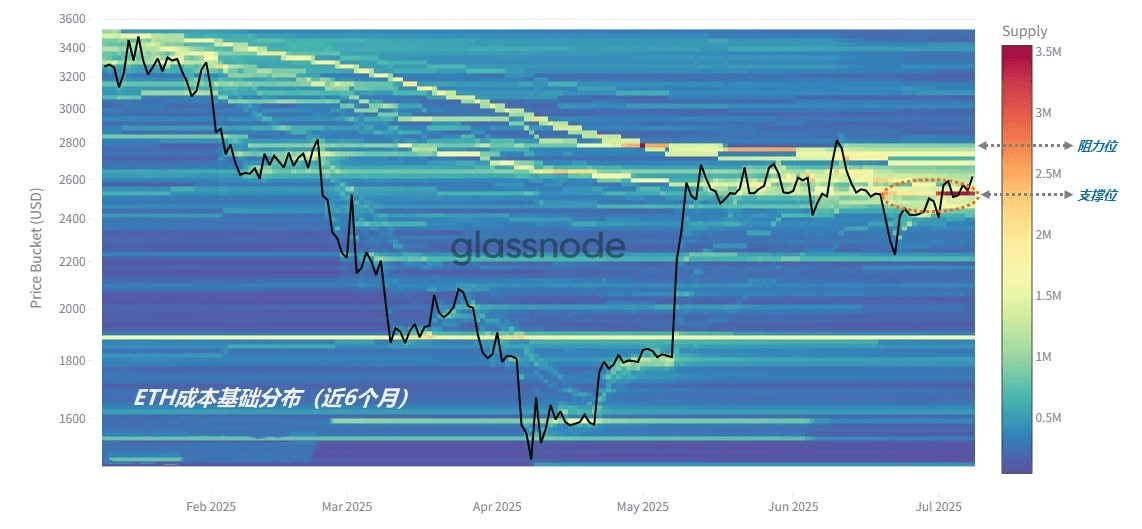
(Figure 2)
The pressure zone above is concentrated at $2700-$2800. The chips in this range mainly originate from the average cost area formed by continuous replenishment after being stuck at a high position in January 2025. Due to the large volume of chips, when the price of Ethereum approaches this range, the firmness of the stuck positions will be the key to whether it breaks through or not; therefore, this range is regarded as a short-term resistance level.#以太坊ETF