Hey everyone, and welcome to the second week of July. As we saw from the data, we left the first week behind with very calm and compressed price action. The market continues to bide its time, accumulating within a narrow range. This "calm before the storm" situation is revealing some interesting signals in both the technicals and the options data. Let's take the pulse of the market with this week's data and charts.
Bitcoin (BTC)
Last week's summary clearly laid out the general market sentiment: although the Fear & Greed Index showed "Extreme Greed" at 73, the price action was quite stagnant. The week only managed to close in the green thanks to a weekend rally. This situation shows that while investors are optimistic, they are waiting for a catalyst to open new positions.
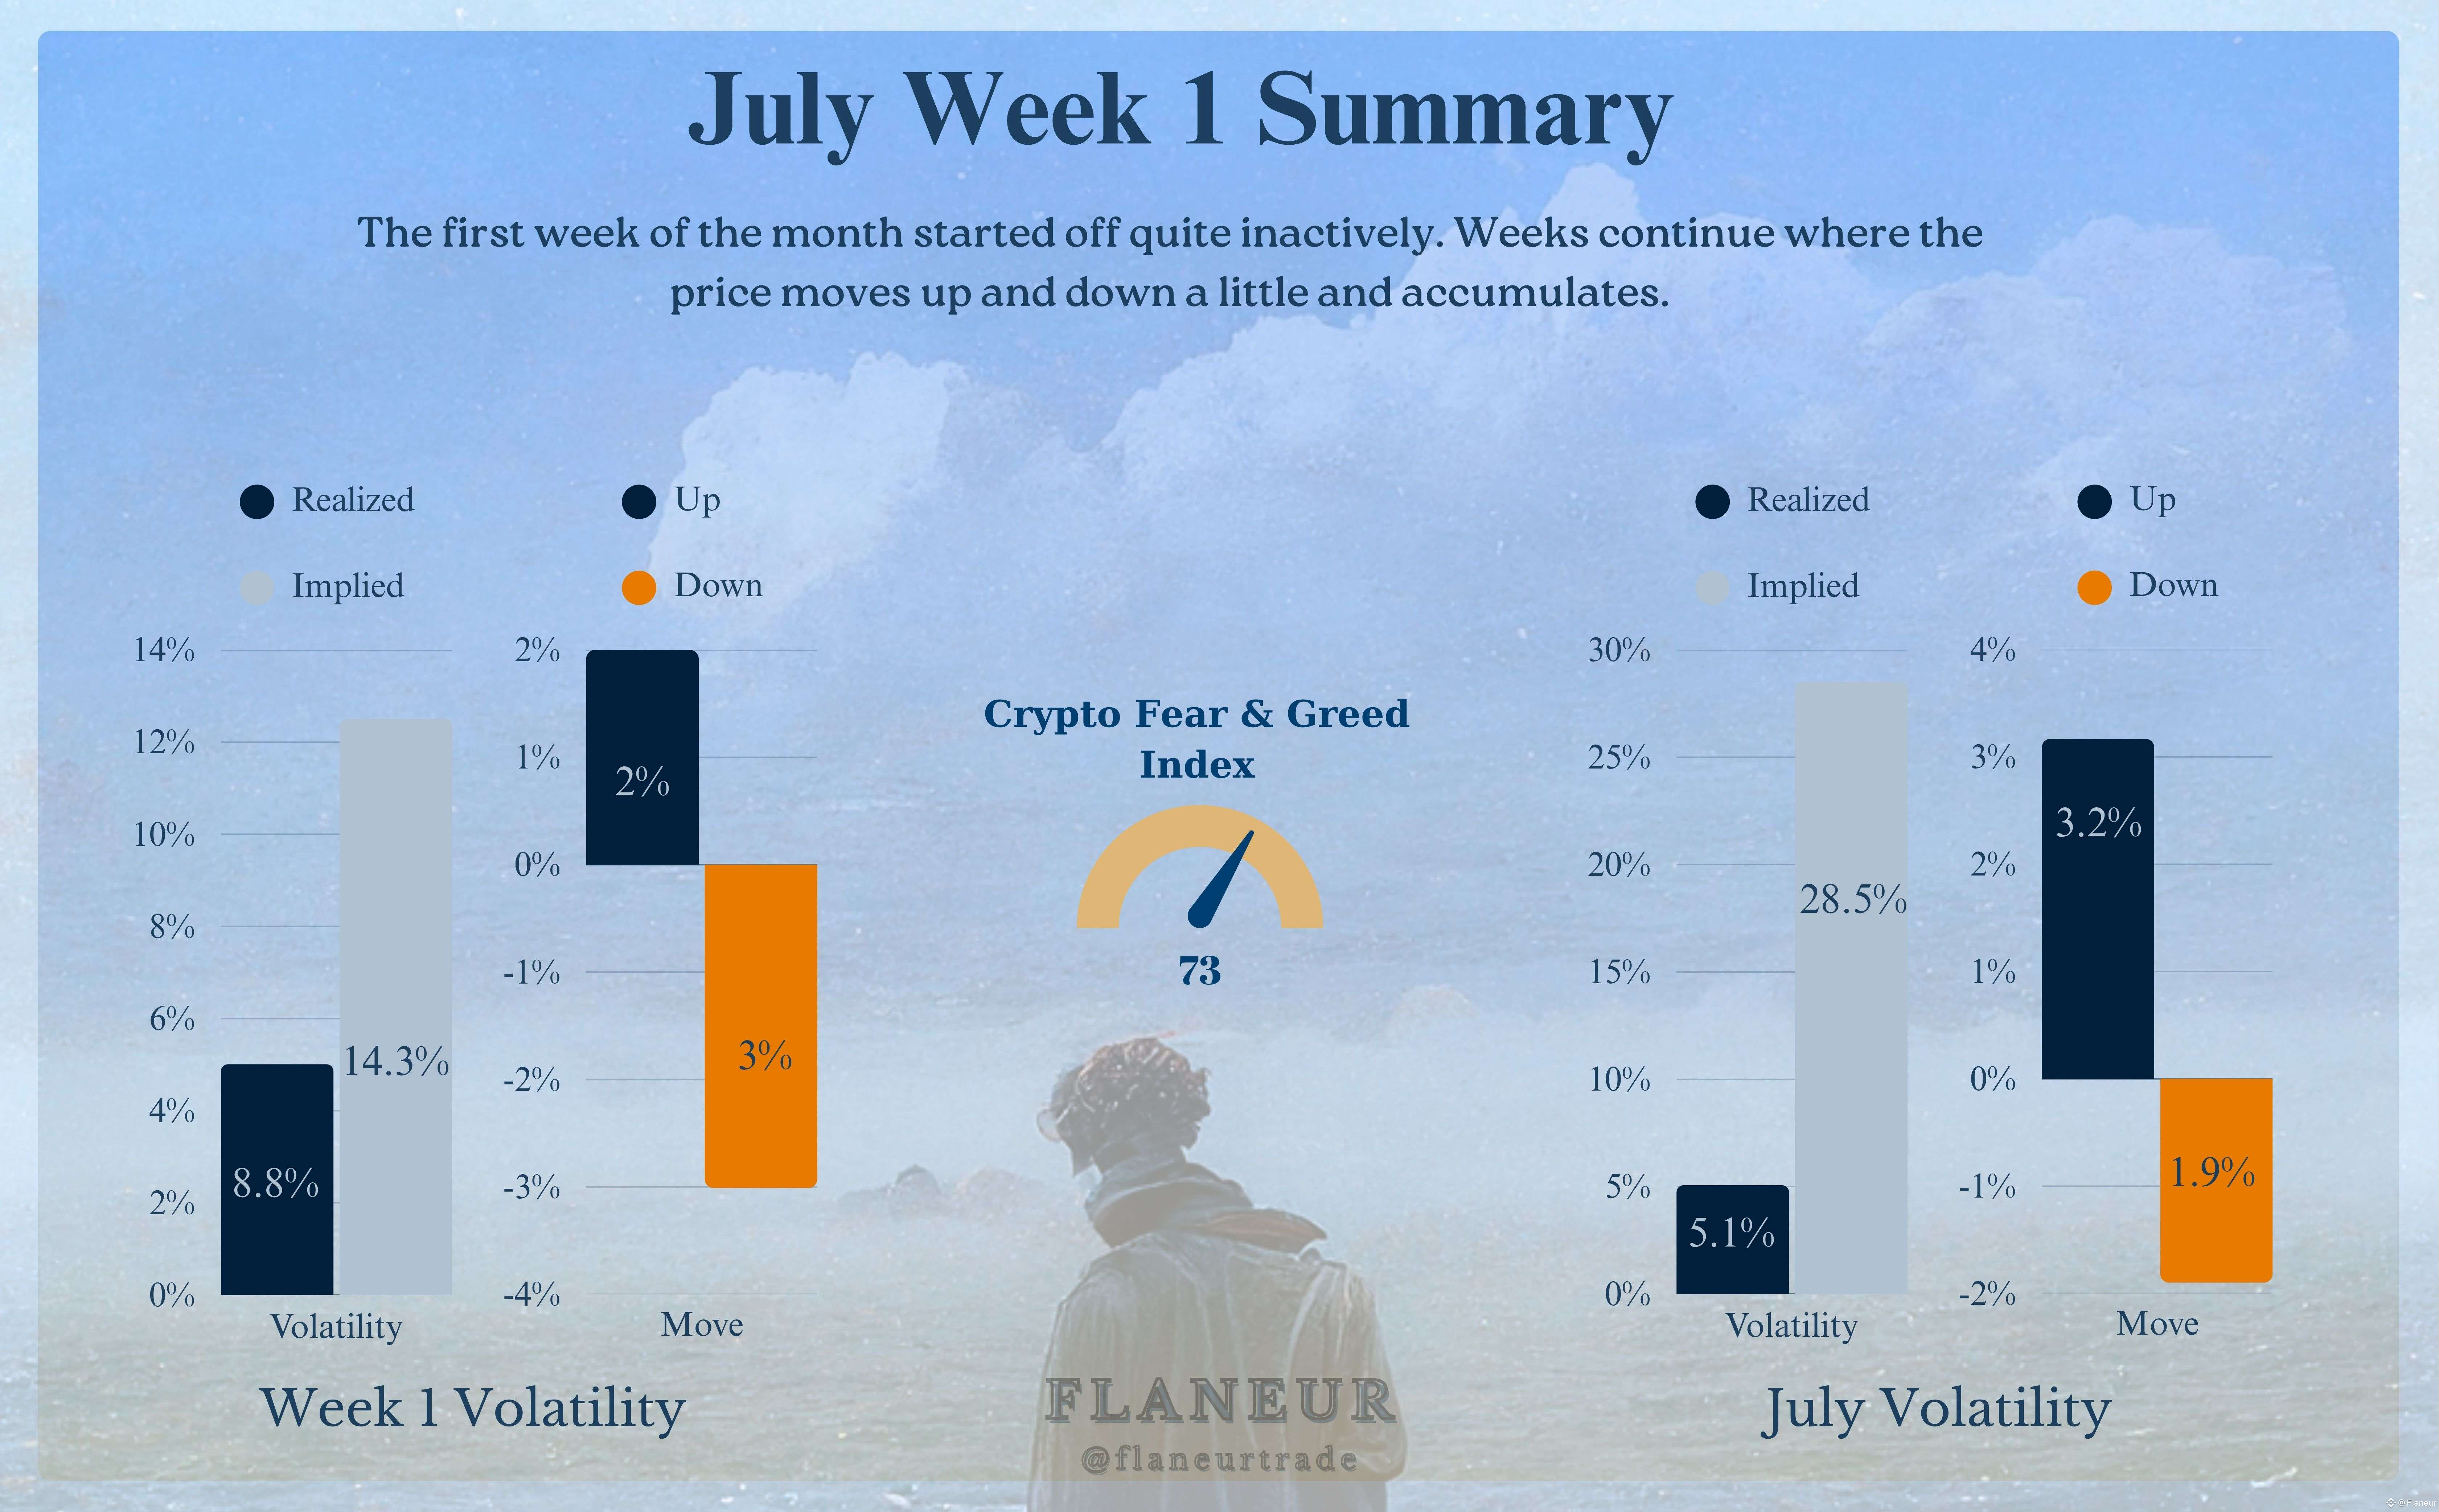
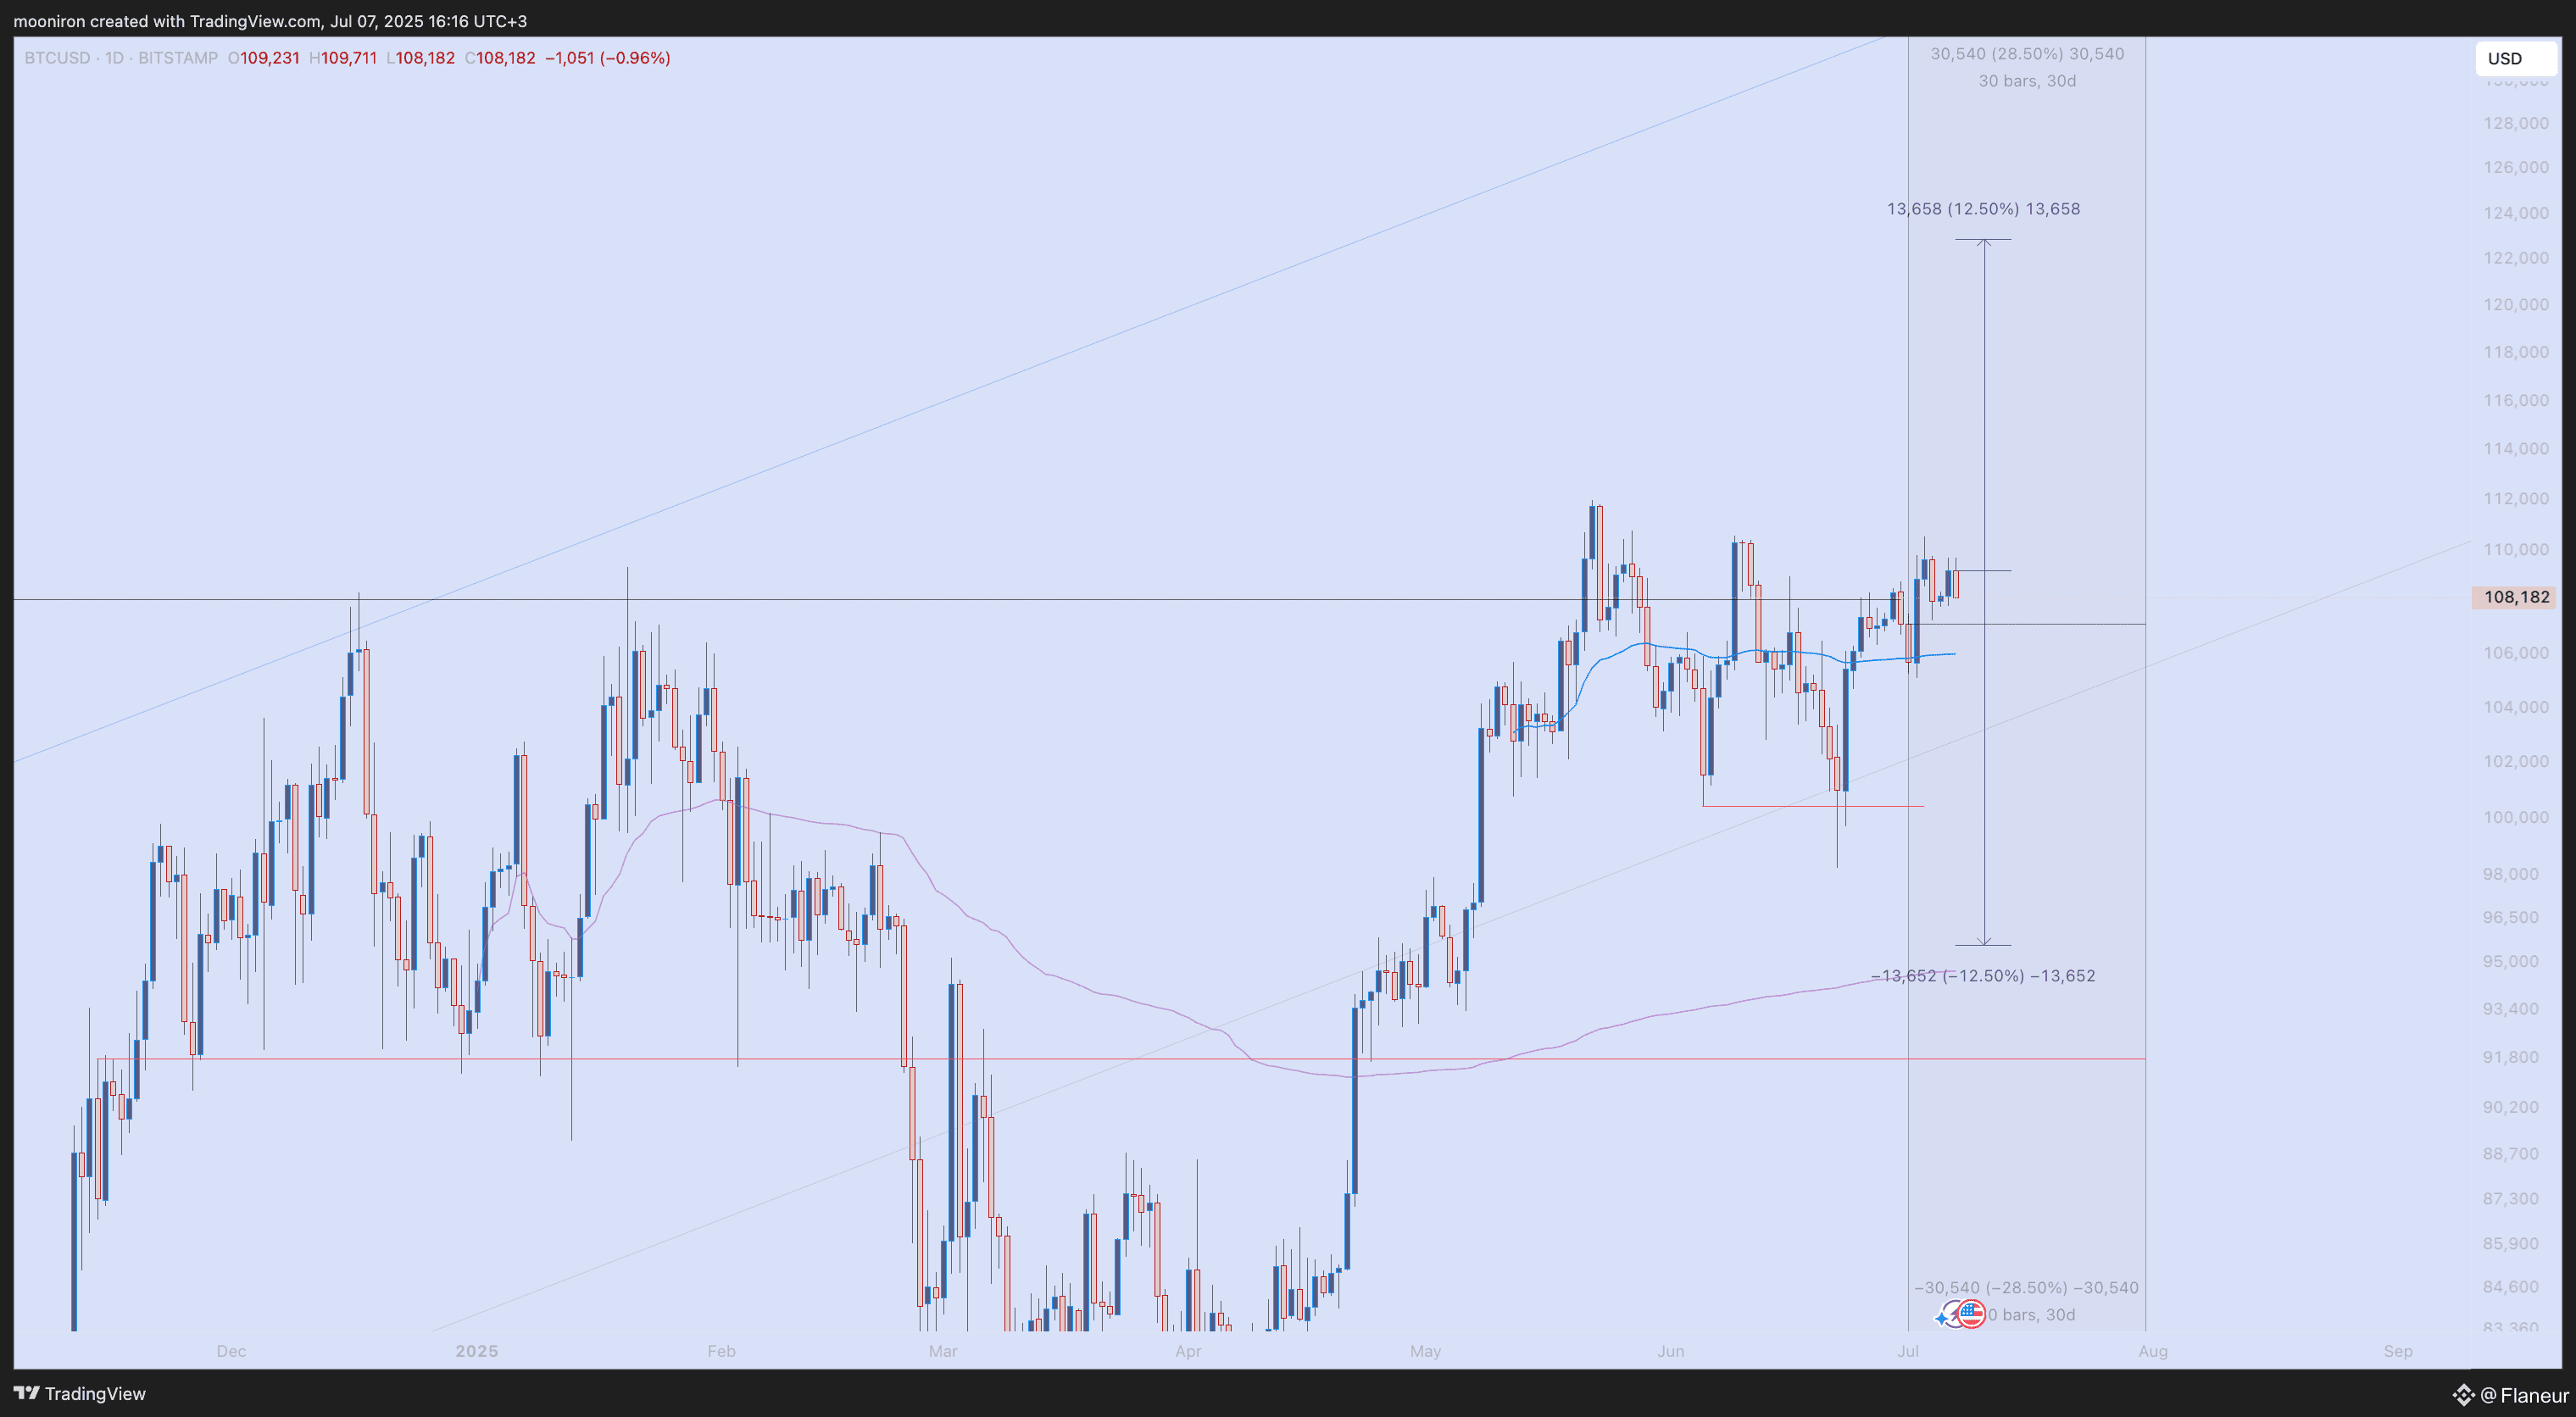
With every rally, excitement builds, only for the price to pull back again. The price is moving in an increasingly smaller range, while a stronger resistance zone awaits above. The longer this compression lasts, the more powerful the eventual breakout is expected to be. I personally think it's not wise to have high expectations until the ATH is broken with significant volume. This week's implied volatility range is almost the same as last week, between $95.6k and $123k.
Options Market Data:
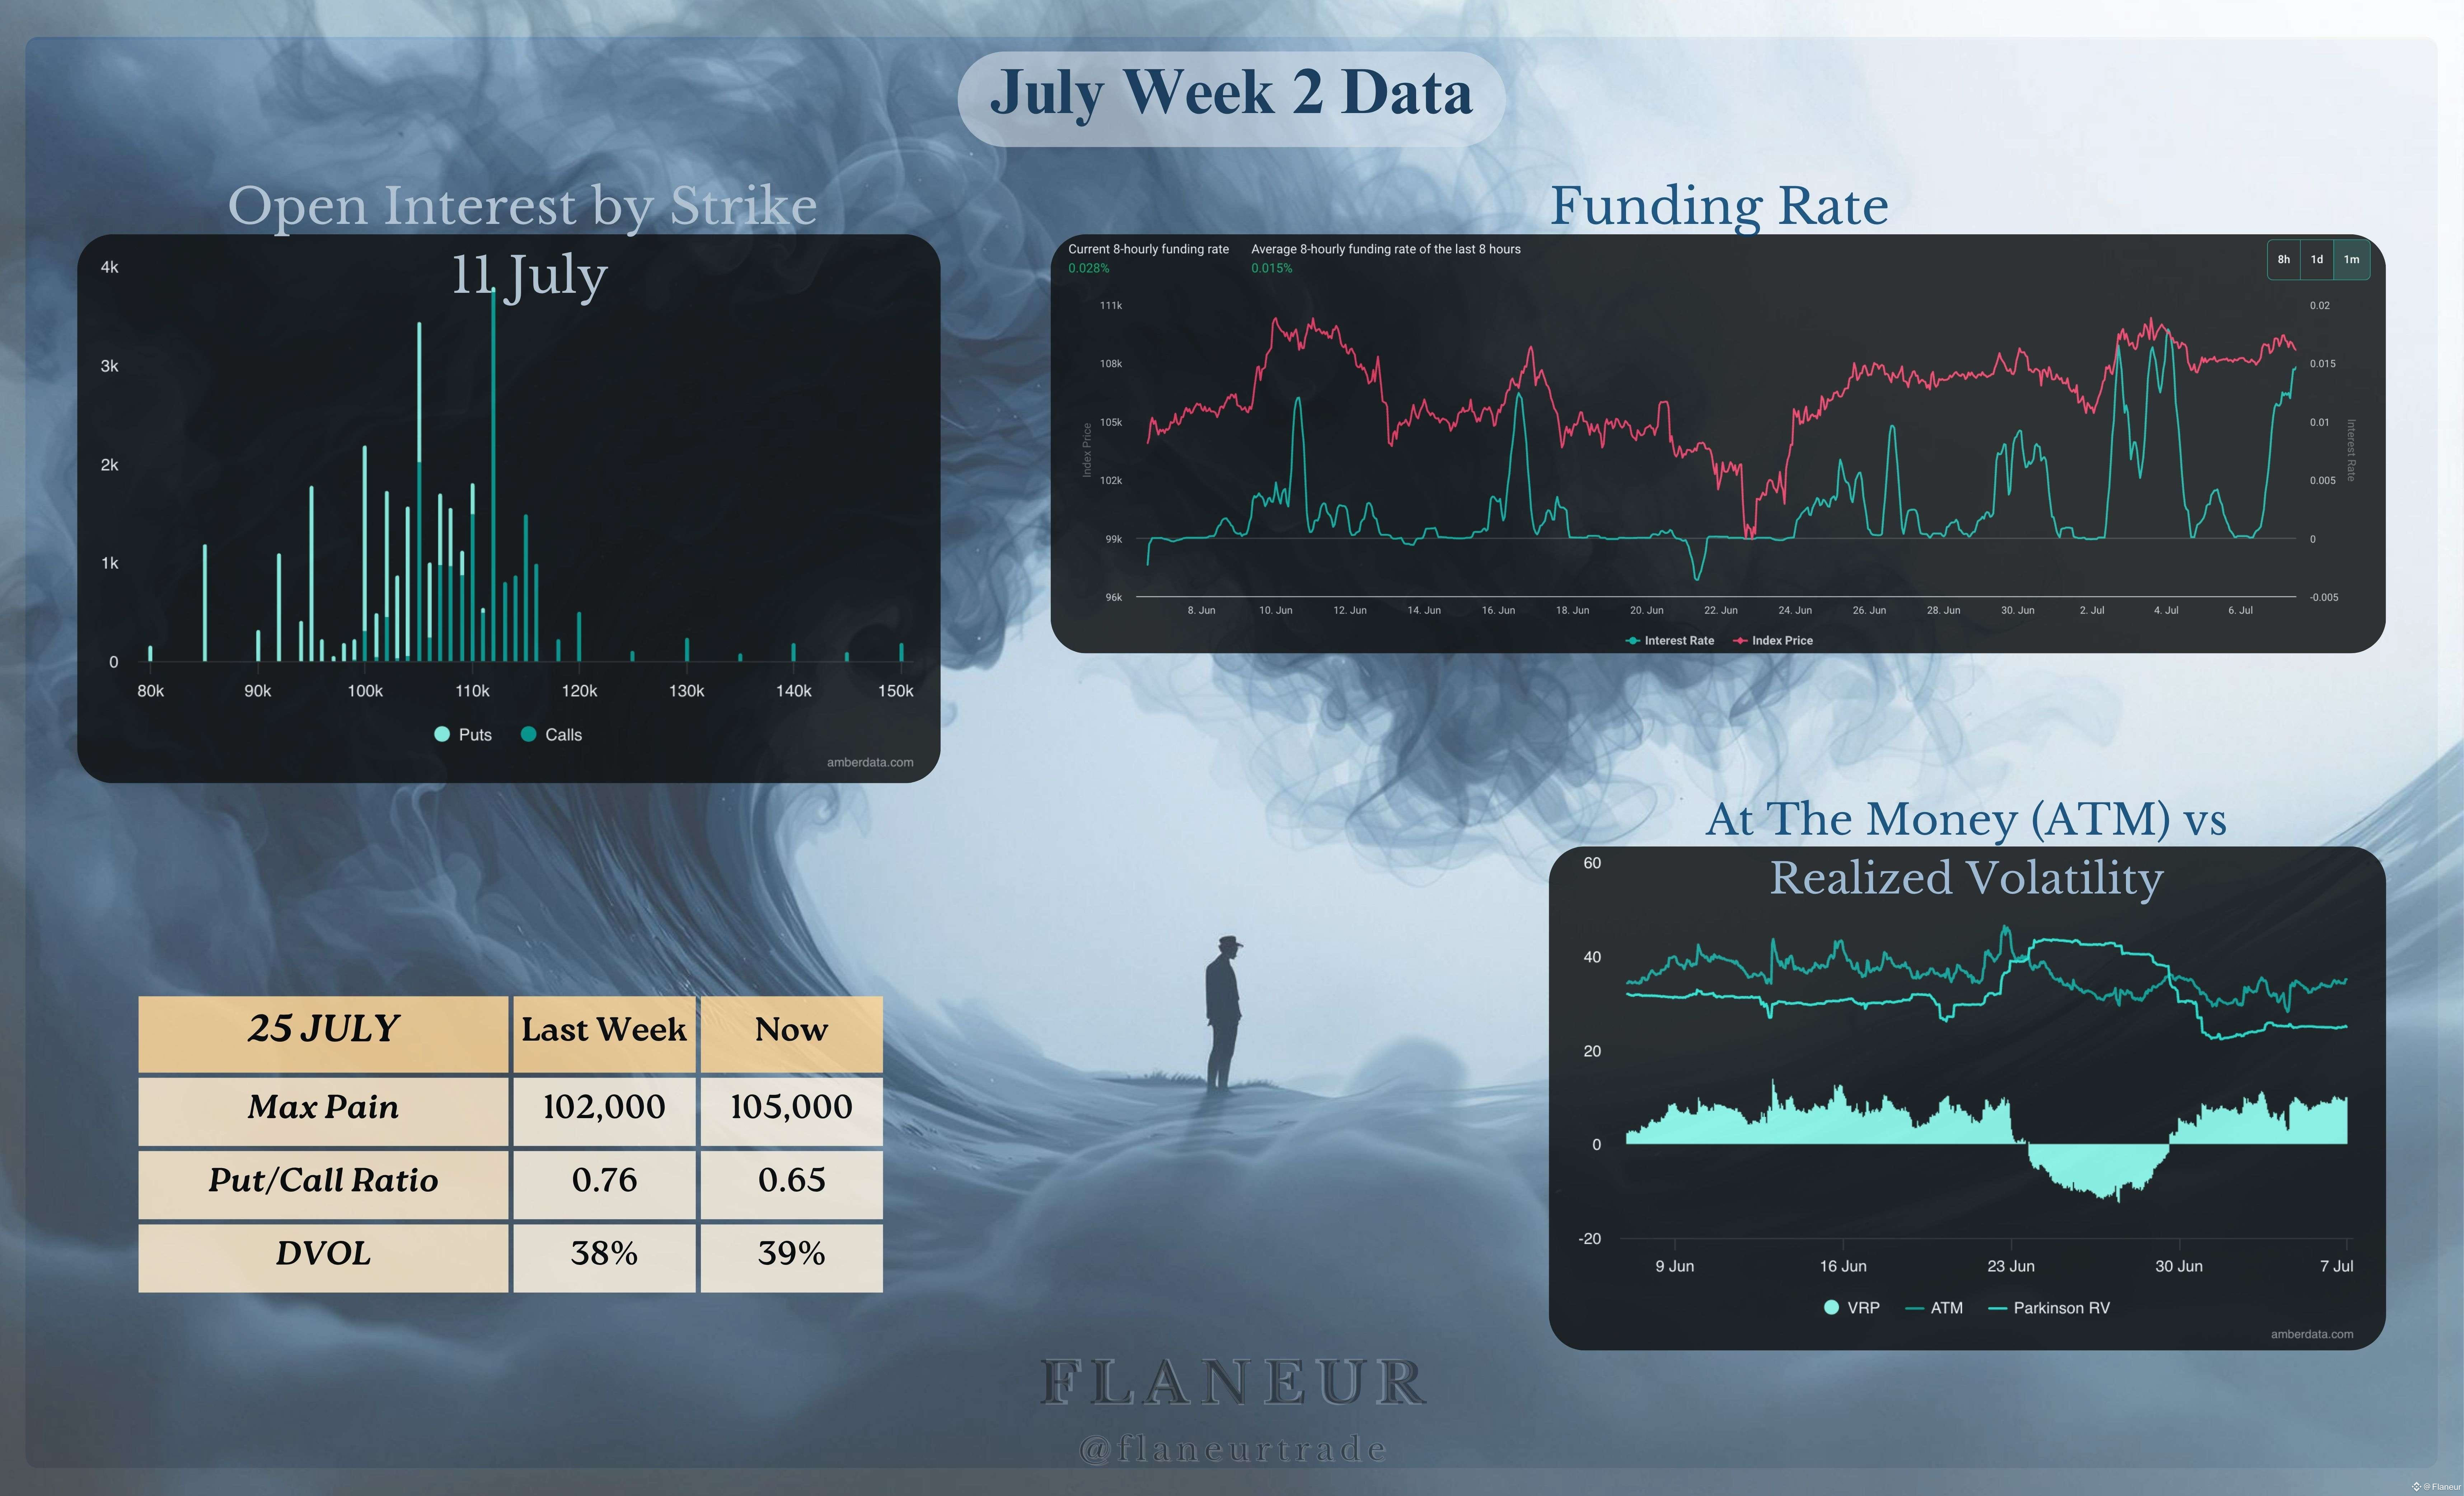
Max Pain (July 25 Expiry): Remains fixed at $105,000, showing that this area continues to act as a "price magnet."
Put/Call Ratio: This was the most volatile data point of the week. The ratio dropped from 0.76 last week to 0.65. This is a bullish signal, indicating that demand for "Put" (sell) options is decreasing while demand for "Call" (buy) options is increasing. The market is pricing in less downside risk and is willing to pay a higher premium for a potential upward move.
DVOL: Staying at 39%, it remains near historical lows. If you are expecting a move, now is the perfect time to buy contracts, because when expected volatility is this low, contracts are at their cheapest.
Funding Rate: It has started to rise. I think we will soon see whether this increase, despite the lack of significant price movement, is a leading indicator or just a retail-driven move.
Ethereum (ETH)
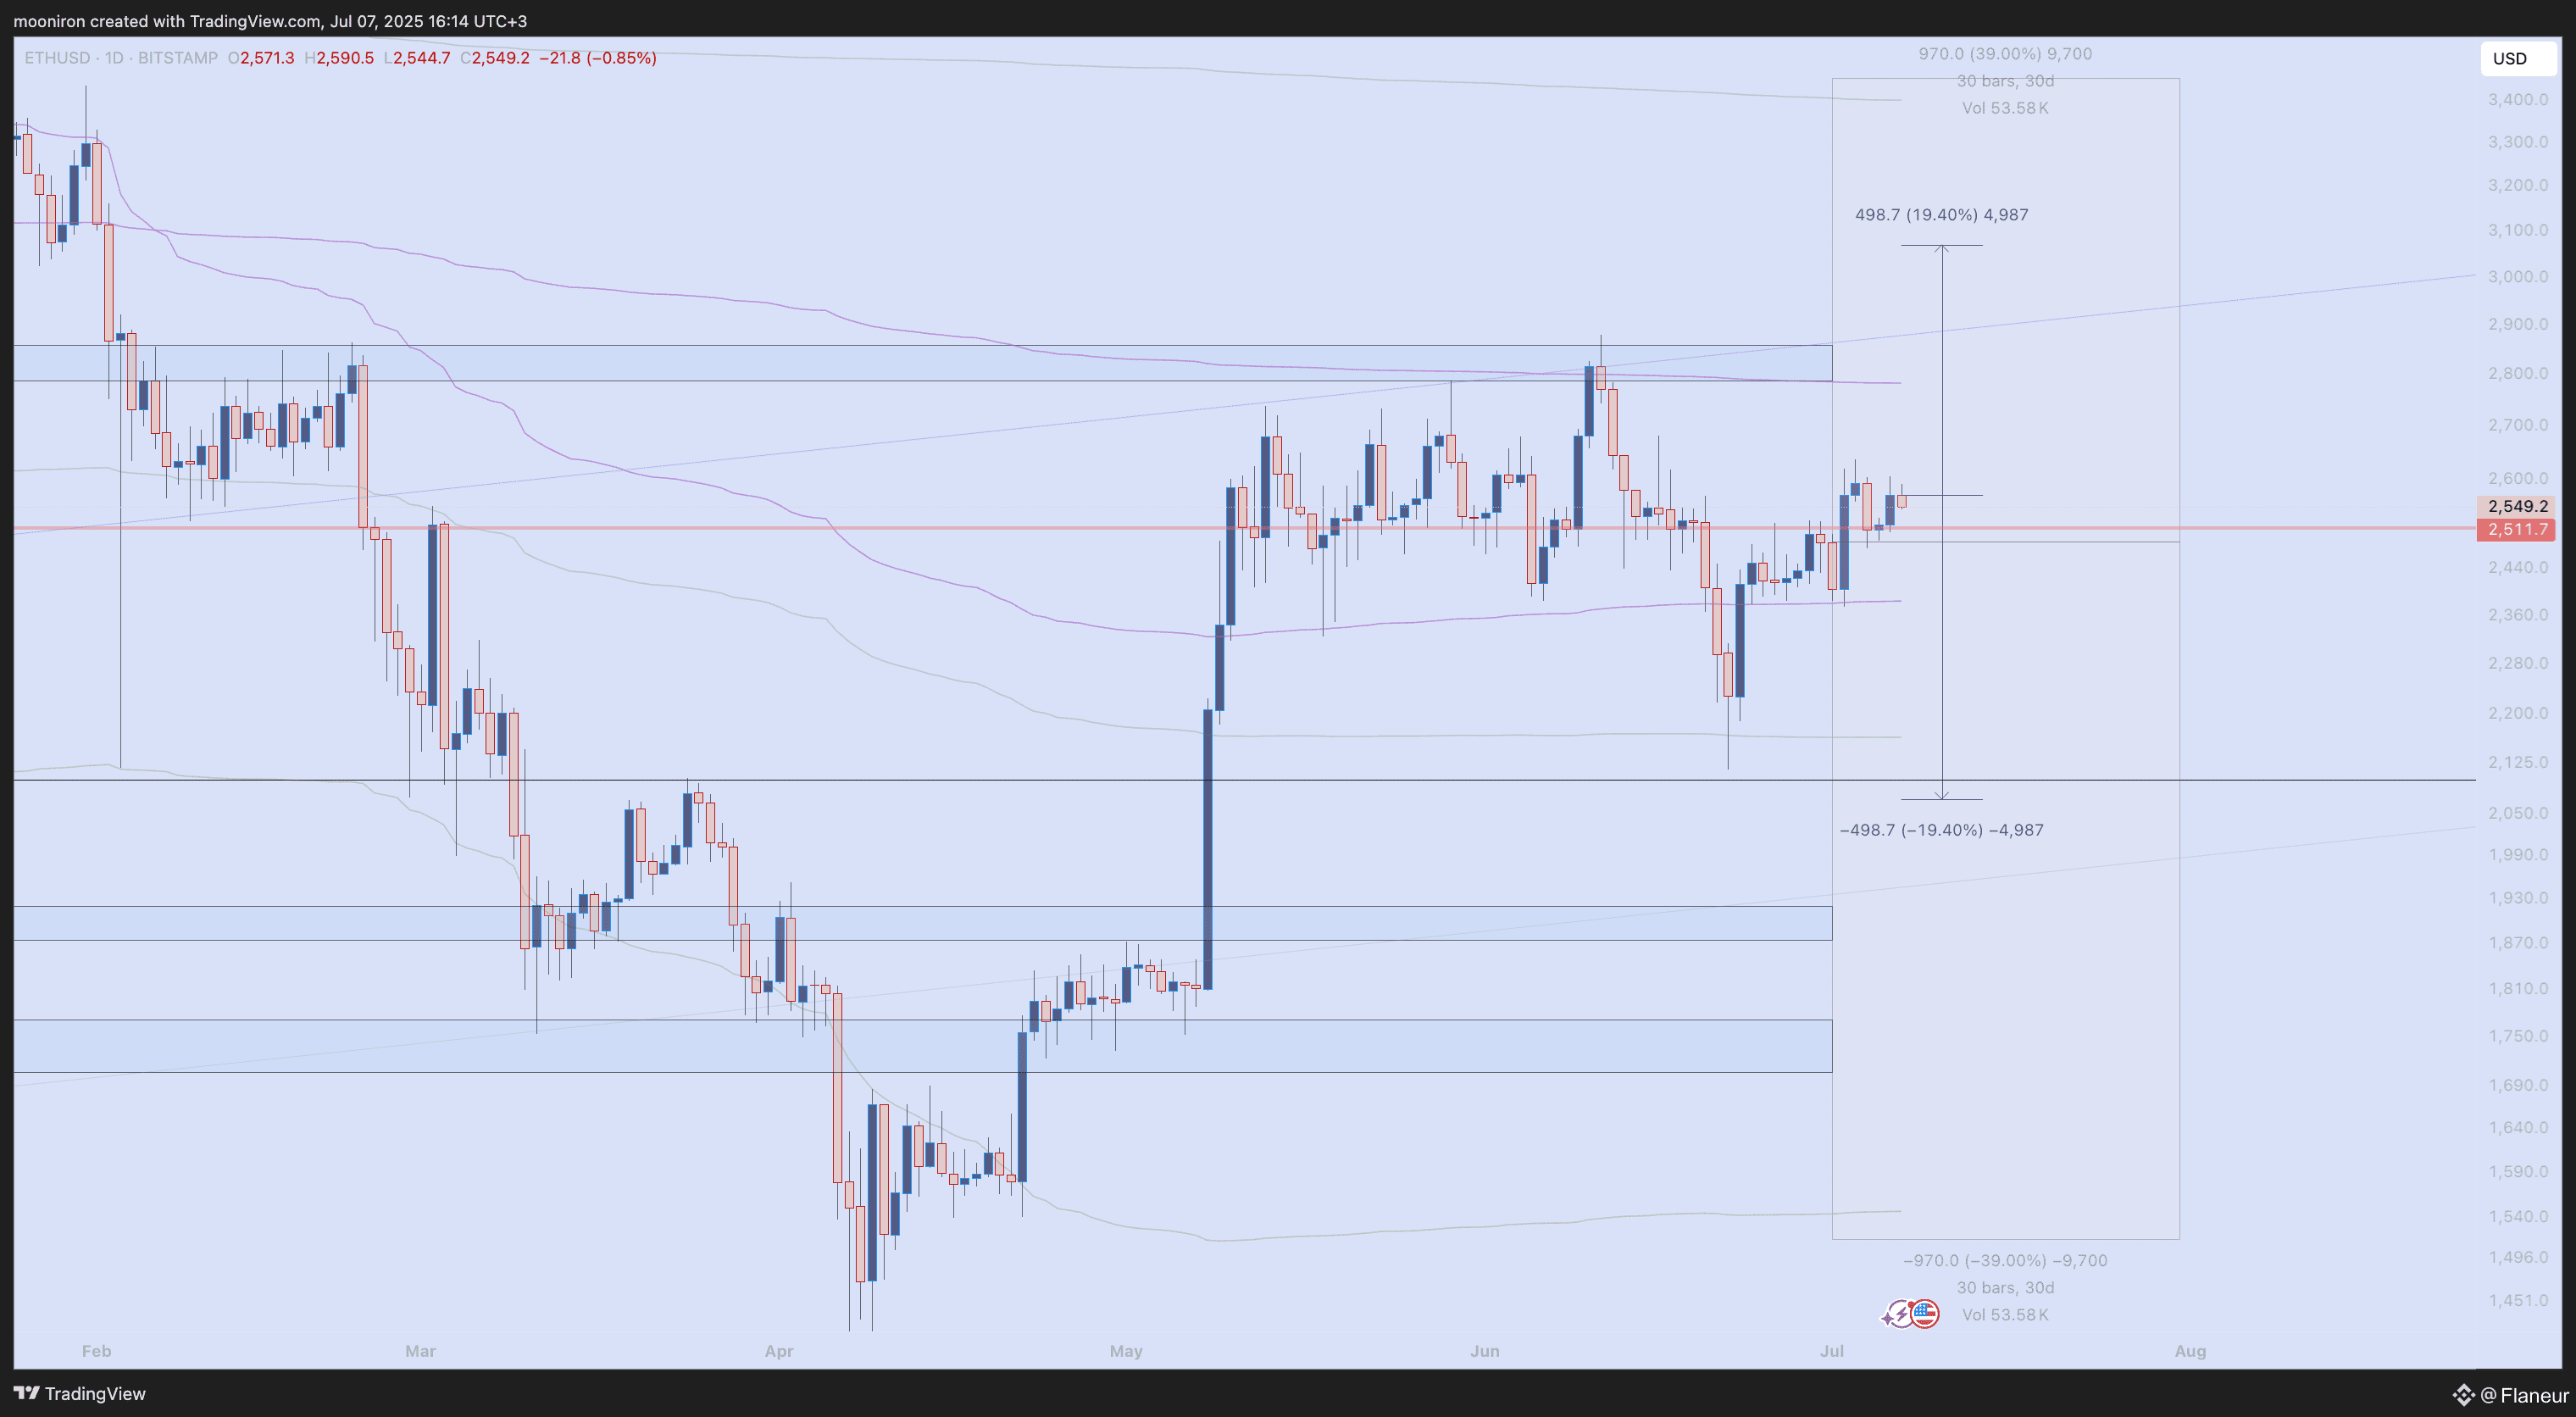
A similar compression is dominant on the Ethereum side. After a week that saw a 5.4% rise followed by a 5.1% fall, ETH's Fear & Greed Index remains in the "Greed" zone at 65. Its struggle around the $2500 area continues.
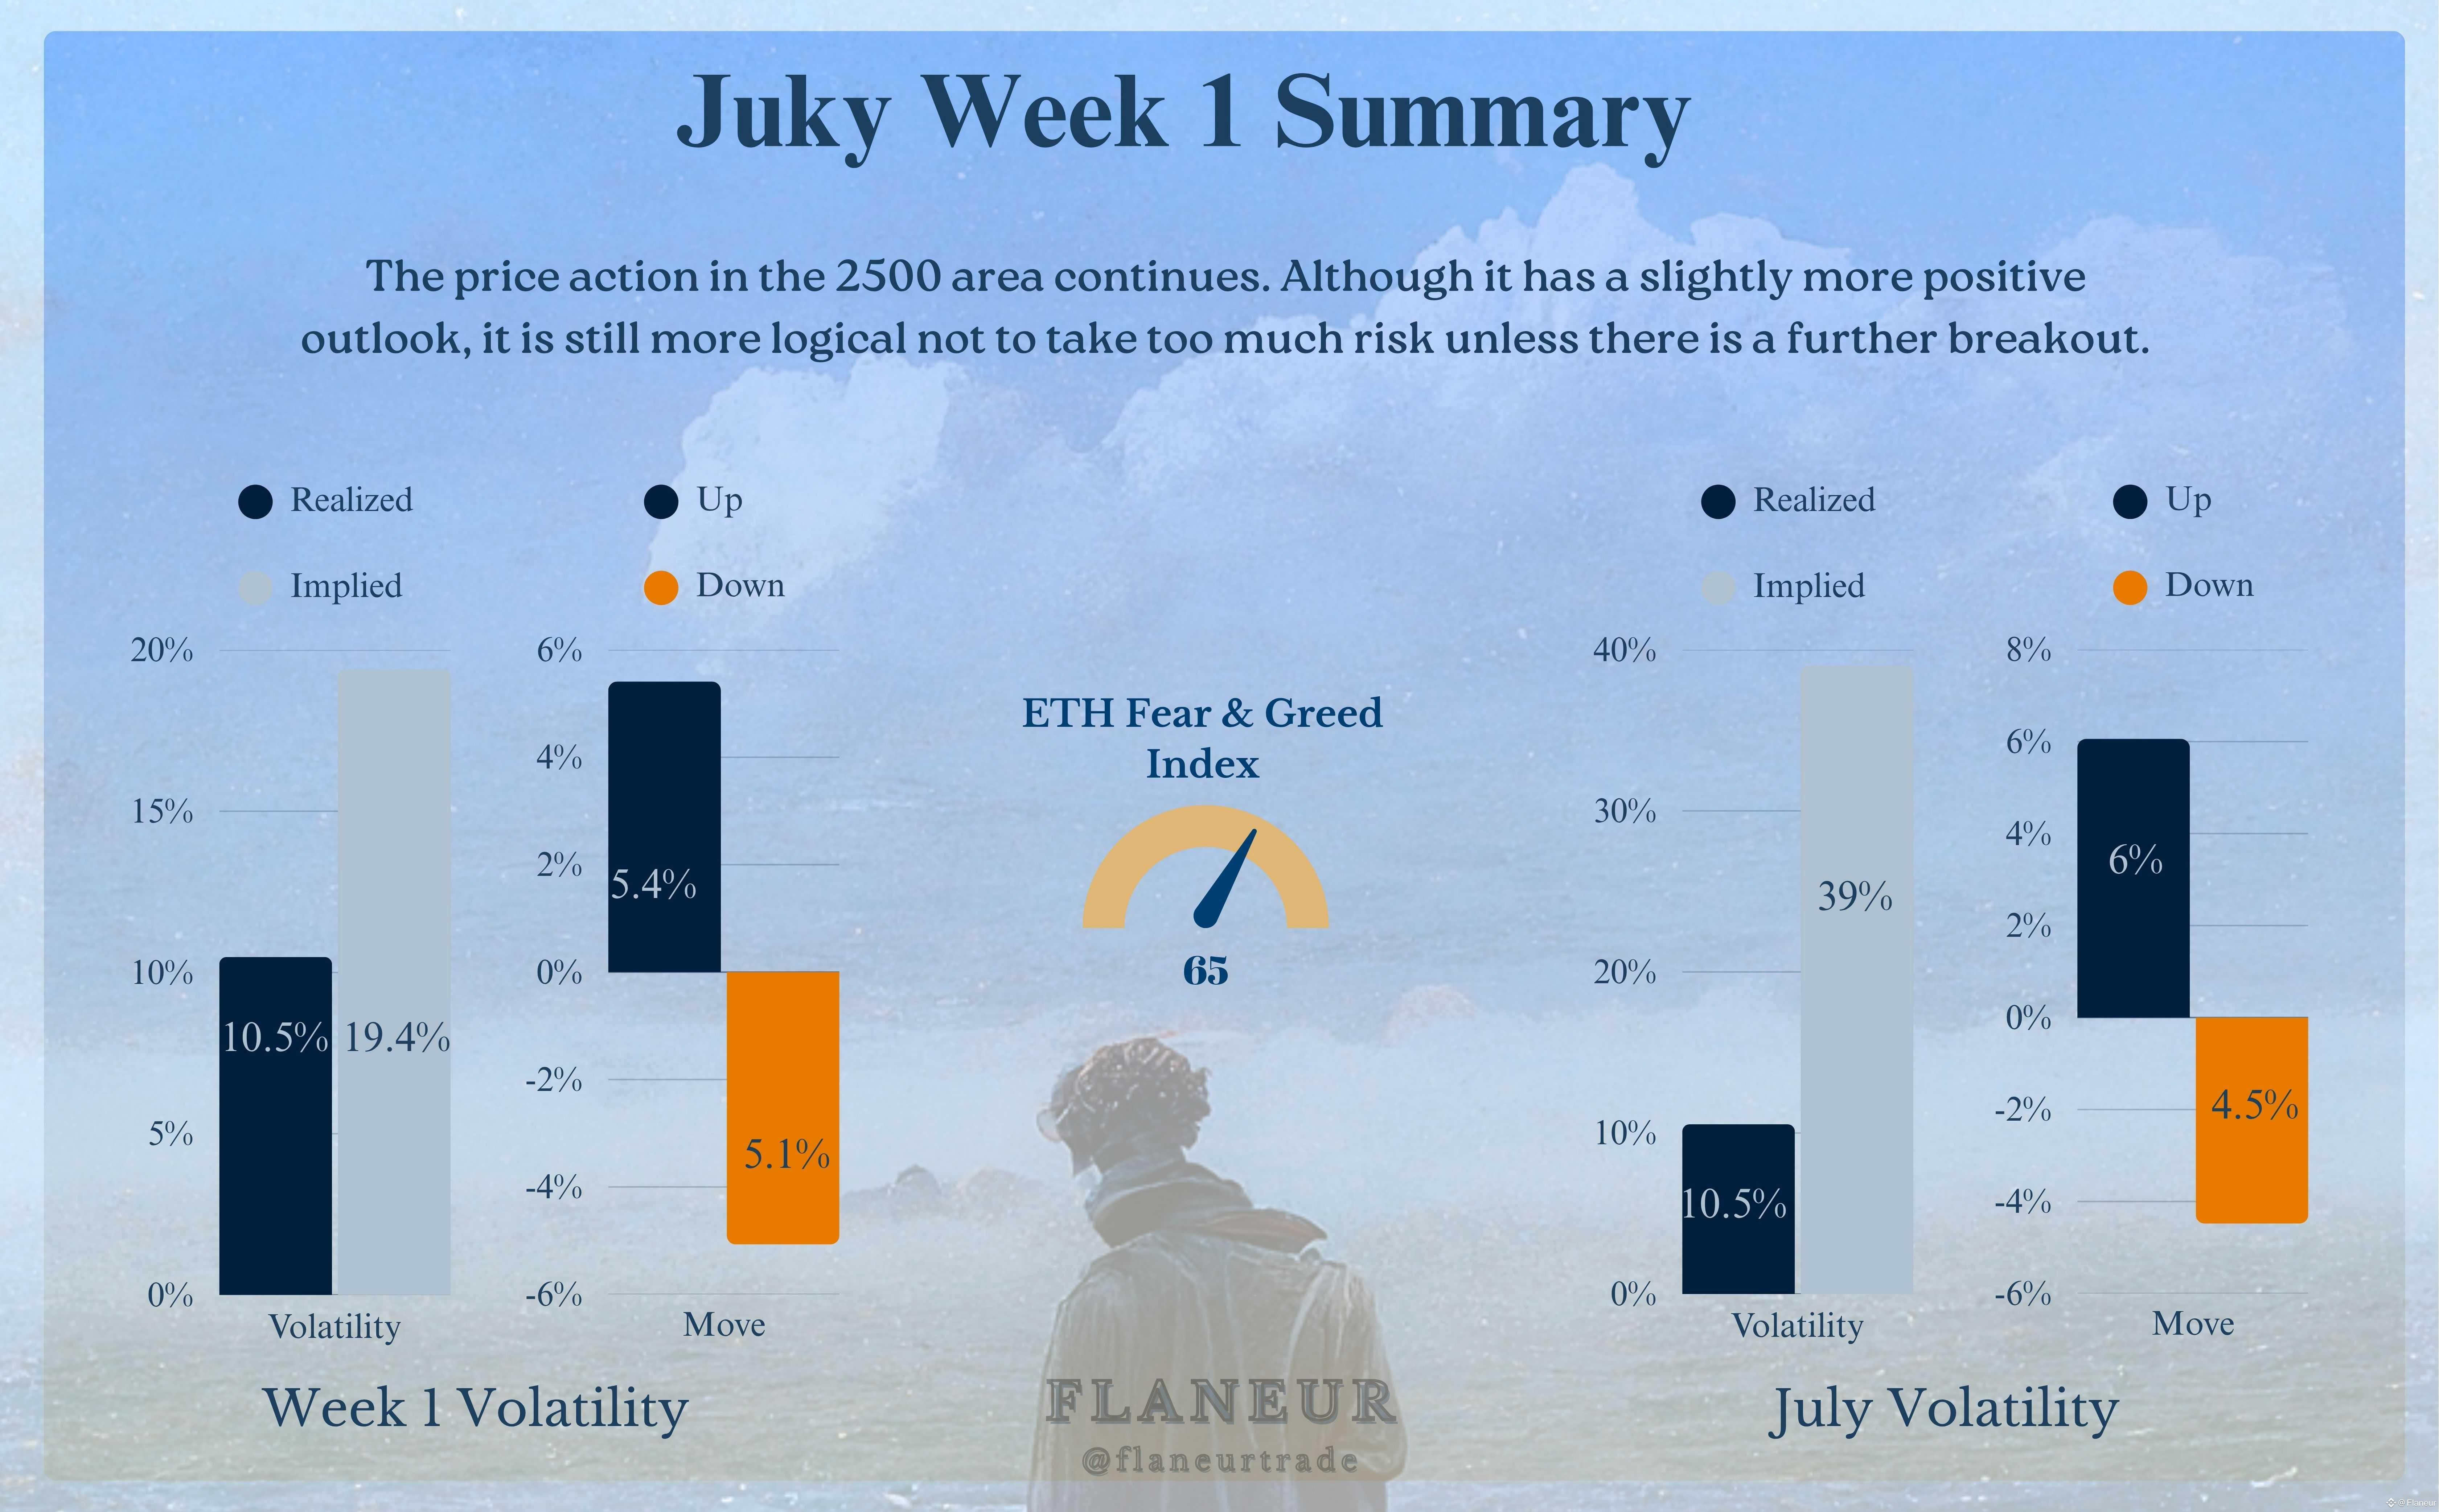
The chart shows us again how critical the $2500 level is as a pivot. While the price's effort to stay above this level is a positive sign, the weakness of the rallies doesn't look very good either. Similar to last week, the expected volatility for this week points to a price range between $2070 and $3070. Although my own positioning is skewed downwards, I will be paying close attention to the $2800 zone if the price trades above $2600.
Options Market Data:
Put/Call Ratio (July 25 Expiry): It showed a slight increase from 0.55 last week to 0.62. This suggests that the extreme optimism has normalized a bit, but with the ratio still well below 1, the bullish expectation remains strong.
DVOL: Remaining fixed at 65%, it underscores how much more alive the expectation of volatility is for ETH compared to BTC.
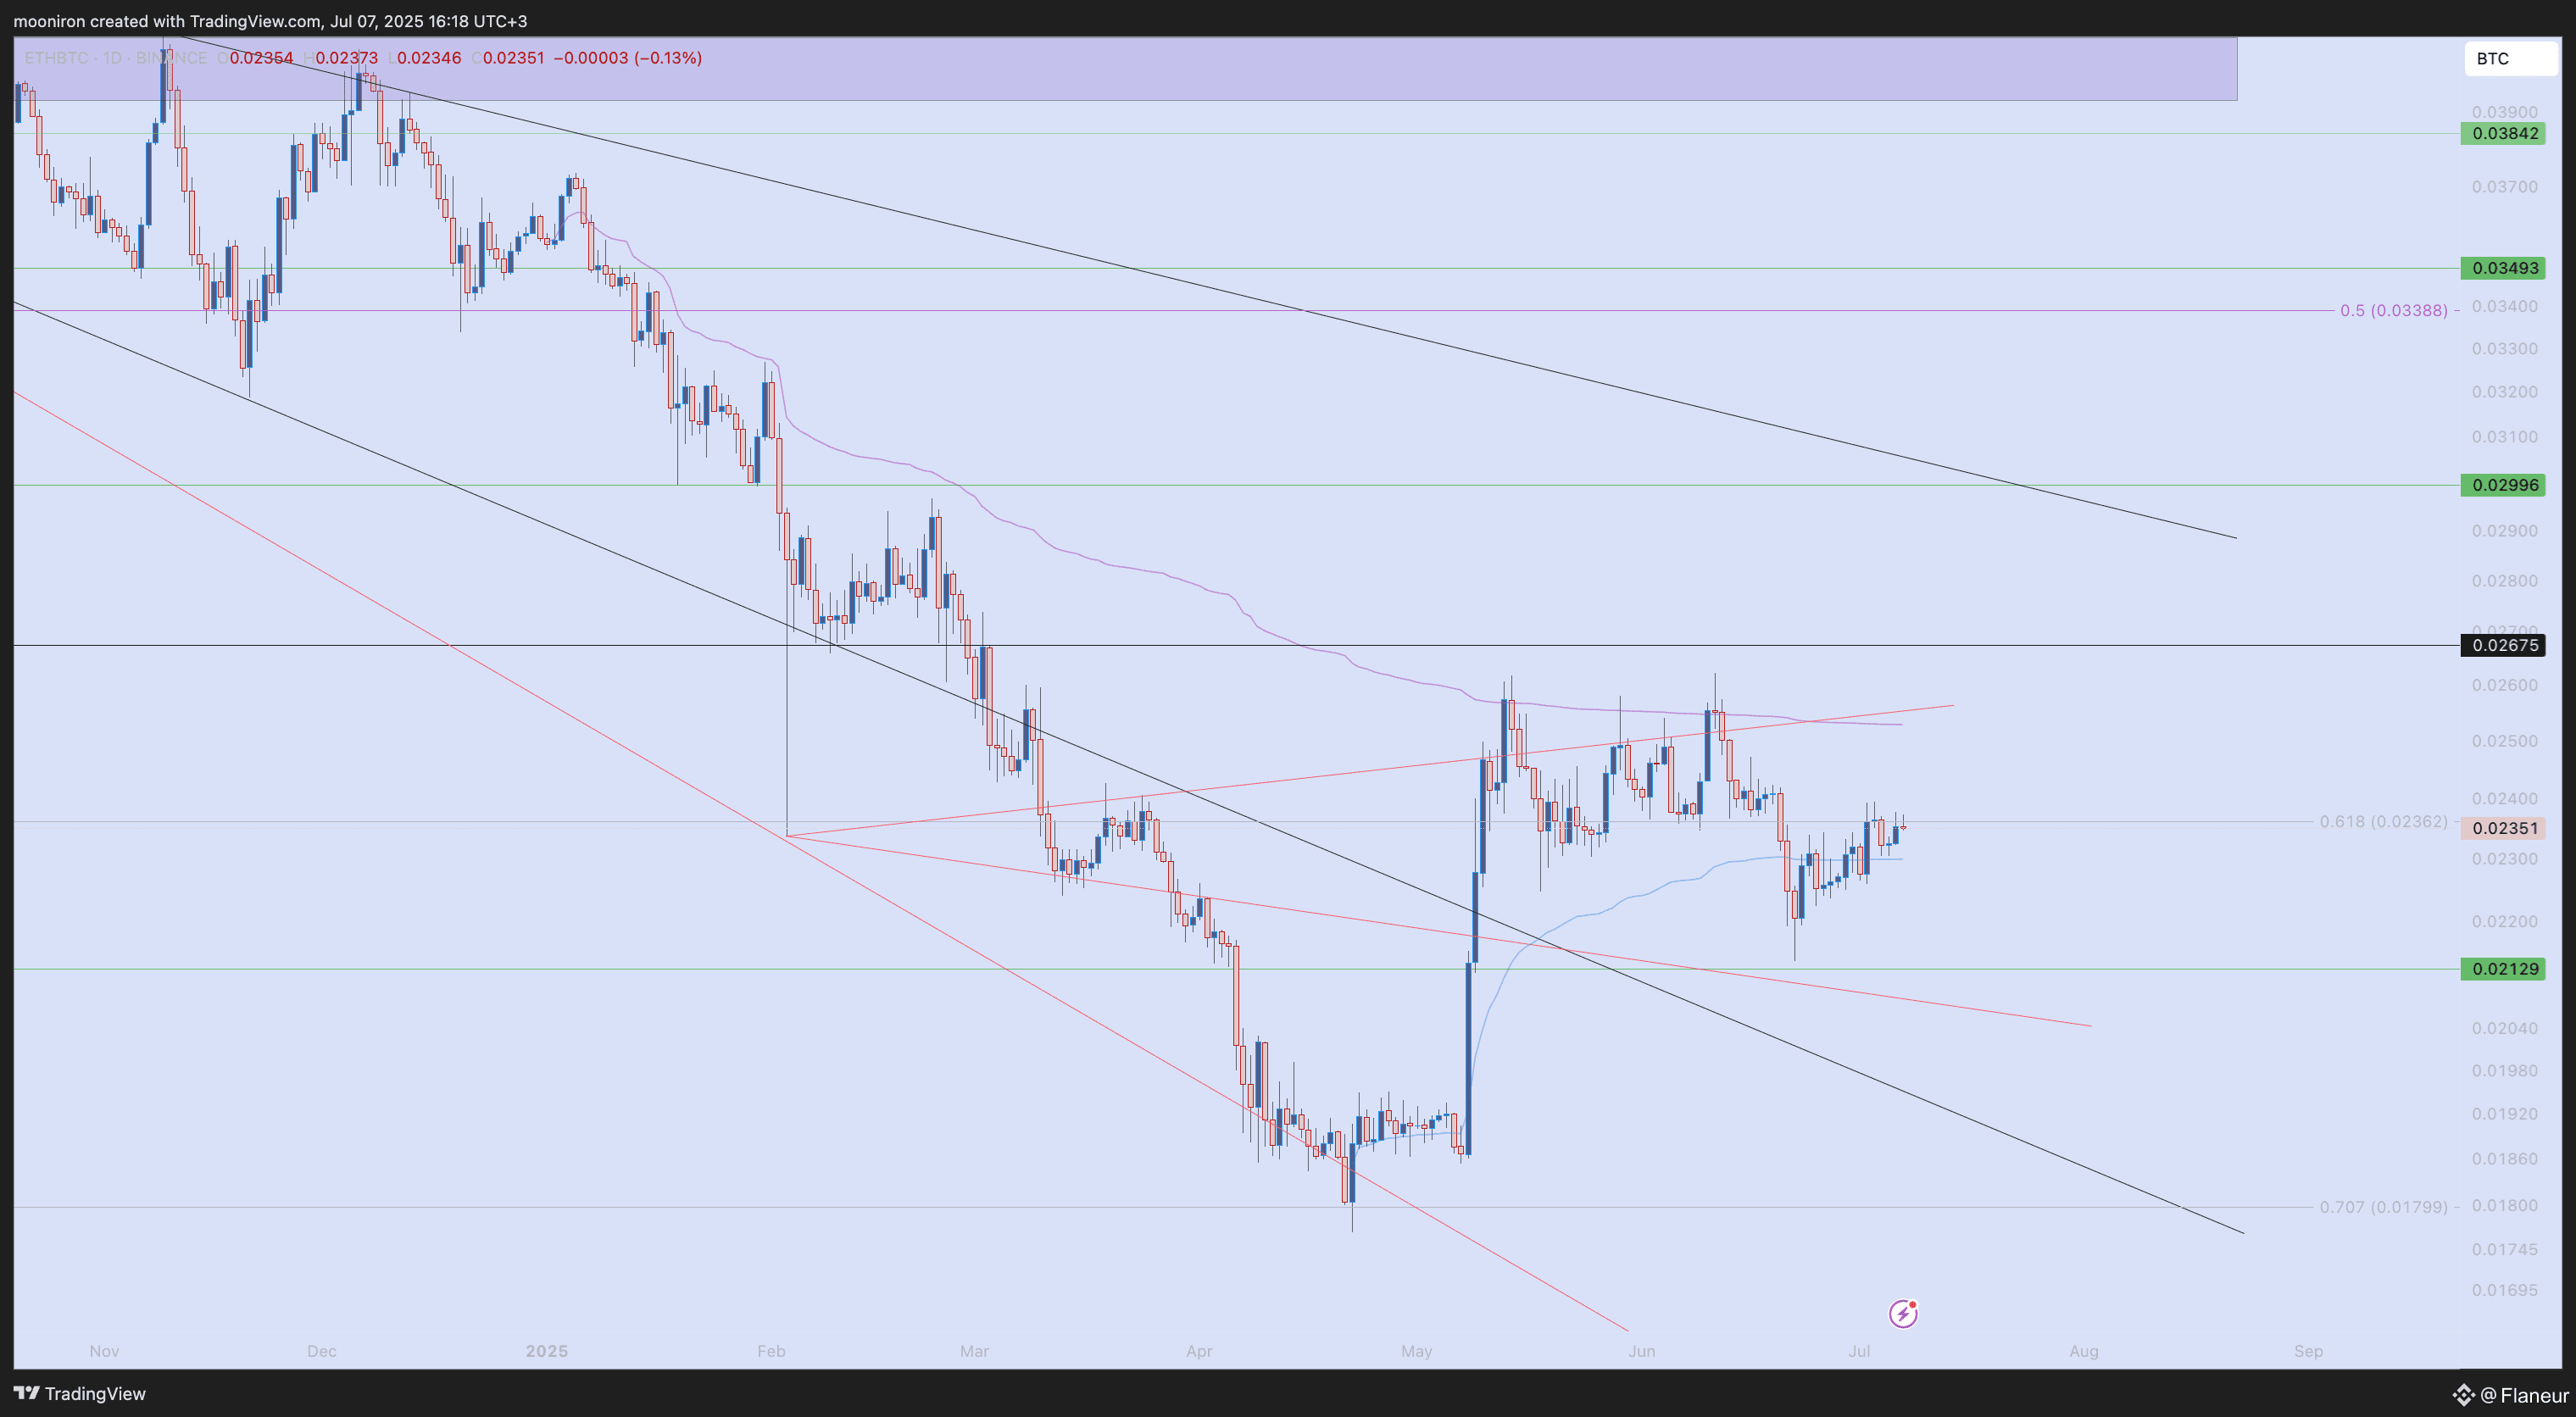
ETH/BTC
After the drop to 0.022, the price is moving upwards very slowly. Not much has changed for a while. It appears to be following Path 1, which I outlined in a previous analysis.
Conclusion
The market continues to be squeezed in a narrow band, and this situation is a harbinger of a sharp move to come. Significant changes in some indicators suggest that certain market expectations are now being acted upon.
#TrumpTariffs #DayTradingStrategy #MuskAmericaParty #SpotVSFuturesStrategy #BTCWhaleMovement