There is a possibility for ordinary people to turn their fortunes around through cryptocurrency trading, but there are also high risks involved. Successful cryptocurrency trading requires a deep understanding of the market, technical analysis skills, and money management techniques.
Step 1: Select cryptocurrencies from the gainers list
First, look at the cryptocurrencies on the gainers list, selecting those that perform well to add to your watchlist. However, if a coin has dropped for more than three consecutive days, try to avoid it. Because the funds have already exited, such coins hold little chance.
Step 2: Observe the MACD golden cross
Then, open the K-line chart, focusing on the MACD golden cross at the monthly level. Such cryptocurrencies are relatively stable and align with the upward trend.
Step 3: Look at the daily line and the 60-day moving average
Take another look at the daily K-line chart, paying special attention to the 60-day moving average. When the price pulls back to near the 60-day moving average and a volume K-line appears, it is the best time to buy heavily.
Step 4: Hold and sell
Once you buy, remember to use the 60-day moving average as a guideline. If the price is above the line, continue to hold; if it falls below the line, sell.
Three small details to pay attention to:
Sell one-third of the position when the price rises more than 30%.
Sell one-third of the position when the price rises more than 50%.
The most critical point: if the price falls below the 60-period moving average the next day, sell everything without hesitation. Don't think that the price will rebound; the market is not that simple.
Although the probability of this situation occurring is low, it is essential to have risk awareness. In the cryptocurrency circle, preserving capital is the most important thing. If you sell and it meets the buying conditions again, wait for the opportunity to re-enter.
Most importantly, stick to the method. Especially 'if the price falls below the 60-day moving average, exit completely'. Few can do this, but this is the key to whether you can be profitable.
Remember, we come to the cryptocurrency circle to make money, we cannot play around casually, and we must take it seriously to truly earn money.
There is a 'foolproof' way to trade cryptocurrencies that makes it very simple to follow the major players and reap the rewards! Share this with those who see this article; it’s worth saving.
1. Introduction
The bullish flag pattern may be one of the first chart patterns you encounter during your chart analysis learning process. This pattern has a simple structure and significant effect. However, many teaching resources often focus on how to identify the bullish flag rather than how to conduct actual trading.
2. How to discover bullish flag patterns correctly and incorrectly
At this point, you may be familiar with the bullish flag pattern and its visual characteristics; however, I have observed that many traders tend to complicate the identification process of the bullish flag pattern, such as: Does it require at least 10 candles? Should it follow a specific 'three-step' pattern? Should it include a doji candle? In fact, these are not necessary conditions. Instead, the only key point to remember is that after a strong trend, a set of indecisive candles appears. Note that the bullish flag pattern is a 'continuation' pattern that provides you with a reasonable entry point to participate in market trends. This means that if you want to trade at favorable prices during an uptrend, the bullish flag pattern is your best choice.
Bullish flag on the KIRK daily timeframe

Nonetheless, the bullish flag consists of two parts, of which the pole is the most prominent, as shown in the figure below.
Bullish pole on the RELIANCE daily timeframe

Next is the flag, which may cause confusion, as shown in the figure below.
Bullish flag on the RELIANCE daily timeframe

So, let's explore this phenomenon. If you observe a pole, the price suddenly drops sharply, as shown in the figure below.
Sharp movement on the NVDA daily timeframe

This phenomenon clearly reveals that the market trend does not conform to the characteristics of the bullish flag pattern; on the contrary, this indication shows that the breakout we observe is actually a misleading false breakout, as shown in the figure below.
False breakout on the NVDA daily timeframe

So, what is our exploration target? We are looking for a series of indecisive candle patterns, as shown in the figure below.
Indecisive candles on the NVDA daily timeframe

You may wonder why to pay attention to this indecisive market behavior. This is because if a series of indecisive candles appear after a strong market trend (i.e., market peak), it indicates that sellers are struggling to push the price down while buyers maintain market control. Therefore, if a rapid price drop is observed after the market peak, you need a period of observation to confirm that sellers have not yet gained market dominance.
This is why we have other chart patterns, such as the ascending triangle, which can be utilized when the price needs more time to form a clear trend, as shown in the figure below.
Potential ascending triangle on the INFY daily timeframe

I do not want us to always focus on the same perspective because the bullish flag pattern is a highly subjective trading concept, indicating that we may observe different patterns from the same chart, but that does not necessarily mean our interpretations are incorrect. Even so, if our analyses are consistent in more than 50% of cases, I can consider that you are following the right analytical path.
I have shown you both successful and unsuccessful bullish flag cases because the reality is that not all patterns can achieve 100% accuracy, and our goal is to learn how to accurately identify these patterns. Therefore, let's temporarily set aside our previous discussions and delve into how to precisely identify the optimal details of bullish flag setups.
3. How to find the best bullish flag on the chart
Imagine I show you two pairs of white shoes, but suppose I tell you that shoe A is produced by Nike while shoe B is made by an unknown counterfeit brand. What would happen? In this scenario, you might prefer the shoes produced by Nike because you know that Nike's shoes have been verified, are durable, and can withstand long-term use.
When looking for bullish flag patterns, the same situation applies: just because you have identified a potential flag pattern does not mean it necessarily constitutes a high reward-to-risk trading setup. As you understand, bullish flags can sometimes form in an established downtrend, as shown in the figure below.
Bullish flag in a downtrend on the QQQ daily timeframe

Alternatively, the pattern may form in a more concealed position within a price range, as shown in the figure below.
Bullish flag on the ROKU 4-hour timeframe

At present, you might have the following question: So, please guide me on how to identify those bullish flag setups that can bring substantial returns. Of course, I cannot guarantee that you will make huge profits, but identifying high-quality bullish flag setups usually involves the following three elements: bullish flag + uptrend, bullish flag + below resistance level, bullish flag + trend reversal. The key is to combine chart patterns with price action. Next, let me show you my intentions and analyze the diversity and application of this chart pattern.
(1) Bullish flag + uptrend
The most common explanation for the bullish flag pattern is that it is used to identify the right time to enter an established trend.
Bullish flag in an upward trend on the KIRK daily timeframe

This is why you might hear some traders say: 'I missed that breakout, it seems I have to wait for a market pullback'. Does this situation sound familiar?
However, the key point is this: you need to clarify the type of trend you intend to capture and establish specific trading rules for it. Specifically, when identifying a short-term trend, you might consider using the 20-period moving average as a reference;
For mid-term trend judgments, the 50-period moving average may be a suitable indicator; whereas, in analyzing long-term trends, the 200-period moving average is often used as an important reference standard. You can choose to trade any of these trends, but to maintain consistency in your trading strategy, it is recommended that you first focus on trading one trend, mastering its techniques by completing 30 to 50 related trades.
(2) Bullish flag + below resistance
Range markets are undoubtedly one of the most challenging types of trading environments, as they can experience both contraction and expansion processes and are often accompanied by a large number of misleading breakouts.
Complex range on the Alibaba daily timeframe

However, if there were a method to accurately predict when a range market would transition into an uptrend, it would be ideal. In a range market, patiently wait for the price to form a bullish flag pattern below the resistance level, as shown in the figure below.
Below resistance on the AMZN daily timeframe
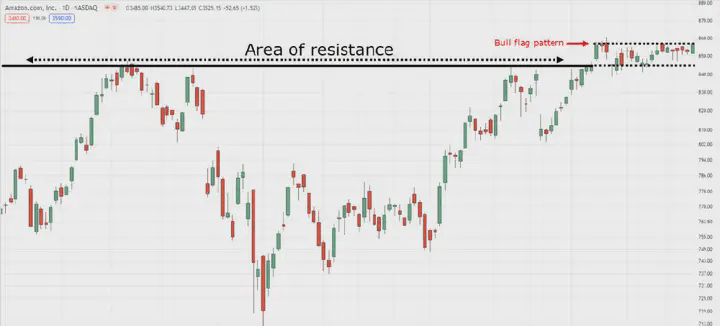
This pattern indicates that sellers are having difficulty pushing the price down below the resistance area while buyers show a willingness to maintain the breakout. So how should we view the downtrend? How can you identify the trend reversal potential indicated by the bullish flag pattern? Next, we will explore the answers to this question.
(3) Bullish flag + trend reversal
You may remember that I introduced the concept of three trends earlier. With this technique, you will be able to effectively identify trend reversals, whether they are short-term, mid-term, or long-term downtrends. Indeed, we focus on downtrends because we plan to use the bullish flag pattern to identify potential trend reversals, as we discussed earlier. The first step you need to execute is to identify the downtrend and wait for the price to break the resistance line of that trend, as shown in the figure below.
ETSY daily timeframe structural breakdown

Next, wait for the price to form a bullish flag, as shown in the figure below.
Bullish flag on the ETSY daily timeframe

Similarly, once the bullish flag pattern forms, it not only indicates that the structure of the downtrend has been broken, but also implies that a 'trend reversal' process is underway, which in turn indicates that an uptrend may be about to form. Now, I understand that I may have left you with the impression that these signals are the 'holy grail' of trading, capable of ensuring profits; however, like any shoe, they can still have flaws or issues. No trade is 100% guaranteed, which is precisely why we need to manage risk.
Now that you understand the possible locations of the bullish flag pattern, how will you manage your trades? Should you set a fixed profit target? Should you use a trailing stop loss? In the following content, I will share some practical trading strategies that will provide answers to these questions.
4. Effective bullish flag trading strategies in bull and bear markets
Before delving into specific strategies, allow me to introduce the basic rules for entry triggers. These rules will be the common guidelines followed in the three strategies we are about to discuss.
Patiently wait for the price to reach the level of 'highest closing price' from the market peak (i.e., above the highest wick of the candle), as shown in the figure below.
Highest closing price on the JNJ daily timeframe
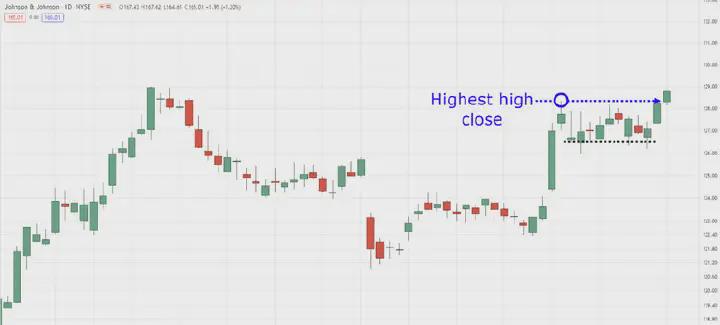
Then, execute the entry operation at the opening of the next candle, as shown in the figure below.
Entry trigger for the bullish flag pattern on the JNJ daily timeframe

For the trading strategy I am about to show you, the entry trigger rules remain consistent because entry accounts for only a small part of the overall trading equation, indicating that the art of trade management is key to determining trading success, rather than the specific way of entering. Therefore, you should not overly focus on how to precisely enter the bullish flag pattern. With these premises, let's formally begin our discussion.
(1) Strategy 1: Bullish flag trend continuation strategy
Assuming your goal is to capture mid-term trends, you will use the 50-period moving average as a reference; currently, you expect the price to be above the 50-period moving average, as shown in the figure below.
Price above the 50-period moving average on the MARA daily timeframe

Then, you should patiently wait for a suitable bullish flag pattern to form and set the stop loss below the lowest point of that flag pattern, as shown in the figure below.
Entry into bullish flag on the MARA daily timeframe

Of course, any trading strategy lacking exit rules is imperfect. In this case, you should consider using the 50-period moving average as a benchmark for trailing stop losses, which indicates that you will maintain your trading position until the price closes below the moving average, as shown in the figure below.
50 MA trailing stop loss exit on the MARA daily timeframe

I understand this strategy may seem very basic, but that is its essence, because the more random variables you introduce into your trading strategy, the harder it becomes to discern which factors are effective and which are ineffective (as well as which need further improvement or optimization). Nevertheless, if you are a trend-following trader, this strategy will suit you very well.
(2) Strategy 2: Bullish flag range breakout strategy
When adopting this strategy, your technical analysis skills will be put to the test. By now, you should be proficient in drawing support and resistance levels. Remember, the strategy currently under discussion is a range breakout strategy, which means you need to identify range markets and accurately mark their support and resistance levels, as shown in the figure below.
Support and resistance levels on the FCEL daily timeframe

After you have successfully drawn the trading range, the next step is to observe whether the price touches the support area and forms an effective bullish flag pattern in that area or below it, as shown in the figure below.
Bullish flag setup on the FCEL daily timeframe

At this stage, we cannot yet predict what type of trend will form if the market continues to develop. I recommend setting your profit targets just below the next resistance area marked on the chart, as shown in the figure below.
Bullish flag pattern in the FCEL daily timeframe with fixed profit-taking

Similarly, you should have a certain proficiency in drawing support and resistance levels. Therefore, if you intend to enhance your skills in marking these key levels on the chart, you can read relevant guides.
(3) Strategy 3: Bullish flag trend reversal strategy
Please remain objective, but this strategy might be the one I personally prefer among the three I introduced due to its simplicity. Since this is a trend reversal strategy, what you need to look for is a market environment in a downtrend. The more severe the market has been hit, the more favorable the situation becomes (this is the most attractive part of the strategy), as shown in the figure below.
Downtrend on the U daily timeframe

Once the market price breaks above the trend line resistance, you then expect the price to form a bullish flag pattern at this position, as shown in the figure below.
Bullish flag on the U daily timeframe

Bullish flag entry and stop-loss on the U daily timeframe

Let me emphasize again, if the bull flag pattern has not formed, then trading should not be conducted because the absence of this pattern indicates that the price level does not have effective support, thus any potential breakout could be false. Finally, I recommend using a strict trailing stop-loss strategy, such as using the 20-period moving average as a reference, as the current trend may never further develop, or the market may be forming a new trading range, as shown in the figure below.
Exit at the 20 MA in the U daily timeframe

Therefore, you should close your position immediately after reaching the trailing stop loss, rather than setting a fixed profit target.
You may be wondering: Is this strategy effective in the Indian market? Is it applicable to forex trading? Is it applicable to cryptocurrency trading? The answer to these questions is yes. However, please pay attention to the following points: To make this strategy effectively expand your trading portfolio, you must implement strict risk management measures, establish clear market selection criteria, and always follow your trading plan to execute trades.
5. Conclusion
Here are the core points summarized in this guide:
(1) The bullish flag pattern consists of a significant upward trend (i.e., market peak) followed by a series of indecisive candles forming the flag.
(2) Before using the bullish flag pattern for trading, it is crucial to first identify the overall trend of market prices.
(3) Bullish flag patterns can be applied to capture trend continuation, trend reversal, and breakouts in range markets.

Ten tips for making a million a year from trading cryptocurrencies!
1. Stay calm and rational: In the cryptocurrency circle, rationality and patience are the cornerstones of success. Avoid impulsive behaviors driven by greed to avoid missing good opportunities.
2. Understand the overall market situation: Don't just focus on the 'major player' movements; the market is influenced by multiple factors such as the global economic environment, policy dynamics, and technological innovations, requiring comprehensive consideration.
3. Understand the main players' dilemmas: Grasp the logic and difficulties of major players’ operations, but maintain independent thinking, not swayed by their actions. The market is complex and ever-changing, making the intentions of major players difficult to grasp.
4. Pay attention to bottom fluctuations: Increased volume at the bottom may indicate a surge of funds, but it should be analyzed in conjunction with other indicators to guard against false breakout traps.
5. Respond calmly to market washouts: washouts are common in the market and aim to eliminate impulsive investors. Stay composed and make decisions after the trend clarifies.
6. Mid-line layout and position control: Select cryptocurrencies for long-term holding while retaining some funds for flexible operations, optimizing investment efficiency through rolling strategies.
7. The essence of short-term trading: Short-term trading requires sharp market insight and decisiveness. Pay attention to K-line patterns, market sentiment, heat changes, and rising rates.
8. Bottom-building buying strategy: Buying during the bottom-building phase is relatively stable, but requires patience to wait for confirmation signals to avoid blindly bottom-fishing.
9. Be cautious when chasing price increases: Chasing prices may yield quick profits, but risks also increase. Accurately assess the sustainability of the upward trend to avoid standing at high positions.
10. Comprehensive use of technical indicators: Divergence is an important signal in technical analysis, but it needs to be combined with other analytical tools and market realities to avoid one-sided judgments.


