In the last bull market, I made an eight-digit profit from 100k, having traded cryptocurrency for ten years. Now I trade cryptocurrency full-time, sharing a few tips to help you learn to trade cryptocurrency, so you can take fewer detours and get started faster!
Engage in cryptocurrency trading, prepare ahead, enter steadily, and refuse to be reckless.
Low-level sideways action hitting new lows, it's the right time to build a heavy position.
Sell decisively on peaks, buy boldly on dips, and trade cautiously during sideways movements.
Long-term sideways, using sideways to replace declines, firmly hold onto your chips, and quietly wait for the moment of escalations.
Rapid surges should be approached with caution, always ready to secure profits, as sharp declines may come unexpectedly.
Do not panic during a slow decline; gradually accumulate to average down costs.
Highs and lows consolidate, patiently wait; sideways at highs then surge, sell decisively without hesitation; sideways at lows hitting new lows, a good opportunity to go all in.
No soaring, no selling; no diving, no buying; during sideways movements, it's advisable to observe.
Buy on bearish candles, sell on bullish candles; act against the trend to reveal the true hero's nature.
Buy boldly during early sell-offs, sell decisively during early rallies, do not chase high during midday surges, buy on midday declines the next day, do not cut losses during early sell-offs, and rest during stable price movements.
Holding on to recoup losses is just to break even; seeking huge profits is greed.
Calm market suddenly stirs, subsequent movements must be cautious; after a big rise, there may be a pullback, and the triangle of the candlestick hides mysteries.
In an upward trend, look for support; in a downward trend, look for resistance; fully investing is not advisable; stubbornness will lead to setbacks.
The market is unpredictable; know when to advance and retreat, observe the timing. Trading cryptocurrency is essentially about mental discipline; greed and fear must be discarded.
Be cautious with chasing prices and selling off; stay calm and wealth will come. The two key principles for success in the cryptocurrency circle are: hold onto your coins and hold firmly.

The biggest difficulty in trading is not anything else, but the fear of losing money!
So how do you overcome your fear of losing money?
The great philosopher Russell once said: The quickest way to overcome your fear is to do what you are afraid of. Aren't you afraid of losing money? Then go practice losing money deliberately.
Step 1: Prepare 100U
Step 2: Within one week, lose all of this 100U. But this does not mean you can act recklessly; you cannot trade blindly, cannot blindly increase leverage, cannot face liquidation; you must strictly set stop losses and strictly execute according to the opportunities within your trading system.
Aren't you afraid of losing money? Don't you trust your trading system?
Come on! The best way to eliminate fear is to face it, so go ahead and lose! This 100U is for you to lose, if 100U is not enough, come back for another 100U. The moment you feel numb to losses, that will be your success. At that point, you'll understand what I often say: 'Losing money is normal, missing opportunities is also normal, only by accepting this can making money be a possibility for you.'
Only through repeated losses and repeatedly battling with oneself can you be reborn and conquer the fear of losing. From now on, whether it’s holding a position or entering, you will do so without hesitation.
Let me tell you secretly, if you really do what I said above, the outcome is likely that you won't lose everything; you might even double your capital.
So at that time, you will feel compelled to increase your capital investment, but when you go all in with 1000U or 10000U,
You will find that your old problem has returned: what to do if you are still afraid of losing money?
Question 1: What to do if still afraid of losing money?
Adjust your position to an appropriate size
Question 2: What is the appropriate size?
A position that allows you to sleep well at night
Question 3: When can I increase my position?
When you can increase your position and still sleep well
But please note! The deliberate practice method I just taught you requires you to have your own trading system; if you don’t even have a trading system, you have no right to be afraid of losing money!
I have used 90% of the indicators in the market, but I am particularly fond of this set of cryptocurrency trading indicators, achieving a hundred victories, worth deep learning and collection (suitable for everyone)
The bullish flag pattern may be one of the first chart patterns you encounter during your chart analysis learning process. This pattern has a simple structure and remarkable effects. However, many teaching resources often focus on how to identify bullish flags rather than how to trade them.
In this guide, you will learn the following:
(1) Accurate ways to identify bullish flag patterns to avoid confusion in trading.
(2) How to identify bullish flag setups with a higher probability of success (rather than randomness).
(3) Three bullish flag trading strategies effective in both bull and bear markets.
Bullish flag on the KIRK daily time frame

Nevertheless, the bullish flag consists of two parts, of which the pole is the most prominent part, as shown in the image below.
Bullish flag pole on the RELIANCE daily time frame

Next is the mark, which may cause confusion, as shown in the image below.
Bullish flag on the RELIANCE daily time frame

So, let's explore this phenomenon: if you observe a pole and the price suddenly plummets, as shown in the image below.
Sharp movement on the NVDA daily time frame

This phenomenon clearly reveals that the market movement does not conform to the characteristics of the bullish flag pattern; on the contrary, this sign indicates that the breakout we observe is actually a misleading false breakout, as shown in the image below.
False breakout on the NVDA daily time frame

So, what exactly are we exploring? We are searching for a series of candlestick patterns demonstrating hesitation, as shown in the image below.
Indecisive candlestick on the NVDA daily time frame
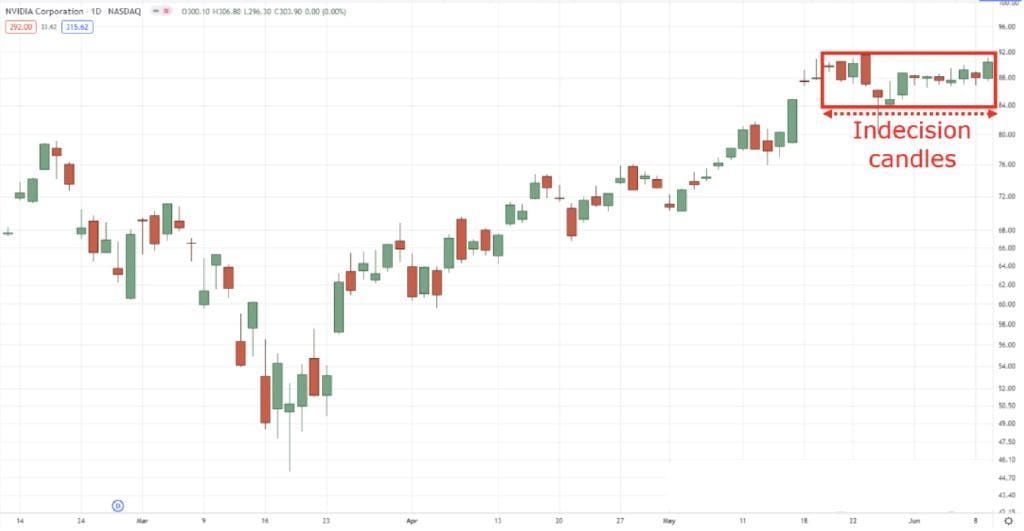
You may wonder why focus on such hesitant market performance? This is because if a series of candles showing uncertainty occurs after a strong market movement (i.e., market peak), it indicates that sellers are struggling to push prices down while buyers still maintain control of the market. Therefore, if a rapid price decline is observed after a market peak, you need a period of observation to confirm that sellers have not gained market dominance.
This is why we have other chart patterns, such as the ascending triangle, which can be utilized when the price needs more time to form a clear trend, as shown in the image below.
Potential ascending triangle on the INFY daily time frame

I do not wish for us to always focus on the same perspective, as the bullish flag pattern is a highly subjective trading concept, indicating that both of us might observe different patterns from the same chart, but that does not necessarily mean our interpretations are wrong. Even so, if our analyses are consistent over 50% of the time, I can consider that you are following the correct analytical path.
I have shown you successful and failed bullish flag cases because the reality is that not all patterns can achieve 100% accuracy, and our goal is to learn how to accurately identify these patterns. So now let's set aside our previous discussion and delve deeply into how to precisely identify the optimal bullish flag setup details.
3. How to find the best bullish flag on the chart
Imagine this: I am showing you two white shoes, but suppose I tell you that shoe A is made by Nike, while shoe B is made by an unknown counterfeit brand, what would happen? In this case, you might tend to choose the shoes made by Nike because you know that Nike shoes have been validated, are durable, and can withstand long-term use.
The same applies when looking for a bullish flag pattern; just because you identify a possible flag pattern does not mean it necessarily constitutes a high reward-to-risk trading setup. As you understand, bullish flags can sometimes form within an established downward trend, as shown in the image below.
Bullish flag in a downward trend on the QQQ daily time frame

Or, the pattern might form in a more discreet position within a price range, as shown in the image below.
Bullish flag on the ROKU 4-hour time frame

At this moment, you might have the following question: So, please guide me on how to identify bullish flag setups that can yield substantial returns. Of course, I cannot guarantee you will make huge profits, but identifying high-quality bullish flag setups usually involves the following three elements: bullish flag + upward trend, bullish flag + below resistance, bullish flag + trend reversal; the key lies in combining chart patterns with price action. Next, let me show you my intentions and analyze the diversity and application of this chart pattern.
(1) Bullish flag + upward trend
The most common interpretation of the bullish flag pattern is that it is used to identify the right time to engage in an established trend.
Bullish flag in an uptrend on the KIRK daily time frame

This is why you might hear some traders say: I missed that breakout; it seems I have to wait for the market's pullback. Does this situation sound familiar? However, the key point is this: you need to clarify the type of trend you intend to capture and formulate specific trading rules for it. Specifically, when identifying short-term trends, you may consider using the 20-period moving average as a reference; for medium-term trends, the 50-period moving average may be an appropriate indicator; while analyzing long-term trends, the 200-period moving average is often used as an important reference standard. You can choose to trade any of these trends, but to maintain consistency in your trading strategy, it is advisable to focus on trading one type of trend first, mastering its skills through 30 to 50 related trades.
(2) Bullish flag + below resistance
Range markets are undoubtedly one of the most challenging types of trading environments, as they may go through contraction and expansion processes and often come with a lot of misleading breakouts.
Alibaba's complex range on the daily time frame

However, if there were a way to accurately predict when a range market would transform into an upward trend, that would be ideal. In a range market, one should patiently wait for the price to form a bullish flag pattern below the resistance level, as shown in the image below.
Below the resistance level on the AMZN daily time frame

This pattern indicates that sellers are having difficulty pushing the price below the resistance area while buyers demonstrate the willingness to maintain the breakout. So how should we view downward trends? How can you identify the potential trend reversal indicated by the bullish flag? Next, we will explore the answers to these questions.
(3) Bullish flag + trend reversal
You may remember that I previously introduced the concept of three trends. With this technology, you will be able to effectively identify trend reversals, whether they are short-term, medium-term, or long-term downward trends. Indeed, we focus on downward trends because we plan to use the bullish flag pattern to identify trend reversals, as we discussed earlier. The first step you need to execute is to identify the downward trend and wait for the price to break above the resistance level of that trend line, as shown in the image below.
Structural breakdown on the ETSY daily time frame

Secondly, wait for the price to form a bullish flag, as shown in the image below.
Bullish flag on the ETSY daily time frame

Similarly, once the bullish flag pattern forms, it not only indicates that the structure of the downward trend has been broken but also suggests that the 'trend reversal' process is underway, which in turn indicates that an upward trend may be about to form. Now, I understand that I might have left you with the impression that these signals are the 'holy grail' of trading that can ensure profits, however, like any shoes, they can still fail or have issues; no trade is 100% guaranteed, which is why we need to manage risk.
Now that you understand where the bullish flag pattern may appear, how will you manage your trades when trading? Should you set a fixed profit target? Should you use a trailing stop? In the following content, I will share some practical trading strategies that will answer these questions.
4. Effective bullish flag trading strategy in both bull and bear markets
Before delving into specific strategies, allow me to introduce the basic rules for entry triggers, which will be the common guidelines for the three strategies we are about to discuss. The rules are as follows:
Patiently wait for the price to reach the level of 'highest closing price' from the market peak (i.e., above the highest wick of the candlestick), as shown in the image below.
Highest closing price on the JNJ daily time frame

Then, execute the entry operation when the subsequent candlestick opens, as shown in the image below.
Entry trigger for the bullish flag pattern on the JNJ daily time frame

For the trading strategies I will show you, the entry trigger rules remain consistent, as entry only occupies a small portion of the overall trading equation, indicating that the art of trade management is the key to determining the success or failure of trades, not the specific way to enter. Therefore, you should not overly focus on how to precisely enter the bullish flag pattern. With these premises, let's officially begin our exploration.
(1) Strategy 1: Bullish flag trend continuation strategy
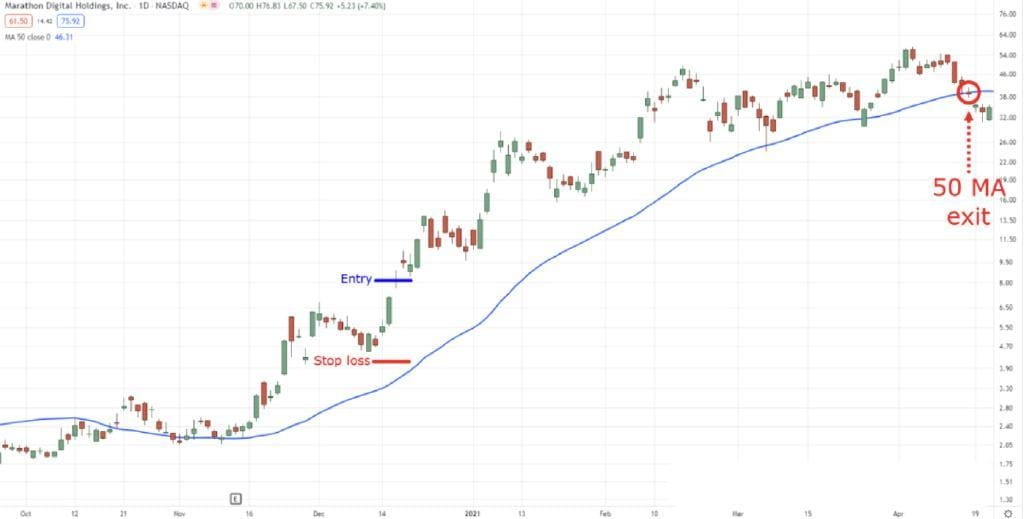
Assuming your goal is to capture medium-term trends, you will use the 50-period moving average as a reference. Currently, you expect the price to be above the 50-period moving average, as shown in the image below.
Price above the 50-period moving average on the MARA daily time frame

Then, you should patiently wait for a suitable bullish flag pattern to form and set the stop loss below the lowest point of that flag pattern, as shown in the image below.
Entering a bullish flag on the MARA daily time frame

Of course, any trading strategy that lacks exit rules is flawed. In this case, you should consider using the 50-period moving average as a benchmark for trailing stop losses, indicating that you will maintain your trading position without exiting until the price closes below the moving average, as shown in the image below.
50 MA trailing stop exit on the MARA daily time frame
I understand that this strategy seems very basic, but that is its essence, because the more random variables you introduce into your trading strategy, the harder it becomes to discern which factors are effective and which are ineffective (and which need further improvement or optimization). Nevertheless, if you are a trend-following trader, this strategy will suit you very well.
(2) Strategy 2: Bullish flag range breakout strategy
Using this strategy, your technical analysis skills will be tested. By now, you should have mastered drawing support and resistance levels. Remember, the strategy currently discussed is a range breakout strategy, meaning you need to identify range markets and accurately mark their support and resistance levels, as shown in the image below.
Support and resistance levels on the FCEL daily time frame

After successfully drawing the trading range, the next step is to observe whether the price touches the support area and forms an effective bullish flag pattern in that area or below, as shown in the image below.
FCEL daily time frame bullish flag setup
 At this stage, we cannot predict what type of trend will form if the market continues to develop. I recommend setting your profit target below the next resistance area indicated on the chart, as shown in the image below.
Fixed profit-taking on the bullish flag pattern within the daily time frame of FCEL

Similarly, you should have a certain proficiency in drawing support and resistance levels. Therefore, if you intend to improve your skills in marking these key levels on the chart, you can read relevant guides.
(3) Strategy 3: Bullish flag trend reversal strategy
Please remain objective; however, this strategy may be the most favored of the three strategies I introduced, due to its simplicity. Since this is a trend reversal strategy, you need to look for a market environment of a downward trend. Therefore, the more severe the market's hit, the more favorable the situation (this is the most attractive part of the strategy), as shown in the image below.
Downward trend on the U daily time frame

Once the market price breaks above the trend line resistance, you will expect the price to form a bullish flag pattern at this position, as shown in the image below.
Bullish flag on the U daily time frame

Bullish flag entry and stop loss on the U daily time frame
 Please allow me to reiterate, if the bullish flag pattern has not formed, then trading should not be conducted, as the absence of this pattern indicates that the price level is not effectively supported, so any potential breakout is likely false. Finally, I recommend adopting a strict trailing stop strategy, such as using the 20-period moving average as a reference, because the current trend may never develop further, or the market may be forming a new trading range, as shown in the image below.
Exit at the 20 MA on the U daily time frame

Therefore, you should immediately close your position upon hitting the trailing stop loss instead of setting a fixed profit target.
You might be pondering the following questions: Is this strategy effective in the Indian market? Does it apply to forex trading? Does it apply to cryptocurrency trading? The answer to all these questions is yes. But please note the following: for this strategy to effectively expand your trading portfolio, you must implement strict risk management measures, establish clear market selection criteria, and always follow your trading plan to execute trades.
5. Conclusion
Here are the core points summarized from this guide:
(1) The bullish flag pattern consists of a significant upward movement (i.e., market peak) followed by a series of hesitant candlesticks that form the flag.
(2) It is crucial to first identify the overall trend of the market price before trading using the bullish flag pattern.
(3) The bullish flag pattern can be applied to capture trend continuations, trend reversals, and range market breakouts.
(If you are still underwater, unable to see the overall market trend, when bullish it falls, when bearish it rises, pay attention to my homepage for sharing. While providing 'fish', also share 'fishing', making your operations even better, and be the sharpest blade in the market!)
$SPK $RESOLV #我的交易风格 #GENIUS稳定币法案


