#保护您的资产 ETH/USDT is inclined to oscillate slightly bullish in the short term, but key resistance levels should be monitored. The following are specific suggestions:
📈 Bullish signal:
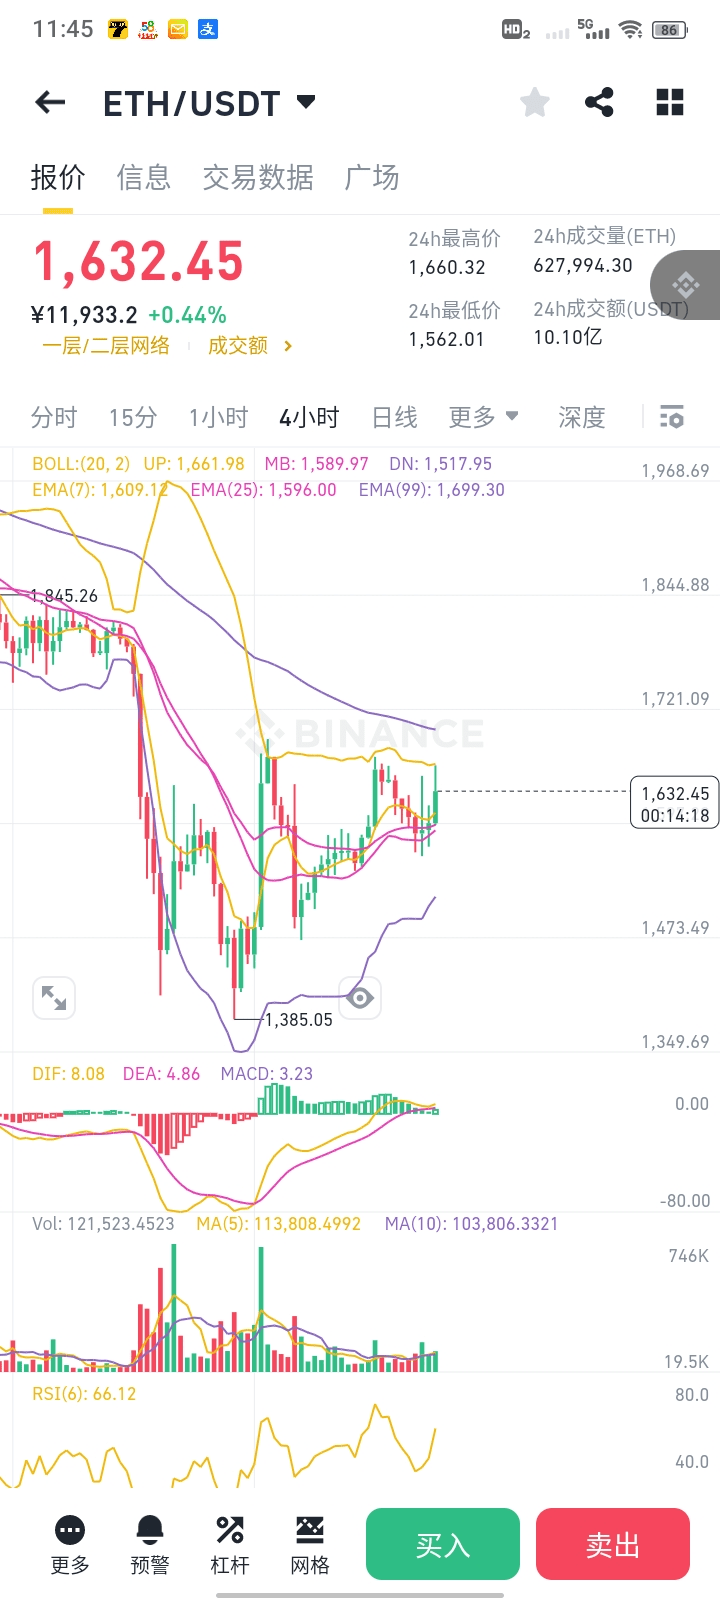
MACD golden cross: DIF crosses above DEA and the histogram turns positive, indicating strengthened short-term momentum.
BOLL channel trending upward: Price stabilizing at the middle band (1,589.97), approaching the upper band (1,661.98). If it breaks through, it may accelerate upwards.
RSI neutral to strong: RSI(6) is 66.12 (not overbought), still has room for upward movement.
Volume support: MA(5) volume is higher than MA(10), indicating active buying in the short term.
⚠️ Risk warning:
BOLL upper resistance: The current price (1,632.45) is close to the upper band (1,661.98), attention is needed to see if it can break through with increased volume.
EMA long-term resistance: The 99-day EMA (1,699.30) forms a medium to long-term resistance level.
🎯 Suggested entry point:
Aggressive strategy: Current price 1,632, take a small long position, set a stop loss below the middle band at 1,590, target 1,660 (upper band) → Look for 1,700 after a breakout.
Conservative strategy: If the price stabilizes around the BOLL middle band 1,590 on a pullback (along with RSI dropping to 50), enter the market, stop loss at 1,570, target as above.
Breakthrough follow-up: After breaking through 1,662 with increased volume, add positions if it doesn't break down on the pullback.
🔑 Key observation points:
Support: 1,590 (BOLL middle band/EMA7), 1,518 (BOLL lower band)
Resistance: 1,662 (BOLL upper band), 1,700 (EMA99)
It is advisable to verify the validity of the breakout in conjunction with real-time trading volume changes. If it peaks around 1,660 with decreased volume, partial profit-taking may be considered. $ETH