I. Core Judgment: Trend is bearish, beware of oversold rebounds
Clear Moving Average Pressure
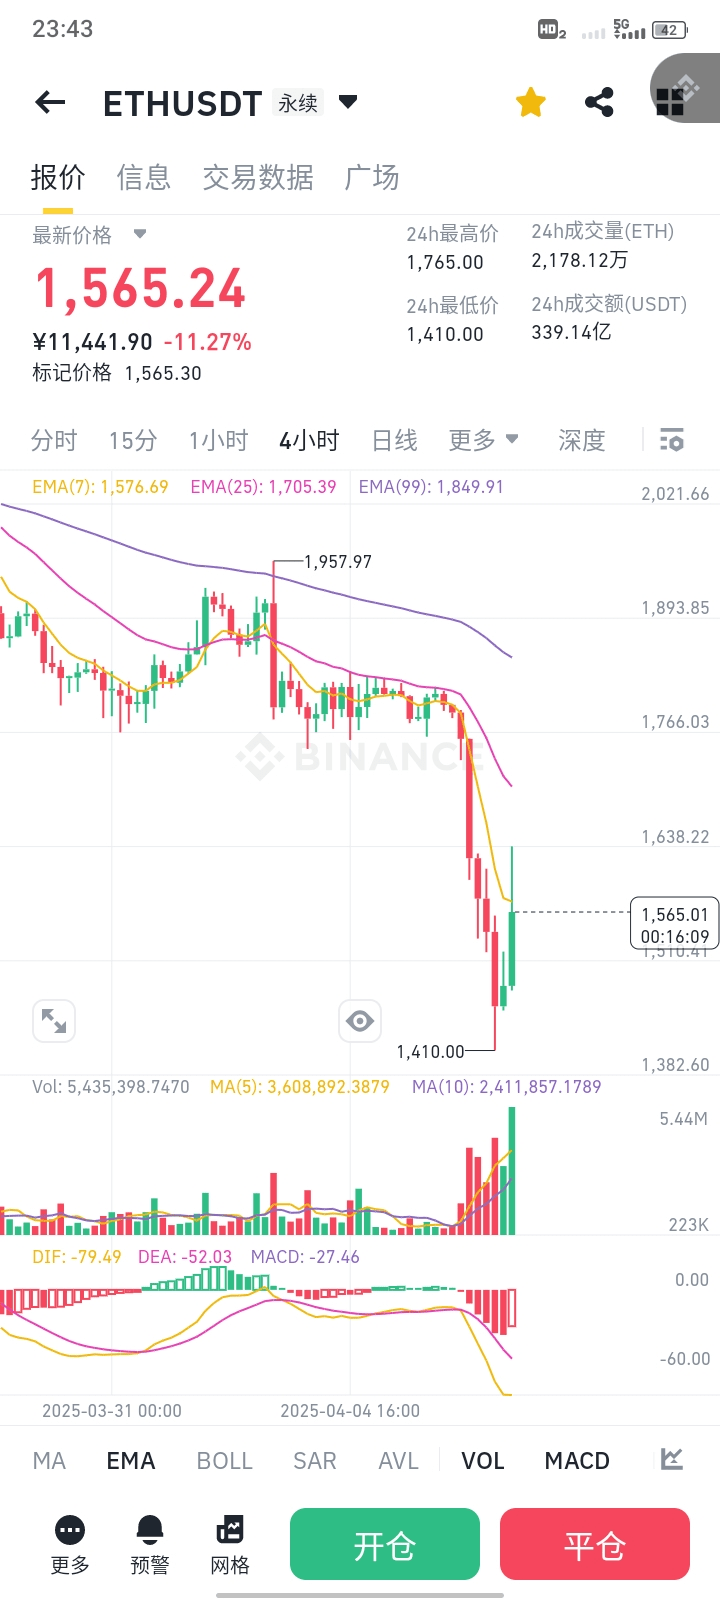
EMA Bearish Arrangement: EMA(7)=1,576.69 < EMA(25)=1,705.39 < EMA(99)=1,849.91, price (1,565.24) is below all moving averages, indicating a downward trend in the medium to long term.
Resistance Levels:
Short-term Resistance: Around EMA(7) (1,576), if it rebounds to this level and encounters resistance, consider a short position.
Strong Resistance Zone: EMA(25) (1,705) to the previous high of 1,765, breakthrough is very difficult.
MACD Momentum Divergence
DIF=49, DEA=-52.03, MACD histogram=-27.46: Indicators show bearish momentum is dominant, but the MACD histogram has rebounded from a low point (negative value narrowing), suggesting a weakening of short-term bearish momentum and a possibility of a rebound.
Key Signal: If DIF crosses above DEA forming a golden cross, it may trigger a rebound at the 1-2 hour level.
Volume-Price Divergence Risk
Current trading volume (5.44M) is significantly below MA(5) (3.6M) and MA(10) (2.41M), indicating that selling pressure has eased with decreased volume, but rebounds need volume confirmation (Volume must break through MA(5)).
II. Operating Strategy
Main Strategy: Trend-following Short (Higher Risk-Reward Ratio)
Entry Point
Short on Rebound: If the price rebounds to around EMA(7) (1,576) and shows signs of stagnation (like a long upper shadow), you can enter a short position with a light load.
Chasing Shorts on Break: If the price breaks below the 24-hour low of 1,410, add to the position, targeting the 1,380-1,350 area.
Stop Loss and Take Profit
Stop Loss: Set short stop loss above EMA(25) (1,705) or previous high 1,765 (adjust flexibly based on position).
Take Profit: First target 1,450 (above previous low support), second target 1,380 (strong psychological level).
Next Strategy: Oversold Rebound (High Risk, Strict Risk Control Required)
Reversal Conditions
Price stabilizes above 1,550 and breaks through EMA(7) (1,576) with volume, while MACD histogram turns positive and DIF crosses above DEA.
15-minute candlestick shows reversal patterns like 'Bullish Engulfing' or 'Morning Star'.
Entry and Risk Control
Try Long: Enter with a light load after stabilizing in the 1,550-1,565 range, set stop-loss at 1,530 (below previous lows).
Take Profit: Target 1,620 (near EMA(25)), if it breaks through, target 1,700.
III. Key Support and Resistance
Lower Support:
1,410 (24-hour low): If it breaks, it opens up downside potential.
1,380 (Psychological Level): Strong support area tested multiple times in 2023.
Upper Resistance:
1,576-1,600 (EMA(7) + Round Number): First pressure zone for rebound.
1,705-1,765 (EMA(25) + Previous High): Strong resistance zone, short defense line.
IV. Risk Warning
Increased Volatility: 24-hour volatility reached 25.5% (1,410-1,765), avoid heavy positions, control position size within 5%.
Liquidity Trap: After the European and American trading sessions end, Asian markets may lack depth, beware of price spikes.
Event-driven Risks: Pay attention to ETH ecosystem upgrades, regulatory dynamics, and BTC market correlation effects.
Summary
Short-term bearish, proceed with caution on rebounds. Prioritize short opportunities around 1,576 (EMA(7)); if it breaks down with volume below 1,410, you can add to your position. Aggressive traders must strictly adhere to stop-loss and trade quickly if betting on a rebound. Current market sentiment is bearish, suggesting trend-following trading as the core logic, avoiding counter-trend positions.